CS student Peter Beshai creates Buckets, popular basketball shot visualization tool
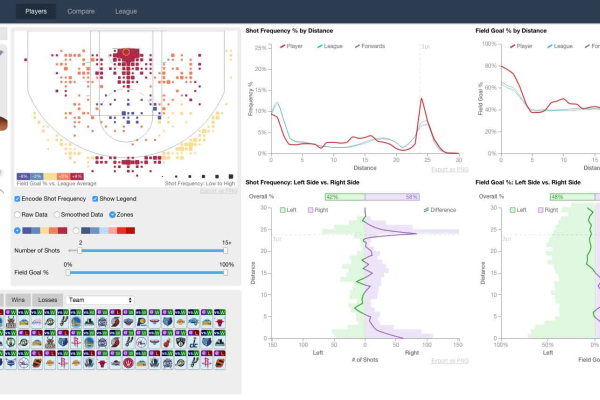
Buckets is a tool that provides interactive visualizations of the shooting performance of all players in the NBA from the past four seasons. Various charts are used to depict variation in shooting frequency and shooting accuracy broken down by the location shots were taken from on the court. Users can explore individual players in detail, compare multiple players at once, and discover overall trends across the league. It was created as the final project in CPSC 547, a graduate course on Information Visualization.
Buckets has received considerable attention on social media (Reddit: link, link, Twitter: link, link, Flowing Data), demonstrating its appeal to NBA fans, casual basketball analysts, and to people interested in information visualization.