Statistics
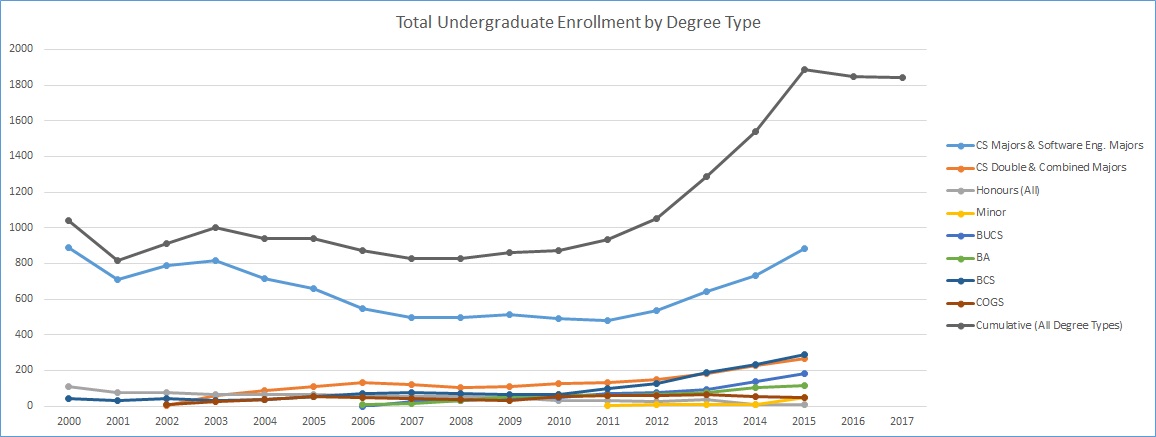
Total Undergraduate Enrollment by Degree Type
| CS Majors & Software Eng. Majors | CS Double & Combined Majors | Honours (All) | Minor | BUCS | BA | BCS | COGS | Cumulative (All Degree Types) | |
| 2000 | 887 | 107 | 45 | 1039 | |||||
| 2001 | 708 | 76 | 30 | 814 | |||||
| 2002 | 788 | 1 | 75 | 42 | 7 | 913 | |||
| 2003 | 817 | 62 | 66 | 31 | 27 | 1003 | |||
| 2004 | 713 | 86 | 66 | 39 | 37 | 941 | |||
| 2005 | 659 | 109 | 66 | 55 | 52 | 941 | |||
| 2006 | 549 | 134 | 59 | 5 | 10 | 68 | 49 | 874 | |
| 2007 | 494 | 122 | 56 | 23 | 17 | 74 | 44 | 830 | |
| 2008 | 495 | 106 | 52 | 34 | 33 | 73 | 37 | 830 | |
| 2009 | 511 | 108 | 49 | 48 | 51 | 66 | 31 | 864 | |
| 2010 | 491 | 124 | 33 | 46 | 63 | 67 | 51 | 875 | |
| 2011 | 481 | 131 | 32 | 5 | 68 | 59 | 96 | 61 | 933 |
| 2012 | 538 | 150 | 28 | 6 | 78 | 65 | 129 | 59 | 1053 |
| 2013 | 641 | 180 | 36 | 7 | 92 | 76 | 189 | 67 | 1288 |
| 2014 | 733 | 230 | 6 | 9 | 139 | 106 | 233 | 52 | 1538 |
| 2015 | 883 | 269 | 10 | 50 | 184 | 117 | 289 | 48 | 1887 |
| 2016 | 1847 | ||||||||
| 2017 | 1840 |
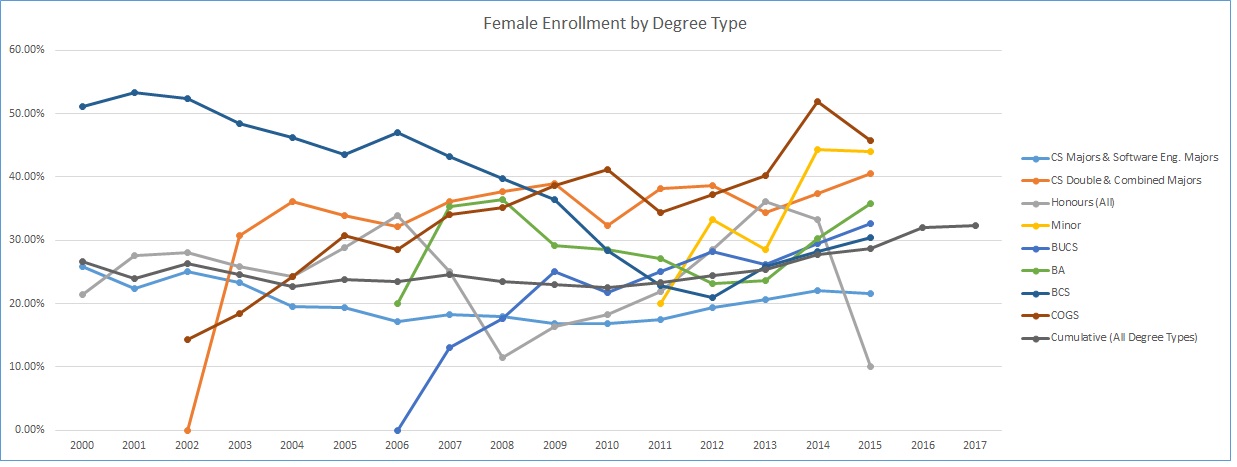
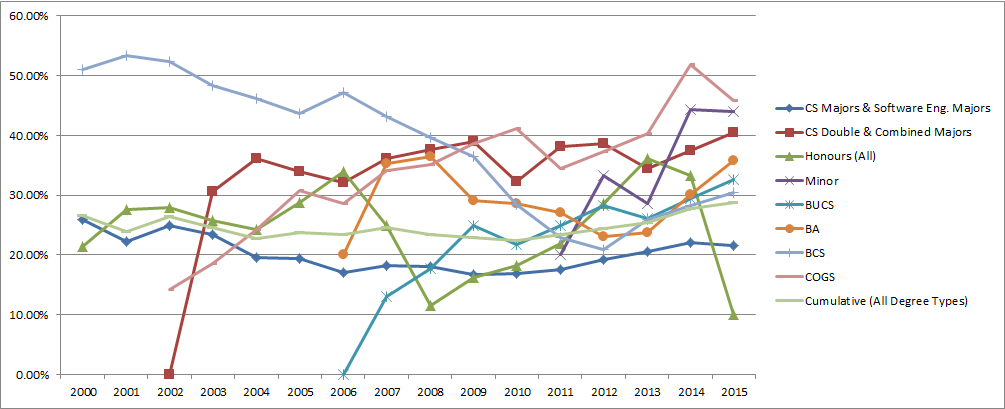
Female Enrollment by Degree Type:
| CS Majors & Software Eng. Majors | CS Double & Combined Majors | Honours (All) | Minor | BUCS | BA | BCS | COGS | Cumulative (All Degree Types) | |
| 2000 | 25.9% | 21.5% | 51.1% | 26.6% | |||||
| 2001 | 22.3% | 27.6% | 53.3% | 24.0% | |||||
| 2002 | 25.0% | 0.0% | 28.0% | 52.4% | 14.3% | 26.4% | |||
| 2003 | 23.4% | 30.7% | 25.8% | 48.4% | 18.5% | 24.6% | |||
| 2004 | 19.6% | 36.1% | 24.2% | 46.2% | 24.3% | 22.7% | |||
| 2005 | 19.4% | 33.9% | 28.8% | 43.6% | 30.8% | 23.8% | |||
| 2006 | 17.1% | 32.1% | 33.9% | 0.0% | 20.0% | 47.1% | 28.6% | 23.5% | |
| 2007 | 18.2% | 36.1% | 25.0% | 13.0% | 35.3% | 43.2% | 34.1% | 24.6% | |
| 2008 | 18.0% | 37.7% | 11.5% | 17.7% | 36.5% | 39.7% | 35.1% | 23.5% | |
| 2009 | 16.8% | 38.9% | 16.3% | 25.0% | 29.1% | 36.4% | 38.7% | 23.0% | |
| 2010 | 16.9% | 32.3% | 18.2% | 21.7% | 28.6% | 28.4% | 41.2% | 22.5% | |
| 2011 | 17.5% | 38.2% | 21.9% | 20.0% | 25.0% | 27.1% | 22.9% | 34.4% | 23.4% |
| 2012 | 19.3% | 38.7% | 28.6% | 33.3% | 28.2% | 23.1% | 20.9% | 37.3% | 24.5% |
| 2013 | 20.6% | 34.4% | 36.1% | 28.6% | 26.1% | 23.7% | 25.9% | 40.3% | 25.4% |
| 2014 | 22.1% | 37.4% | 33.3% | 44.4% | 29.5% | 30.2% | 28.3% | 51.9% | 27.8% |
| 2015 | 21.6% | 40.5% | 10% | 44% | 32.6% | 35.8% | 30.4% | 45.8% | 28.7% |
| 2016 | 32.0% | ||||||||
| 2017 | 32.4%u_female_percent.png |
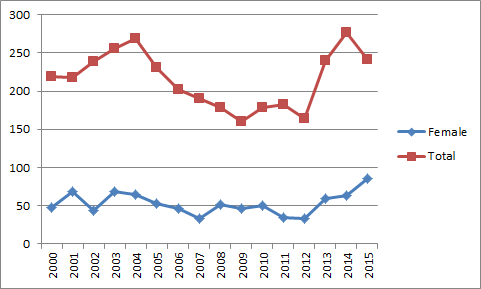
Undergraduate Students Convocations
C.S. Program Entry by Year Level
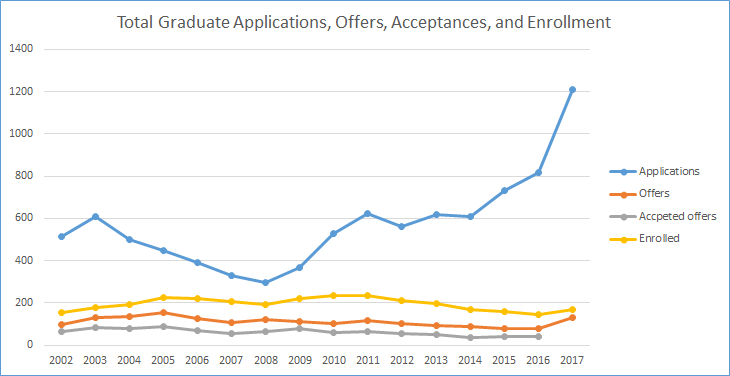
Total Graduate Applications, Offers, Acceptances, and Enrollment
| Applications | Offers | Accpeted offers | Enrolled | |
| 2002 | 515 | 96 | 64 | 153 |
| 2003 | 611 | 130 | 83 | 180 |
| 2004 | 499 | 136 | 80 | 194 |
| 2005 | 447 | 155 | 86 | 225 |
| 2006 | 390 | 124 | 68 | 221 |
| 2007 | 330 | 107 | 55 | 208 |
| 2008 | 298 | 120 | 64 | 193 |
| 2009 | 369 | 113 | 78 | 222 |
| 2010 | 530 | 101 | 58 | 233 |
| 2011 | 625 | 118 | 63 | 235 |
| 2012 | 561 | 102 | 57 | 213 |
| 2013 | 620 | 95 | 51 | 196 |
| 2014 | 609 | 86 | 38 | 170 |
| 2015 | 730 | 79 | 40 | 159 |
| 2016 | 819 | 80 | 41 | 144 |
| 2017 | 1208 | 130 | 167 |
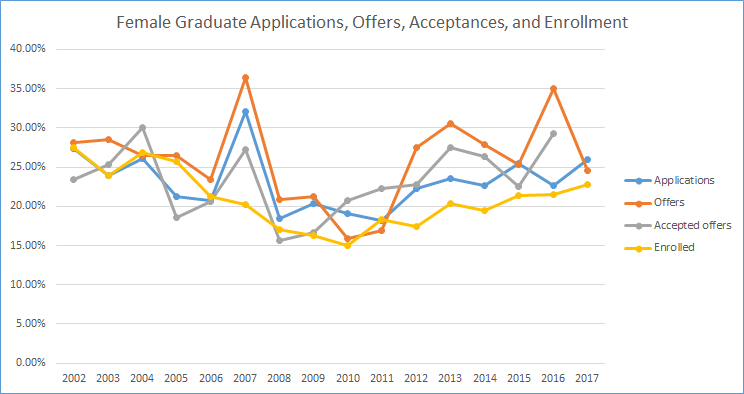
Female Graduate Applications, Offers, Acceptances, and Enrollment
| Applications | Offers | Accepted offers | Enrolled | |
| 2002 | 27.37% | 28.12% | 23.43% | 27.45% |
| 2003 | 23.89% | 28.46% | 25.3% | 23.88% |
| 2004 | 26.05% | 26.47% | 30% | 26.8% |
| 2005 | 21.25% | 26.45% | 18.6% | 25.77% |
| 2006 | 20.76% | 23.38% | 20.58% | 21.26% |
| 2007 | 32.12% | 36.44% | 27.27% | 20.19% |
| 2008 | 18.45% | 20.83% | 15.62% | 17.09% |
| 2009 | 20.32% | 21.23% | 16.66% | 16.21% |
| 2010 | 19.05% | 15.84% | 20.68% | 15.02% |
| 2011 | 18.24% | 16.94% | 22.22% | 18.29% |
| 2012 | 22.28% | 27.45% | 22.8% | 17.37% |
| 2013 | 23.54% | 30.52% | 27.45% | 20.4% |
| 2014 | 22.66% | 27.9% | 26.31% | 19.41% |
| 2015 | 25.47% | 25.31% | 22.50% | 21.38% |
| 2016 | 22.71% | 35% | 29.26% | 21.52% |
| 2017 | 25.91% | 24.61% | 22.75% |
Graduate Convocations
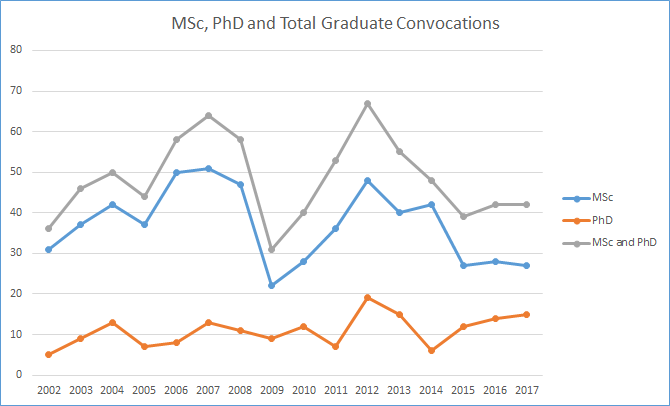
MSc, PhD and Total Graduate Convocations
| MSc | PhD | MSc and PhD | |
| 2002 | 31 | 5 | 36 |
| 2003 | 37 | 9 | 46 |
| 2004 | 42 | 13 | 50 |
| 2005 | 37 | 7 | 44 |
| 2006 | 50 | 8 | 58 |
| 2007 | 51 | 13 | 64 |
| 2008 | 47 | 11 | 58 |
| 2009 | 22 | 9 | 31 |
| 2010 | 28 | 12 | 40 |
| 2011 | 36 | 7 | 53 |
| 2012 | 48 | 19 | 67 |
| 2013 | 40 | 15 | 55 |
| 2014 | 42 | 6 | 48 |
| 2015 | 27 | 12 | 39 |
| 2016 | 28 | 14 | 42 |
| 2017 | 27 | 15 | 42 |
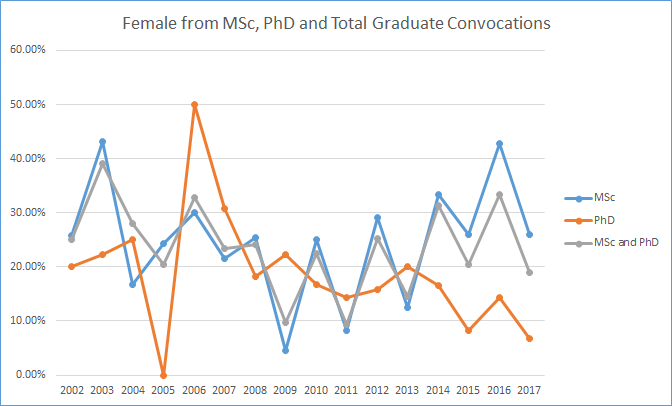
Female from MSc, PhD and Total Graduate Convocations
| MSc | PhD | MSc and PhD | |
| 2002 | 25.8% | 20.0% | 25.0% |
| 2003 | 43.2% | 22.2% | 39.1% |
| 2004 | 16.7% | 53.9% | 28.0% |
| 2005 | 24.3% | 0.0% | 20.5% |
| 2006 | 30.0% | 25.0% | 32.8% |
| 2007 | 21.6% | 30.8% | 23.4% |
| 2008 | 25.5% | 18.2% | 24.1% |
| 2009 | 4.6% | 22.2% | 9.7% |
| 2010 | 25.0% | 16.7% | 22.5% |
| 2011 | 8.3% | 14.3% | 9.3% |
| 2012 | 29.2% | 15.8% | 25.3% |
| 2013 | 12.5% | 20.0% | 14.5% |
| 2014 | 33.3% | 16.6% | 31.3% |
| 2015 | 25.9% | 8.3% | 20.5% |
| 2016 | 42.8% | 14.3% | 33.3% |
| 2017 | 25.9% | 6.7% | 19.0% |