publications: papers, chapters, books, and monographs

Dirty Data in the Newsroom: Comparing Data Preparation in Journalism and Data Science

Stephen Kasica, Charles Berret, and Tamara Munzner
Proc. CHI Conf. Human Factors in Computing Systems (CHI), 2023

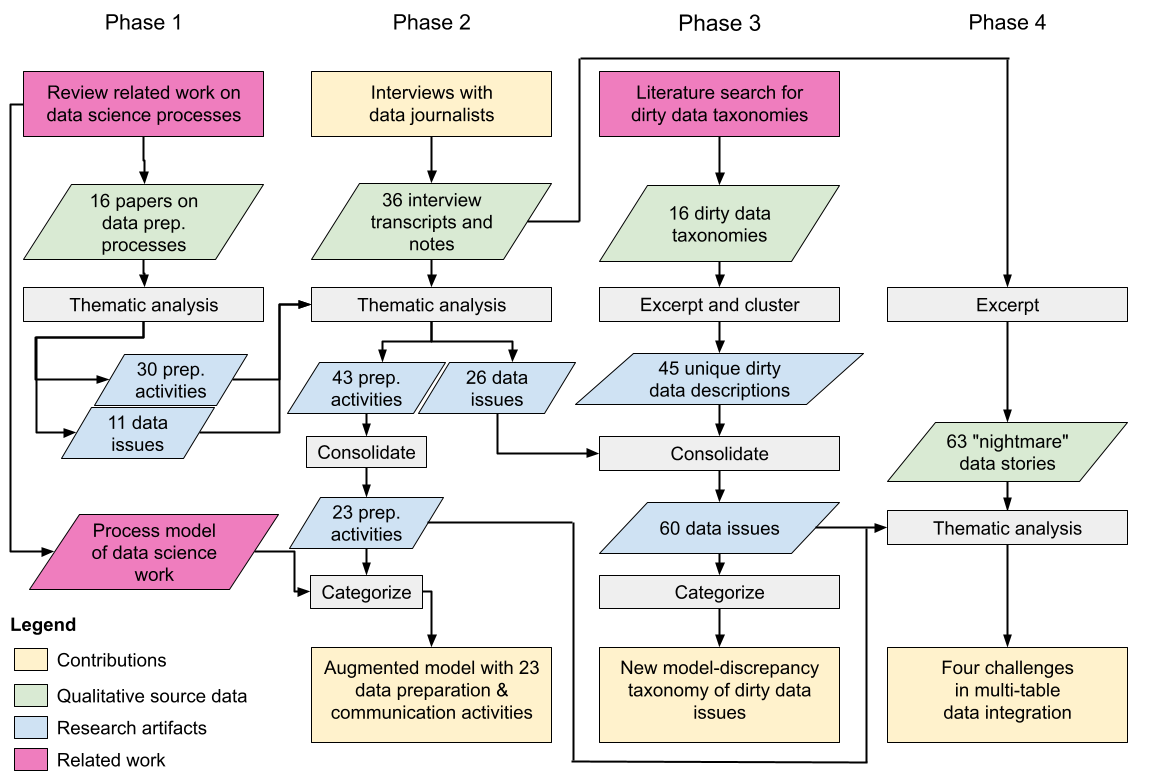
The work involved in gathering, wrangling, cleaning, and otherwise preparing data for analysis is often the most time consuming and tedious aspect of data work. Although many studies describe data preparation within the context of data science workflows, there has been little research on data preparation in data journalism. We address this gap with a hybrid form of thematic analysis that combines deductive codes derived from existing accounts of data science workflows and inductive codes arising from an interview study with 36 professional data journalists. We extend a previous model of data science work to incorporate detailed activities of data preparation. We synthesize 60 dirty data issues from 16 taxonomies on dirty data and our interview data, and we provide a novel taxonomy to characterize these dirty data issues as discrepancies between mental models. We also identify four challenges faced by journalists: diachronic, regional, fragmented, and disparate data sources.

VizSnippets: Compressing Visualization Bundles Into Representative Previews for Browsing Visualization Collections

Michael Oppermann and Tamara Munzner
IEEE Transactions on Visualization and Computer Graphics (TVCG), Proc. IEEE VIS 2021, 2022.

Visualization collections, accessed by platforms such as Tableau Online or Power BI, are used by millions of people to share and access diverse analytical knowledge in the form of interactive visualization bundles. Result snippets, compact previews of these bundles, are presented to users to help them identify relevant content when browsing collections. Our engagement with Tableau product teams and review of existing snippet designs on five platforms showed us that current practices fail to help people judge the relevance of bundles because they include only the title and one image. Users frequently need to undertake the time-consuming endeavour of opening a bundle within its visualization system to examine its many views and dashboards. In response, we contribute the first systematic approach to visualization snippet design. We propose a framework for snippet design that addresses eight key challenges that we identify. We present a computational pipeline to compress the visual and textual content of bundles into representative previews that is adaptive to a provided pixel budget and provides high information density with multiple images and carefully chosen keywords.

TimeElide: Visual Analysis of Non-Contiguous Time Series Slices

Michael Oppermann, Luce Liu, and Tamara Munzner
IEEE VIS Short Papers 2021

We introduce the design and implementation of TimeElide, a visual analysis tool for the novel data abstraction of non-contiguous time series slices, namely time intervals that contain a sequence of time-value pairs but are not adjacent to each other. We present a visual encoding design space as an underpinning of TimeElide, and the new sparkbox technique for visualizing fine and coarse grained temporal structures within one view. Datasets from different domains and with varying characteristics guided the development and their analysis provides preliminary evidence of TimeElide's utility.

GEViTRec: Data Reconnaissance Through Recommendation Using a Domain-Specific Visualization Prevalence Design Space

Anamaria Crisan, Shannah Elizabeth Fisher, Jennifer L. Gardy, and Tamara Munzner
IEEE Transactions on Visualization and Computer Graphics (TVCG), 2021, Early Access.

Genomic Epidemiology (genEpi) is a branch of public health that uses many different data types including tabular, network, genomic, and geographic, to identify and contain outbreaks of deadly diseases. Due to the volume and variety of data, it is challenging for genEpi domain experts to conduct data reconnaissance; that is, have an overview of the data they have and make assessments toward its quality, completeness, and suitability. We present an algorithm for data reconnaissance through automatic visualization recommendation, GEViTRec. Our approach handles a broad variety of dataset types and automatically generates visually coherent combinations of charts, in contrast to existing systems that primarily focus on singleton visual encodings of tabular datasets. We automatically detect linkages across multiple input datasets by analyzing non-numeric attribute fields, creating a data source graph within which we analyze and rank paths. For each high-ranking path, we specify chart combinations with positional and color alignments between shared fields, using a gradual binding approach to transform initial partial specifications of singleton charts to complete specifications that are aligned and oriented consistently. A novel aspect of our approach is its combination of domain-agnostic elements with domain-specific information that is captured through a domain-specific visualization prevalence design space. Our implementation is applied to both synthetic data and real Ebola outbreak data. We compare GEViTRec's output to what previous visualization recommendation systems would generate, and to manually crafted visualizations used by practitioners. We conducted formative evaluations with ten genEpi experts to assess the relevance and interpretability of our results.

Visualizing Graph Neural Networks with CorGIE: Corresponding a Graph to Its Embedding

Zipeng Liu, Yang Wang, Jürgen Bernard, and Tamara Munzner
IEEE TVCG 2022, to appear

Graph neural networks (GNNs) are a class of powerful machine learning tools that model node relations for making predictions of nodes or links. GNN developers rely on quantitative metrics of the predictions to evaluate a GNN, but similar to many other neural networks, it is difficult for them to understand if the GNN truly learns characteristics of a graph as expected. We propose an approach to corresponding an input graph to its node embedding (aka latent space), a common component of GNNs that is later used for prediction. We abstract the data and tasks, and develop an interactive multi-view interface called CorGIE to instantiate the abstraction. As the key function in CorGIE, we propose the K-hop graph layout to show topological neighbors in hops and their clustering structure. To evaluate the functionality and usability of CorGIE, we present how to use CorGIE in two usage scenarios, and conduct a case study with two GNN experts.

Data-First Visualization Design Studies

Michael Oppermann and Tamara Munzner
IEEE VIS Workshop Evaluation and Beyond - Methodological Approaches for Visualization (BELIV), 2020

We introduce the notion of a data-first design study which is triggered by the acquisition of real-world data instead of specific stakeholder analysis questions. We propose an adaptation of the design study methodology framework to provide practical guidance and to aid transferability to other data-first design processes. We discuss opportunities and risks by reflecting on two of our own data-first design studies. We review 64 previous design studies and identify 16 of them as edge cases with characteristics that may indicate a data-first design process in action.

VizCommender: Computing Text-Based Similarity in Visualization Repositories for Content-Based Recommendations

Michael Oppermann, Robert Kincaid, and Tamara Munzner
IEEE Transactions on Visualization and Computer Graphics (TVCG), 2020.

Cloud-based visualization services have made visual analytics accessible to a much wider audience than ever before. Systems such as Tableau have started to amass increasingly large repositories of analytical knowledge in the form of interactive visualization workbooks. When shared, these collections can form a visual analytic knowledge base. However, as the size of a collection increases, so does the difficulty in finding relevant information. Content-based recommendation (CBR) systems could help analysts in finding and managing workbooks relevant to their interests. Toward this goal, we focus on text-based content that is representative of the subject matter of visualizations rather than the visual encodings and style. We discuss the challenges associated with creating a CBR based on visualization specifications and explore more concretely how to implement the relevance measures required using Tableau workbook specifications as the source of content data. We also demonstrate what information can be extracted from these visualization specifications and how various natural language processing techniques can be used to compute similarity between workbooks as one way to measure relevance. We report on a crowd-sourced user study to determine if our similarity measure mimics human judgement. Finally, we choose latent Dirichlet allocation (LDA) as a specific model and instantiate it in a proof-of-concept recommender tool to demonstrate the basic function of our similarity measure.

A systematic method for surveying data visualizations and a resulting genomic epidemiology visualization typology: GEViT

Anamaria Crisan, Jennifer L. Gardy, and Tamara Munzner
In Bioinformatics, May 2019

Data visualization is an important tool for exploring and communicating findings from genomic and healthcare datasets. Yet, without a systematic way of organizing and describing the design space of data visualizations, researchers may not be aware of the breadth of possible visualization design choices or how to distinguish between good and bad options. We have developed a method that systematically surveys data visualizations using the analysis of both text and images. Our method supports the construction of a visualization design space that is explorable along two axes: why the visualization was created and how it was constructed. We applied our method to a corpus of scientific research articles from infectious disease genomic epidemiology and derived a Genomic Epidemiology Visualization Typology (GEViT) that describes how visualizations were created from a series of chart types, combinations, and enhancements. We have also implemented an online gallery that allows others to explore our resulting design space of visualizations. Our results have important implications for visualization design and for researchers intending to develop or use data visualization tools. Finally, the method that we introduce is extensible to constructing visualizations design spaces across other research areas.

Adjutant: an R-based tool to support topic discovery for systematic and literature reviews

Anamaria Crisan, Tamara Munzner, and Jennifer L. Gardy
In Bioinformatics, March 2019

Adjutant is an open-source, interactive, and R-based application to support mining PubMed for literature reviews. Given a PubMed-compatible search query, Adjutant downloads the relevant articles and allows the user to perform an unsupervised clustering analysis to identify data-driven topic clusters. Following clustering, users can also sample documents using different strategies to obtain a more manageable dataset for further analysis. Adjutant makes explicit trade-offs between speed and accuracy, which are modifiable by the user, such that a complete analysis of several thousand documents can take a few minutes. All analytic datasets generated by Adjutant are saved, allowing users to easily conduct other downstream analyses that Adjutant does not explicitly support.

Ocupado: Visualizing Location-Based Counts Over Time Across Buildings

Michael Oppermann and Tamara Munzner
Computer Graphics Forum (Proc. EuroVis 2020).

We present a multi-year design study that resulted in Ocupado, a set of visual decision-support tools centered around occupancy data for stakeholders in facilities management and planning. Ocupado uses WiFi devices as a proxy for human presence, capturing location-based counts that preserve privacy without trajectories. We contribute data and task abstractions for studying space utilization for combinations of data granularities in both space and time. In addition, we contribute generalizable design choices for visualizing location-based counts relating to indoor environments.

Data-driven Multi-level Segmentation of Image Editing Logs

Zipeng Liu, Zhicheng Liu, Tamara Munzner
Proc. CHI Conf. Human Factors in Computing Systems (CHI), 2020

We propose a multi-level segmentation model that works for many image editing tasks including poster creation, portrait retouching, and special effect creation. Our model takes into account features derived from four event attributes collected in realistically complex Photoshop sessions with expert users: command, timestamp, image content, and artwork layer.

The Sprawlter Graph Readability Metric: Combining Sprawl and Area-aware Clutter

Zipeng Liu, Takayuki Itoh, Jessica Q. Dawson, Tamara Munzner
IEEE Transactions on Visualization and Computer Graphics (TVCG), 2020.

We propose the sprawlter metric for node-link graph readability to measure both sprawl, which is the sparsity of graph elements, and clutter in a more detailed way, which goes beyond traditional counts and handles multi-level graph layout.

Uncovering Data Landscapes through Data Reconnaissance and Task Wrangling.

Anamaria Crisan and Tamara Munzner
IEEE VIS

Domain experts are inundated with new and heterogeneous types of data and require better and more specific types of data visualization systems to help them. In this paper, we consider the data landscape that domain experts seek to understand, namely the set of datasets that are either currently available or could be obtained. Experts need to understand this landscape to triage which data analysis projects might be viable, out of the many possible research questions that they could pursue. We identify data reconnaissance and task wrangling as processes that experts undertake to discover and identify sources of data that could be valuable for some specific analysis goal. These processes have thus far not been formally named or defined by the research community. We provide formal definitions of data reconnaissance and task wrangling and describe how they relate to the data landscape that domain experts must uncover. We propose a conceptual framework with a four-phase cycle of acquire, view, assess, and pursue that occurs within three distinct chronological stages, which we call fog and friction, informed data ideation, and demarcation of final data. Collectively, these four phases embedded within three temporal stages delineate an expert’s progressively evolving understanding of the data landscape. We describe and provide concrete examples of these processes within the visualization community through an initial systematic analysis of previous design studies, identifying situations where there is evidence that they were at play. We also comment on the response of domain experts to this framework, and suggest design implications stemming from these processes to motivate future research directions. As technological changes will only keep adding unknown terrain to the data landscape, data reconnaissance and task wrangling are important processes that need to be more widely understood and supported by the data visualization tools. By articulating a concrete understanding of this challenge and its implications, our work impacts the design and evaluation of data visualization systems.

How to Evaluate an Evaluation Study? Comparing and Contrasting Practices in Vis with Those of Other Disciplines.

Ana Crisan and Madison Elliott
BELIV'18 - an IEEE VIS affilitated workshop

Evaluative practices within vis research are not routinely comparedto those of psychology, sociology, or other areas of empirical study,leaving vis vulnerable to the replicability crisis that has embroiledscientific research more generally. In this position paper, we com-pare contemporary vis evaluative practices against those in thoseother disciplines, and make concrete recommendations as to how visevaluative practice can be improved through the use of quantitative,qualitative, and mixed research methods. We summarize our discus-sion and recommendations as a checklist, that we intend to be useda resource for vis researchers conducting evaluative studies, and forreviewers evaluating the merits of such studies.

Segmentifier: Interactive Refinement of Clickstream Data.

Kimberly Dextras-Romagnino, and Tamara Munzner,
Computer Graphics Forum (Proceedings of EuroVis 2019).

Clickstream data has the potential to provide insights into e-commerce consumer behavior, but previous techniques fall short of handling the scale and complexity of real-world datasets because they require relatively clean and small input. We present Segmentifier, a novel visual analytics interface that supports an iterative process of refining collections of action sequences into meaningful segments. We present task and data abstractions for clickstream data analysis, leading to a high-level model built around an iterative view-refine-record loop with outcomes of conclude with an answer, export segment for further analysis in downstream tools, or abandon the question for a more fruitful analysis path. Segmentifier supports fast and fluid refinement of segments through tightly coupled visual encoding and interaction with a rich set of views that show evocative derived attributes for segments, sequences, and actions in addition to underlying raw sequences. These views support fast and fluid refinement of segments through filtering and partitioning attribute ranges. Interactive visual queries on custom action sequences are aggregated according to a three-level hierarchy. Segmentifier features a detailed glyph-based visual history of the automatically recorded analysis process showing the provenance of each segment as an analysis path of attribute constraints. We demonstrate the effectiveness of our approach through a usage scenario with real-world data and a case study documenting the insights gained by a corporate e-commerce analyst.

Aggregated Dendrograms for Visual Comparison Between Many Phylogenetic Trees.

Zipeng Liu, Shing Hei Zhan, and Tamara Munzner,
IEEE Transactions on Visualization and Computer Graphics (TVCG), 2019.

We present the new visual encoding idiom of aggregated dendrograms to concisely summarize the topological relationships between interactively chosen focal subtrees according to biologically meaningful criteria, and provide a layout algorithm that automatically adapts to the available screen space.

Uncovering Spatiotemporal Dynamics From Non-Trajectory Data.

Michael Oppermann and Tamara Munzner
CityVis Workshop at IEEE VIS 2018.

We discuss general implications of spatiotemporal non-trajectory data in terms of ethics, data preprocessing, tasks, and visual encodings.

Evidence-Based Design and Evaluation of a Whole Genome Sequencing Clinical Report for the Reference Microbiology Laboratory.

Anamaria Crisan, Geoff McKee, Tamara Munzner, and Jennifer L. Gardy

Microbial genomics is playing an increasingly important role in public health microbiology, and its successful implementation in the clinic will rely not just on validation and accreditation of WGS-based tests, but also in how effective the resulting reports are to stakeholders, including clinicians, nurses, laboratory staff, researchers, and surveillance expert. Using design study methodology, we developed a two-page report template to communicate WGS-derived test results related to TB diagnosis, drug susceptibility testing, and clustering. The process and findings for this WGS report design project target domain specialists in the microbial genomics community who typically develop such reports and also more complex bioinformatics software, however we also present the aspects of our work that we believe are of interest to the Information Visualization research community.

Bridging From Goals to Tasks with Design Study Analysis Reports.

Heidi Lam, Melanie Tory, and Tamara Munzner
In IEEE Transactions on Visualization and Computer Graphics (TVCG, Proceedings of InfoVis 2017).

Framework based on analysis reports derived from open-coding 20 design study papers published at IEEE InfoVis 2009-2015, to build on the previous work of abstractions that collectively encompass a broad variety of domains.

Timelines Revisited: A Design Space and Considerations for Expressive Storytelling.

Matthew Brehmer, Bongshin Lee, Benjamin Bach, Nathalie Henry Riche, and Tamara Munzner
In IEEE Transactions on Visualization and Computer Graphics (TVCG).

There are many ways to visualize event sequences as timelines. In a storytelling context where the intent is to convey multiple narrative points, a richer set of timeline designs may be more appropriate than the narrow range that has been used for exploratory data analysis by the research community. Informed by a survey of 263 timelines, we present a design space for storytelling with timelines that balances expressiveness and effectiveness, identifying 14 design choices characterized by three dimensions: representation, scale, and layout. Twenty combinations of these choices are viable timeline designs that can be matched to different narrative points, while smooth animated transitions between narrative points allow for the presentation of a cohesive story, an important aspect of both interactive storytelling and data videos. We further validate this design space by realizing the full set of viable timeline designs and transitions in a proof-of-concept sandbox implementation that we used to produce seven example timeline stories. Ultimately, this work is intended to inform and inspire the design of future tools for storytelling with timelines.

On Regulatory and Organizational Constraints in Visualization Design and Evaluation.

Anamaria Crisan, Jennifer Gardy, and Tamara Munzner
In Proceedings of the ACM Workshop on Beyond time and errors: novel evaluation methods for Information Visualization (BELIV), 2016, p. 1-9.

Problem-based visualization research provides explicit guidance toward identifying and designing for the needs of users, but absent is more concrete guidance toward factors external to a user's needs that also have implications for visualization design and evaluation. This lack of more explicit guidance can leave visualization researchers and practitioners vulnerable to unforeseen constraints beyond the user's needs that can affect the validity of evaluations, or even lead to the premature termination of a project. Here we explore two types of external constraints in depth, regulatory and organizational constraints, and describe how these constraints impact visualization design and evaluation. By borrowing from techniques in software development, project management, and visualization research we recommend strategies for identifying, mitigating, and evaluating these external constraints through a design study methodology. Finally, we present an application of those recommendations in a healthcare case study. We argue that by explicitly incorporating external constraints into visualization design and evaluation, researchers and practitioners can improve the utility and validity of their visualization solution and improve the likelihood of successful collaborations with industries where external constraints are more present.

SEQIT: Visualizing Sequences of Interest in Eye Tracking Data.

Mike Wu and Tamara Munzner.
Poster Proceedings of IEEE Conference on Information Visualization (InfoVis) 2015.

A visualization system designed for sequence analysis of eye tracking data.

Matches, Mismatches, and Methods: Multiple-View Workflows for Energy Portfolio Analysis.

Matthew Brehmer, Jocelyn Ng, Kevin Tate, and Tamara Munzner.
IEEE Transactions on Visualization and Computer Graphics (TVCG, Proceedings of InfoVis 2015), 22(1), p. 449-458, 2016.

A design study in the domain of commercial energy management and conservation.

TimeLineCurator: Interactive Authoring of Visual Timelines from Unstructured Text.

Johanna Fulda, Matthew Brehmer, and Tamara Munzner.
IEEE Transactions on Visualization and Computer Graphics (TVCG, Proceedings of VAST 2015), 22(1), p. 300-309, 2016.

Browser-based vis tool for curating timelines generated from freeform text.

Detangler: Visual Analytics for Multiplex Networks.

Benjamin Renoust, Guy Melançon, and Tamara Munzner.
Computer Graphics Forum (Proceedings of EuroVis 2015).

A multiplex network has links of different types, allowing it to express many overlapping types of relationships. A core task in network analysis is to evaluate and understand group cohesion; that is, to explain why groups of elements belong together based on the underlying structure of the network. We present Detangler, a system that supports visual analysis of group cohesion in multiplex networks through dual linked views. These views feature new data abstractions derived from the original multiplex network: the substrate network and the catalyst network. We contribute two novel techniques that allow the user to analyze the complex structure of the multiplex network without the extreme visual clutter that would result from simply showing it directly. The harmonized layout visual encoding technique provides spatial stability between the substrate and catalyst views. The pivot brushing interaction technique supports linked highlighting between the views based on computations in the underlying multiplex network to leapfrog between subsets of catalysts and substrates. We present results from the motivating application domain of annotated news documents with a usage scenario and preliminary expert feedback. A second usage scenario presents group cohesion analysis of the social network of the early American independence movement.

Visualizing Dimensionally-Reduced Data: Interviews with Analysts and a Characterization of Task Sequences.

Matthew Brehmer, Michael Sedlmair, Stephen Ingram, and Tamara Munzner.
In Proceedings of the ACM Workshop on BEyond time and errors: novel evaLuation methods for Information Visualization (BELIV), 2014, p. 1-8.

We characterize five task sequences related to visualizing dimensionally-reduced data, drawing from data collected from interviews with ten data analysts spanning six application domains, and from our understanding of the technique literature.

A search-set model of path tracing in graphs.

Jessica Q. Dawson, Tamara Munzner, and Joanna McGrenere.
Information Visualization, 14(4):308–338, 2015.

We present a predictive model of human behaviour when tracing paths through a node-link graph, a low-level abstract task that feeds into many other visual data analysis tasks that require understanding topological structure. Results of a user study show that our approach provides modest improvements for predictions of response time and error using search-set factors.

Visualization Analysis and Design

Tamara Munzner.
AK Peters Visualization Series (CRC Press), 2014.

Visualization Analysis and Design provides a systematic, comprehensive framework for thinking about visualization in terms of principles and design choices. The book features a unified approach encompassing information visualization techniques for abstract data, scientific visualization techniques for spatial data, and visual analytics techniques for interweaving data transformation and analysis with interactive visual exploration. It emphasizes the careful validation of effectiveness and the consideration of function before form. The book is suitable for a broad set of readers, from beginners to more experienced visualization designers. It does not assume any previous experience in programming, mathematics, human–computer interaction, or graphic design and can be used in an introductory visualization course at the graduate or undergraduate level.

Overview: The Design, Adoption, and Analysis of a Visual Document Mining Tool For Investigative Journalists.

Matthew Brehmer, Stephen Ingram, Jonathan Stray, and Tamara Munzner.
In IEEE Trans. Visualization and Computer Graphics (Proc. InfoVis), 20(12), p. 2271-2280, 2014.

A design study about Overview, an application for the systematic analysis of large document collections based on document clustering, visualization, and tagging.

Dimensionality Reduction for Documents with Nearest Neighbor Queries.

Stephen Ingram and Tamara Munzner.
Neurocomputing (Special Issue for Workshop on Visual Analytics using Multidimensional Projections (VAMP) held at EuroVis 2013), Volume 150 Part B, p 557-569. 2015.

The QSNE document-focused dimensionality reduction algorithm combines stochastic neighborhood embedding with query techniques from information retrieval.

The Nested Blocks and Guidelines Model

Miriah Meyer, Michael Sedlmair, P. Samuel Quinan, and Tamara Munzner.
Information Visualization 14(3), Special Issue on Visualization Evaluation (BELIV), 2015.

An extension to the four-level Nested Model for design and validation of visualization systems that defines the term guidelines in terms of blocks at each level.

Empirical Guidance on Scatterplot and Dimension Reduction Technique Choices.

Michael Sedlmair, Tamara Munzner, and Melanie Tory.
IEEE Trans. Visualization and Computer Graphics (Proc. InfoVis), 19(12):2634-2643 , 2013.

Empirical evaluation of 2D Scatterplots, 3D Scatterplots, and Scatterplot Matrices for dimensionality reduced data and class separation tasks. The results indicate that 2D Scatterplots are often sufficient for perceptually revealing class structure. If 2D is not good enough, the most promising approach is to use an alternative dimension reduction techniques in 2D.

A Multi-Level Typology of Abstract Visualization Tasks.

Matthew Brehmer and Tamara Munzner.
IEEE Trans. Visualization and Computer Graphics (Proc. InfoVis), 19(12):2376-2385 , 2013.

Our typology of visualization tasks distinguishes why and how a visualization task is performed, as well as what the task inputs and outputs are.

Variant View: Visualizing Sequence Variants in their Gene Context.

Joel A. Ferstay, Cydney B Nielsen and Tamara Munzner.
IEEE Trans. Visualization and Computer Graphics (Proc. InfoVis), 19(12):2546-2555 , 2013.

Design study for genomic data proposing alternative to standard genome browser approach.

The Four-Level Nested Model Revisited: Blocks and Guidelines.

Miriah Meyer, Michael Sedlmair, and Tamara Munzner.
Proc. Workshop on BEyond time and errors: novel evaLuation methods for Information Visualization (BELIV) , 2012.

An extension to the four-level Nested Model for design and validation of visualization systems that defines the term guidelines in terms of blocks at each level.

Glint: An MDS Framework for Costly Distance Functions

Stephen Ingram and Tamara Munzner.
Proc. SIGRAD 2012 , p 29-38.

Glint is designed to automatically minimize the total number of distances computed by progressively computing a more and more densely sampled approximation of the distance matrix.

Design Study Methodology: Reflections from the Trenches and the Stacks.

Michael Sedlmair, Miriah Meyer, and Tamara Munzner.
IEEE Trans. Visualization and Computer Graphics (Proc. InfoVis) , 2012, in press.

We provide definitions, propose a methodological framework, and provide practical guidance for conducting design studies.

RelEx: Visualization for Actively Changing Overlay Network Specifications.

Michael Sedlmair, Annika Frank, Tamara Munzner, and Andreas Butz
IEEE Trans. Visualization and Computer Graphics (Proc. InfoVis) , 2012, in press.

Design study focused on supporting automotive engineers who need to specify and optimize traffic patterns for in-car communication networks. The task and data abstractions for actively making changes to an overlay network, where logical communication specifications must be mapped to an underlying physical network network, are very different than the dominant use cases from the domain of social network analysis.

A Taxonomy of Visual Cluster Separation Factors.

Michael Sedlmair, Andrada Tatu, Tamara Munzner, and Melanie Tory
Computer Graphics Forum (Proc. EuroVis 2012) , 31(3):1335-1344, 2012.

Qualitative evaluation of 800+ plots, including analysis of the reasons for failure of previous cluster separation metrics and a taxonomy of factors that affect separation.

Vismon: Facilitating Analysis of Trade-Offs, Uncertainty, and Sensitivity In Fisheries Management Decision Making.

Maryam Booshehrian, Torsten Möller, Randall Peterman, and Tamara Munzner.
Computer Graphics Forum (Proc. EuroVis 2012) , 31(3):1235-1244, 2012.

Design study supporting the analysis of fisheries simulation data, including sensitivity analysis, global trade-offs analysis, and staged uncertainty.

The Design Space of Opinion Measurement Interfaces: Exploring Recall Support for Rating and Ranking

Syavash Nobarany, Louise Oram, Vasanth Kumar Rajendran, Chi-Hsiang Chen, Joanna McGrenere, and Tamara Munzner
Proc. Conf. on Human Factors in Computing Systems (CHI) 2012, pp 2035-2044.

The proposed design space is spanned by two axes: recall support, and absolute rating vs. relative ranking.

Applying Information Visualization Principles to Biological Network Displays

Tamara Munzner
Proc. SPIE-IS&T Human Vision and Electronic Imaging 2011, SPIE Vol 7865, 78650D1-13.

Reflections on QuestVis: A Visualization System for an Environmental Sustainability Model

Tamara Munzner, Aaron Barsky, and Matt Williams.
Scientific Visualization: Interactions, Features, Metaphors. Dagstuhl Follow-Ups 2, 2011, Chapter 17, p 240--259.

Reflections on the design of a system for visualizing a high-dimensional environmental sustainability dataset. Despite some successes on designing visual encoding and interaction techniques, QuestVis was ultimately not deployed because of a mismatch between the design goals of the project and the true needs of the target user community. We analyze this breakdown in the context of the Nested Model framework, which was motivated in part by this experience.

A Guide to Visual Multi-Level Interface Design From Synthesis of Empirical Study Evidence

Heidi Lam and Tamara Munzner.
Synthesis Lectures on Visualization Series, Lecture 1, Morgan Claypool, November 2010. ISBN: 9781608455928 paperback, ISBN: 9781608455935 ebook. (117 page monograph)

This monograph provides design guidelines for designing multi-level interfaces based on a fine-grained analysis of of 22 empirical studies. We considered three multi-level interface types in this synthesis review: temporal, or temporal switching of the different levels as in zooming interfaces; separate, or displaying the different levels simultaneously but in separate windows as in overview + detail interfaces; and embedded, or showing the different levels in a unified view as in focus + context interfaces.

MulteeSum: A Tool for Comparative Temporal Gene Expression and Spatial Data

Miriah Meyer, Tamara Munzner, Angela DePace, and Hanspeter Pfister.
IEEE Trans. Visualization and Computer Graphics 16(6):908-917 (Proc. InfoVis), 2010.

Design study about a visualization tool that supports exploration of multiple possible computational summaries that mix spatial information about each cell in a developing fruit fly embryo, gene expression measurements over time, and data from multiple related species or organisms.

DimStiller: Workflows for Dimensional Analysis and Reduction

Stephen Ingram, Tamara Munzner, Veronika Irvine, Melanie Tory, Steven Bergner, and Torsten Möller.
IEEE Conference on Visual Analytics Software and Technologies (VAST) 2010, p 3-10

Dimensionality reduction for the rest of us: system paper about toolkit for dimensionality reduction providing local and global guidance to users who may not be experts in the mathematics of high-dimensional data analysis.

Pathline: A Tool for Comparative Functional Genomics

Miriah Meyer, Bang Wong, Tamara Munzner, Mark Styczynski and Hanspeter Pfister.
Computer Graphics Forum (Proc. EuroVis 2010), 29(3):1043-1052.

Design study of a visualization tool for comparative functional genomics supporting simultaneous analysis of functional, pathway, and phylogenetic data. We present two new visual encoding techniques: linearized metabolic pathways, and curvemaps.

A Nested Model for Visualization Design and Validation

Tamara Munzner.
IEEE Trans. Visualization and Computer Graphics (Proc. InfoVis 09), 15(6):921-928, 2009.

This model provides a unified framework for considering both the design and the validation of visualization systems at four cascading levels, withprescriptive advice on determining appropriate evaluation approaches by identifying threats to validity unique to each level.

MizBee: A Multiscale Synteny Browser

Miriah Meyer, Tamara Munzner, and Hanspeter Pfister.
IEEE Trans. Visualization and Computer Graphics (Proc. InfoVis 09), 15(6):897-904, 2009.

Design study on the creation of a multiscale synteny browser for exploring conservation relationship in comparative genomics data.

TugGraph: Path-Preserving Hierarchies for Browsing Proximity and Paths in Graphs

Daniel Archambault, Tamara Munzner, and David Auber.
IEEE Pacific Visualization Symposium 2009, pp 113-121.

TugGraph is a system for exploring paths and proximity around nodes and subgraphs in a multilevel graph.

Visualization

Tamara Munzner.
Chapter 27, p 675-707, of Fundamentals of Graphics, Third Edition. by Peter Shirley and Steve Marschner, with additional contributions by Michael Ashikhmin, Michael Gleicher, Naty Hoffman, Garrett Johnson, Tamara Munzner, Erik Reinhard, Kelvin Sung, William B. Thompson, Peter Willemsen, Brian Wyvill. AK Peters, 2009. ISBN: 978-1-56881-469-8.

A book chapter for an undergraduate computer graphics textbook summarizing process, principles, and techniques for visualization with an emphasis on abstract data.

Glimmer: Multilevel MDS on the GPU

Stephen Ingram, Tamara Munzner and Marc Olano.
IEEE Trans. Visualization and Computer Graphics (TVCG) 15(2):249-261, Mar/Apr 2009.

Glimmer is a new multilevel multidimensional scaling algorithm that exploits the GPU. We demonstrate its benefits in a detailed comparison against several previous algorithms.

InnateDB: facilitating systems-level analyses of the mammalian innate immune response

David J. Lynn, Geoffrey L. Winsor, Calvin Chan, Nicolas Richard, Matthew R. Laird, Aaron Barsky, Jennifer L. Gardy, Fiona M Roche, Timothy H. W. Chan, Naisha Shah, Raymond Lo, Misbah Naseer, Jaimmie Que, Melissa Yau, Michael Acab, Dan Tulpan, Matthew D. Whiteside, Avinash Chikatamarla, Bernadette Mah, Tamara Munzner, Karsten Hokamp, Robert E. W. Hancock, and Fiona S. L. Brinkman.
Molecular Systems Biology 4:218, 2008.

Paper for the biological community describing InnateDB,including the Cerebral visualization component.

Cerebral: Visualizing Multiple Experimental Conditions on a Graph with Biological Context

Aaron Barsky, Tamara Munzner, Jennifer L. Gardy, and Robert Kincaid.
IEEE Transactions on Visualization and Computer Graphics (Proc. InfoVis 2008) 14(6) (Nov-Dec) 2008, p 1253-1260.

We describe the data information display needs of immunologists and describe the design decisions used to create Cerebral, a system that incorporates experimental data directly into the graph display, using the biologically guided graph layout announced in the previous appnote.

GrouseFlocks: Steerable Exploration of Graph Hierarchy Space

Daniel Archambault, Tamara Munzner, and David Auber.
IEEE Transactions on Visualization and Computer Graphics 14(4):900-913 (July/August) 2008.

GrouseFlocks supports interactive exploration of the space of possible hierarchies for an input graph with domain-specific attributes at the nodes. The system generates hierarchies that reflect the underlying graph topology by requiring that subgraphs respect edge and connectivity conservation.

Increasing the Utility of Quantitative Empirical Studies for Meta-analysis

Heidi Lam and Tamara Munzner.
Proc. CHI Workshop on BEyond time and errors: novel evaLuation methods for Information Visualization (BELIV), 2008, pp. 21-27.

Based on our experience in extracting design guidelines from existing quantitative studies, we recommend improvements to both study design and reporting to promote meta-analysis.

LiveRAC - Interactive Visual Exploration of System Management Time-Series Data

Peter McLachlan, Tamara Munzner, Eleftherios Koutsofios, Stephen North.
Proc. Conf. on Human Factors in Computing Systems (CHI) 2008, pp 1483-1492

The LiveRAC visualization system supports the analysis of large collections of time-series data with hundreds of parameters across thousands of network devices. It provides high information density using a reorderable matrix of charts, with semantic zooming adapting each chart's visual representation to the available space.

Process and Pitfalls in Writing Information Visualization Research Papers

Tamara Munzner.
Information Visualization: Human-Centered Issues and Perspectives. Andreas Kerren, John T. Stasko, Jean-Daniel Fekete, Chris North, eds. Springer LNCS Volume 4950, p 134-153, 2008.

A book chapter exhorting infovis authors to avoid pitfalls at several stages of research process, including visual encoding during design, a checkpoint before starting to write, and after a full paper draft exists. The paper page includes my current list of favorite design study examples.

Spatialization Design: Comparing Points and Landscapes

Melanie Tory, David W. Sprague, Fuqu Wu, Wing Yan So, and Tamara Munzner.
IEEE Trans. Visualization and Computer Graphics (Proc. InfoVis 07), 13(6):1262--1269, 2007.

For the task we studied, point-based spatializations were far superior to landscapes, and 2D landscapes were superior to 3D landscapes.

Overview Use in Multiple Visual Information Resolution Interfaces

Heidi Lam, Robert Kincaid, and Tamara Munzner.
IEEE Trans. Visualization and Computer Graphics (Proc. InfoVis 07) 13(6):1278--1285, 2007.

We compared four interfaces: overview-only, detail-only,separate overview and detail windows, and detail embedded within overview as in Focus+Context interfaces.

Session Viewer: Visual Exploratory Analysis of Web Session Logs

Heidi Lam, Daniel Russell, Diane Tang, and Tamara Munzner.
Proc. IEEE Symposium on Visual Analytics Science and Technology (VAST), p 147-154, 2007.

Taking a multiple-coordinated view approach, Session Viewer shows multiple session populations at the Aggregate, Multiple, and Detail data levels to support different analysis styles.

Grouse: Feature-Based, Steerable Graph Hierarchy Exploration

Daniel Archambault, Tamara Munzner, and David Auber.
Proc. Eurographics / IEEE VGTC Symposium on Visualization (EuroVis 07), p 67-74

Interactive and steerable exploration of multilevel graph hierarchies, as created by TopoLayout

Cerebral: a Cytoscape plugin for layout of and interaction with biological networks using subcellular localization annotation

Aaron Barsky, Jennifer L. Gardy, Robert E. W. Hancock, and Tamara Munzner.
Bioinformatics 23(8):1040-1042, 2007 Bioinformatics Advance Access published online on February 19, 2007

Short note aimed at the bioinformatics community announcing a graph layout approach for protein-protein interaction networks that exploits annotations about where genes/proteins are expressed within a cell and their function.

TopoLayout: Multi-Level Graph Layout by Topological Features

Daniel Archambault, Tamara Munzner, and David Auber.
Transactions on Visualization and Computer Graphics, 13(2):305--317, Mar/Apr 2007.

Multilevel graph drawing algorithm where the original graph is decomposed into features based on topological structures such as trees and clusters, each feature is drawn with an appropriately tuned algorithm, and passes for crossing reduction and overlap elimination reduce visual clutter.

Smashing Peacocks Further: Drawing Quasi-Trees From Biconnected Components

Daniel Archambault, Tamara Munzner, and David Auber.
IEEE Trans. Visualization and Computer Graphics (Proc. InfoVis 06) 12(5), September 2006, p 813-820.

Two-level approach to drawing complex graphs where an area-aware version of the RINGS tree drawing algorithm is used to show the high-level structure, and the force-directed LGL approach is used to show the low-level structure.

Composite Rectilinear Deformation for Stretch and Squish Navigation

James Slack and Tamara Munzner.
IEEE Trans. Visualization and Computer Graphics (Proc. Visualization 2006) 12(5), September 2006, p 901-908.

Navigation for accordion drawing, whereas previous papers focused on rendering.

Effects of 2D Geometric Transformations on Visual Memory

Heidi Lam, Ronald A. Rensink, and Tamara Munzner.
Proc. Applied Perception in Graphics and Visualization (APGV 2006), 119-126, 2006.

Evaluation of how both linear and nonlinear geometric transformations affect visual memory, as opposed to previous paper on visual search.

An Evaluation of Pan&Zoom and Rubber Sheet Navigation with and without an Overview

Dmitry Nekrasovski, Adam Bodnar, François Guimbretière, Joanna McGrenere, and Tamara Munzner.
Proc. ACM Conf. on Human Factors in Computing Systems (CHI) 2006, p 11-20.

Evaluation comparing navigation techniques and availability of contextual information.

Visualization Research Challenges: A Report Summary

Robert Moorhead, Chris Johnson, Tamara Munzner, Hanspeter Pfister, Penny Rheingans, and Terry S. Yoo.
IEEE Computing in Science & Engineering, Vol 8, No 4 (July/Aug) 2006, p 66-73.

Five-page summary of VRC report

NIH/NSF Visualization Research Challenges Report Summary

Tamara Munzner, Chris Johnson, Robert Moorhead, Hanspeter Pfister, Penny Rheingans, and Terry S. Yoo.
IEEE Computer Graphics and Applications, Vol 26, No 2 (March/April) 2006, p 20-24.

Five-page summary of VRC report

NIH/NSF Visualization Research Challenges Report

Chris Johnson, Robert Moorhead, Tamara Munzner, Hanspeter Pfister, Penny Rheingans, and Terry S. Yoo.
IEEE Computer Society Press, 2006, ISBN 0-7695-2733-7 (36 page book).

This report, sponsored by the NIH and NSF, is a followup to the 1987 NSF Visualization report. Our goal is to evaluate the progress of the maturing field of visualization, to help focus and direct future research projects, and to provide guidance on how to apportion national resources. Our findings and recommendations reflect not only information gathered from visualization and applications scientists during two workshops on Visualization Research Challenges but also input from the larger visualization community.

Partitioned Rendering Infrastructure for Scalable Accordion Drawing (Extended Version)

James Slack, Kristian Hildebrand, and Tamara Munzner.
Information Visualization, 5(2), p. 137-151, 2006.

Longer journal version of PRISAD paper, recommended over the conference version. The algorithm explanation is clearer and more detailed.

Partitioned Rendering Infrastructure for Scalable Accordion Drawing

James Slack, Kristian Hildebrand, and Tamara Munzner.
Proc. IEEE Symposium on Information Visualization (InfoVis) 2005, pp 41--48.

Conference version of PRISAD paper, presenting generic and efficient infrastructure for accordion drawing with an emphasis on rendering.

Scalable, Robust Visualization of Large Trees

Dale Beermann, Tamara Munzner, and Greg Humphreys
Proc. EuroVis 2005, pp 37--44.

Highly scalable accordion drawing for huge trees of 15 million nodes with leading-edge graphics hardware and 5 million nodes on commodity platforms.

SequenceJuxtaposer: Fluid Navigation For Large-Scale Sequence Comparison In Context

James Slack, Kristian Hildebrand, Tamara Munzner, and Katherine St. John.
German Conference on Bioinformatics 2004, pp 37-42.

Accordion drawing for comparing gene sequences.

Steerable, Progressive Multidimensional Scaling

Matt Williams and Tamara Munzner.
Proc IEEE Symposium on Information Visualization (InfoVis) 2004, pp 57-64.

Steerable multidimensional scaling with progressive layout.

Perceptual Invariance of Nonlinear Focus+Context Transformations

Keith Lau, Ron Rensink, and Tamara Munzner.
Proc. First Symposium on Applied Perception in Graphics and Visualization (APGV 04) 2004, pp 65-72.

We quantify the perceptual cost of geometric transformations for visual search tasks, finding no-cost and low-cost zones for fisheye transformations.

TreeJuxtaposer: Scalable Tree Comparison using Focus+Context with Guaranteed Visibility

Tamara Munzner, François Guimbretière, Serdar Tasiran, Li Zhang, and Yunhong Zhou.
SIGGRAPH 2003, pp 453--462.

Visual diff for trees, introducing accordion drawing.

Guest Editor's Introduction to Special Issue on Information Visualization.

Tamara Munzner.
IEEE Computer Graphics and Applications Special Issue on Information Visualization, 22(1), Jan/Feb 2002, pp 20-21.

In this short introduction I briefly describe the goals of the field of information visualization to set the stage for the four accepted papers in this special issue, for which I was the guest editor.

An Initial Examination of Ease of Use for 2D and 3D Information Visualizations of Web Content

Kirsten Risden, Mary P. Czerwinski, Tamara Munzner, Daniel B. Cook.
International Journal of Human Computer Studies, Vol. 53, No. 5, November 2000, pp 695-714.

This paper discusses a user study conducted at Microsoft Research that found a statistically significant improvement in task time when a novel web browser that included the H3Viewer was compared to more traditional browsers.

Interactive Visualization of Large Graphs and Networks

Tamara Munzner.
Ph.D. Dissertation, Stanford University, June 2000.

My dissertation includes a chapter each on the H3, Planet Multicast, and Constellation projects, with much more analysis than appeared in any of the original papers.

Artistic Multiprojection Rendering

Maneesh Agrawala, Denis Zorin, Tamara Munzner.
Proceedings of the 11th Eurographics Rendering Workshop, June 26-28 2000, pp 125-136. These proceedings were also published as Rendering Techniques 2000, B. Peroche and H. Rushmeier, eds, Springer, 2000.

A paper on interactive rendering of scenes where objects can have different projections, as in the simulaneous multiple viewpoints of Cubist paintings.

Constellation: A Visualization Tool For Linguistic Queries from MindNet

Tamara Munzner and François Guimbretière and George Robertson.
Proceedings of the 1999 IEEE Symposium on Information Visualization (InfoVis 99), 1999, pp 132-135.

A paper on a 2D interactive system that uses a custom graph layout algorithm and many perceptual channels to help computational linguists debug their algorithms for generating and using large semantic networks.

Drawing Large Graphs with H3Viewer and Site Manager

Tamara Munzner.
Proceedings of Graph Drawing '98, Montreal, Canada, August 1998, Lecture Notes in Computer Science 1547, pp. 384-393, Springer-Verlag.

A paper which presents the H3Viewer guaranteed frame rate drawing algorithm, along with a brief review of the H3 layout algorithm for context. Very large graphs can be navigated at a constant frame rate, as long as the entire graph can fit into main memory. The viewer is custom OpenGL/C++ code. My implementation of the algorithm discussed here was shipped with the Site Manager 1.1 software from SGI. The source is available for free noncommercial use.

Exploring Large Graphs in 3D Hyperbolic Space

Tamara Munzner.
IEEE Computer Graphics and Applications, Vol. 18, No. 4, pp 18-23, July/August 1998.

An article which briefly reviews the H3 layout and H3Viewer drawing algorithms. The main new material here is a discussion about possible tasks for graph drawing beyond the global overview problem.

H3: Laying Out Large Directed Graphs in 3D Hyperbolic Space

Tamara Munzner.
Proceedings of the 1997 IEEE Symposium on Information Visualization (InfoVis 97), October 20-21 1997, Phoenix, AZ, pp 2-10, 1997.

A paper that presents a much improved layout algorithm that exploits some of the properties of 3D hyperbolic space to achieve reasonable information density. The viewer is a highly modified version of Geomview, which supports manual subtree collapse and expansion. My implementation of the algorithm discussed here was shipped with the Site Manager 1.0 software from SGI.

Visualizing the Global Topology of the MBone

Tamara Munzner and Eric Hoffman and K. Claffy and Bill Fenner.
Proceedings of the 1996 IEEE Symposium on Information Visualization (InfoVis 96), October 28-29 1996, San Francisco, CA, pp 85-92, 1996.

A case study describing the Planet Multicast project: an interactive 3D geographic visualization of the Internet's multicast backbone, where tunnels are shown as arcs on a globe.

Visualizing the Structure of the World Wide Web in 3D Hyperbolic Space

Tamara Munzner and Paul Burchard.
Proceedings of the Virtual Reality Modelling Language (VRML 95) (San Diego, California, December 14-15, 1995), special issue of Computer Graphics, pp 33-38, ACM SIGGRAPH, New York, 1995.

The first of my hyperbolic papers. The layout algorithm is the the most straightforward extension of cone trees to 3D hyperbolic space. The viewer is Geomview/WebOOGL. The system allows neither manual nor automatic collapsing of the graph, so scalability is extremely limited.

Interactive Methods for Visualizable Geometry

Andrew J. Hanson and Tamara Munzner and George Francis.
IEEE Computer, Vol. 27, No. 4, pp 73-83, July 1994.

A survey article about interactive mathematical visualization, includes many pictures.