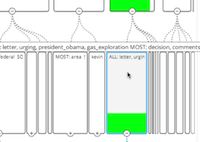
Released May 2016
A Visualization tool to support literature review.
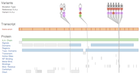
Released December 2014
A visualization system designed for sequence analysis of eye tracking data.
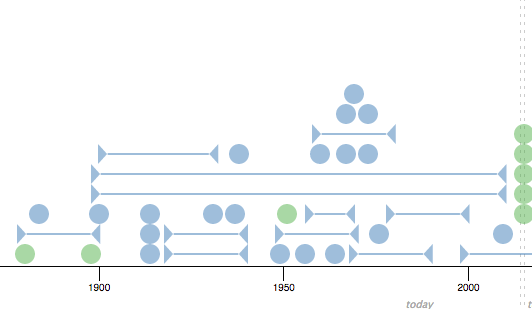
Released February 2015
Browser-based vis tool for curating timelines generated from freeform text.
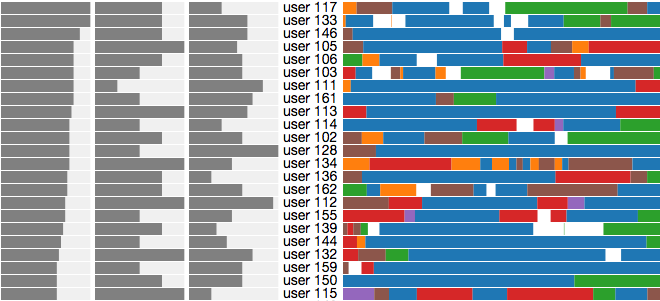
Portfolio Visualization Sandbox
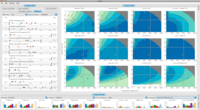
Released 2015
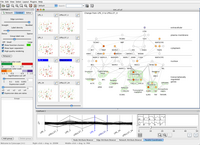
A R/Shiny sandbox environment for creating visualization sketches relating to the energy use of a portfolio of buildings.
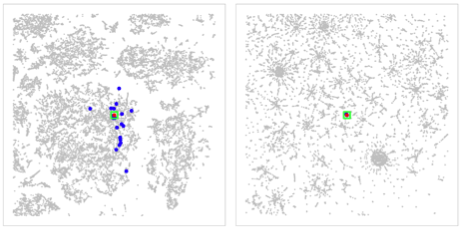
Released July 2014
All-Pairs Query, or APQ, nearest-neighbor algorithm and the Q-SNE, dimensionality reduction algorithm.
Released March 2012, current version released September 2013
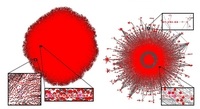
Browser-based vis tool for investigating large text document collections.
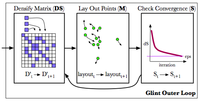
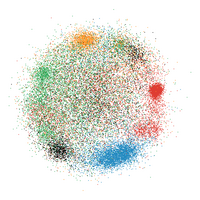
Released December 2012
Glint is designed to automatically minimize the total number of distances computed by progressively computing a more and more densely sampled approximation of the distance matrix.
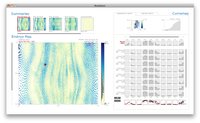
Version 1.0 released January 2010, latest version 2.5.1 released August 2012
Visual tool for fisheries management data analysis.
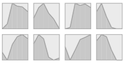
Released October 2010
Exploration tool that supports the comparison of multiple gene expression data sets defined both spatially and temporally.
Released June 2010
Tool that visualizes temporal gene expression data over multiple molecular pathways and across multiple species.

Released December 2009
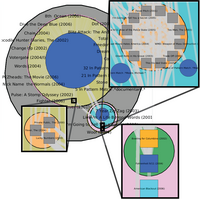
Browser that enables analysis of comparative genomics data through visualization across multiple scales.
Released July 2008
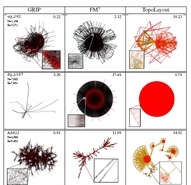
GPU and CPU versions of fast and robust multilevel multidimensional scaling algorithm.
Released July 2008
Multilevel graph hierarchy exploration tools, built on the Tulip framework.
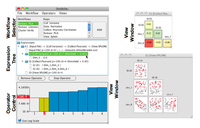
Version 2.0 (compatible with Cytoscape 2.6) released May 2008. Version 2.8.2 (compatible with Cytoscape 2.8.2) released January 2012
Cytoscape plugin for compartmentalized network layout, for instance using subcellular localization annotations, and comparing quantitative data from multiple experiments.
Version 2.1 released Oct 2007
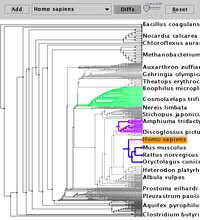
TJ is open-source software for browsing and comparing trees. It uses accordion drawing, an information visualization technique that features rubber-sheet navigation and the guaranteed visibility of marked areas. It was specifically designed for biologists who want to compare phylogenetic or taxonomic trees, but can work for any hierarchies. It can handle trees of up to several million nodes.
Version 1.2 released Feb 2005
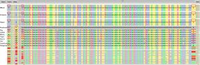
SJ is open-source software for browsing and comparing gene sequences, using accordion drawing.

Version 1.1.2 released Sep 2003
HypViewer is the 3D hyperbolic module used in Site Manager below, now available for free noncommercial use. Contact SGI for licensing for commercial use.

Version 1.1 released 1998
Site Manager was free software from Silicon Graphics for webmasters and content creators. It included a 3D hyperbolic view of the link structure of the target web site. That module was an implementation of the layout described in Tamara's InfoVis 97 paper. Version 1.1 includes the guaranteed frame rate drawing algorithm described in a Graph Drawing 98 paper.
[(No longer available; was packaged with Irix 6.) [Site Manager User's Guide Documentation still available.]

Version 1.9.5 released March 2014, developeed between 1992 and 1996
Tamara was one of the core team responsible for design, implementation, documentation, distribution, and maintenance of Geomview, a public domain 3D interactive visualization package with over one thousand registered users. They encourage people to let them know how they use their tools, and have heard back from hundreds of them in a wide variety of domains, including topology, computational geometry, computer graphics, robotics, medical imaging, nuclear physics, mechanical engineering, civil engineering, biomechanics, spacecraft design, computational electromagnetics, and seismology.
[Download] [Download previous versions from former Geometry Center home]

Released 1996
The Triangle Tiling museum exhibit allows people to explore the connections between symmetry groups, tiling, the Platonic and Archimedean solids, and non-Euclidean geometry through interactive 3D graphics. Tamara adapted research software originally written by Charlie Gunn for museum use with Stuart Levy and Olaf Holt. The program features mathematical concepts such as the relationship between Platonic and Archimedean solids, duality, and spherical geometry. The adaptation was done in collaboration with the Science Museum of Minnesota, where it is on exhibit. The software was also shown at "The Edge", the interactive installation showcase at SIGGRAPH 94. There's an article about it in the Geometry Forum archives.
[OpenGL SGI binaries] [IrisGL SGI binaries (Irix 4.x or earlier)] [Mac and Windows binaries ported by Jeff Weeks, who added additional functionality and named it KaleidoTile.] [Linux port created by Pedro Ribeiro for the Atractor exhibit in Lisbon. This version is also multilingual: you can switch the interface between English, French, German, Italian, Portuguese, and Spanish. (Note: if you have troubles running on your machine, try downloading Geomview 1.8 and substituting that bin/gvx for the one in this distribution.)]

Released October 1996
The CAIDA toolset for network drawing. Some aspects of it are described in a paper on visualizing the MBone. These tools were used to create a series of short videos, including the Planet Multicast video. The toolkit can also be used to create Web pages like the MBone or the NLANR caching hierarchy daily pages, which contain automatically generated 3D and 2D snapshots of the day's data.
[Download if you're curious, but this software is not currently supported.]

Released 1994
Tamara was involved in the VRML 1.0 standards process starting in 1994, when integrating 3D with the Web was a hot new topic. The WebOOGL software was a proof of concept to back our format proposal. After SGI Inventor-based proposal won the vote (ours came in second), we retro-fitted the WebOOGL software into a quasi-compliant VRML 1.0 viewer. Development has not continued since Tamara left the Geometry Center in 1995, and it is rather unlikely that any 2.0 support would ever be added. Tamara's mathematical zoo page has seen a lot of traffic since it was part of the original content pages highlighted during the first big VRML browser release in March 1995. It contains files in both VRML and the WebOOGL native 3D format.
[Download if you're curious, but this software is not currently supported.]