Reflections
on QuestVis: A Visualization System for an Environmental
Sustainability Model
Tamara Munzner, Aaron
Barsky, Matt Williams.
Scientific Visualization: Interactions, Features, Metaphors.
Dagstuhl Follow-Ups 2, 2011, Chapter 17, p 240--259.
DOI
PDF |
Abstract |
Talk |
Figures
Paper
Abstract
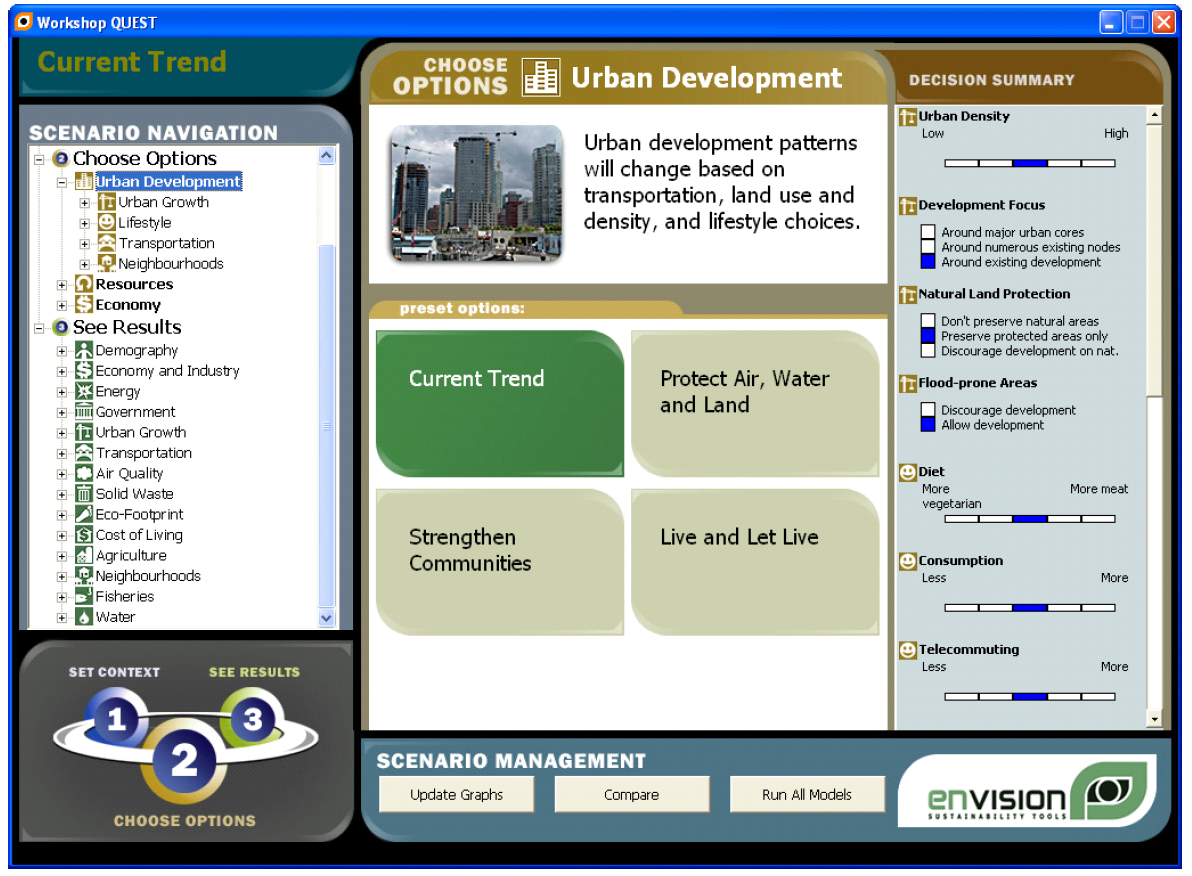
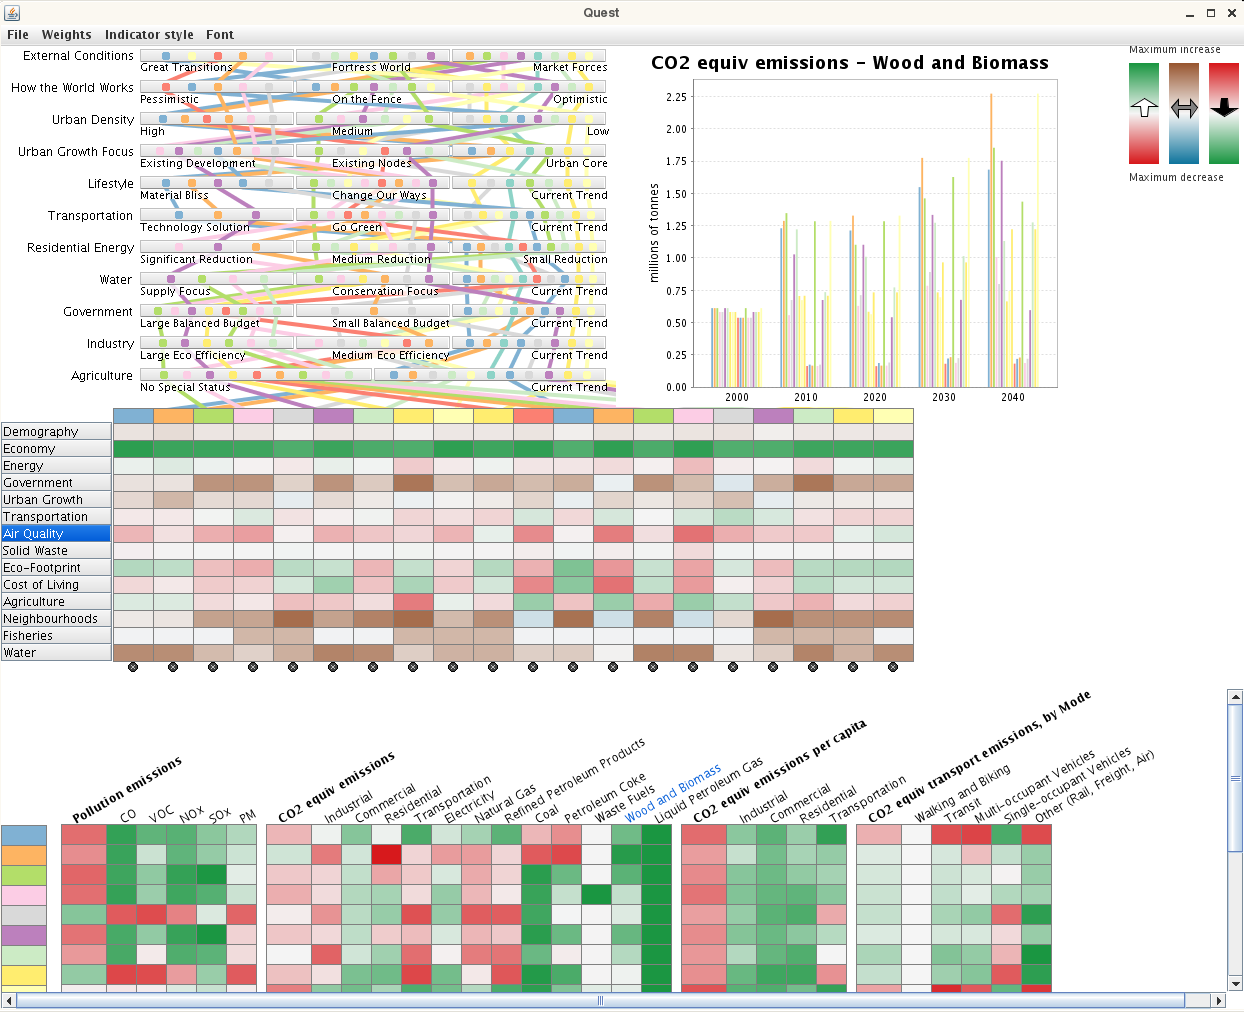
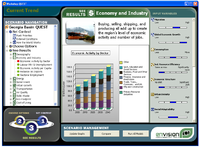
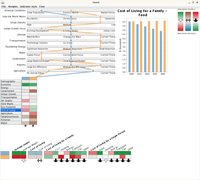
We present lessons learned from the iterative design of QuestVis, a
visualization interface for the QUEST environmental sustainability
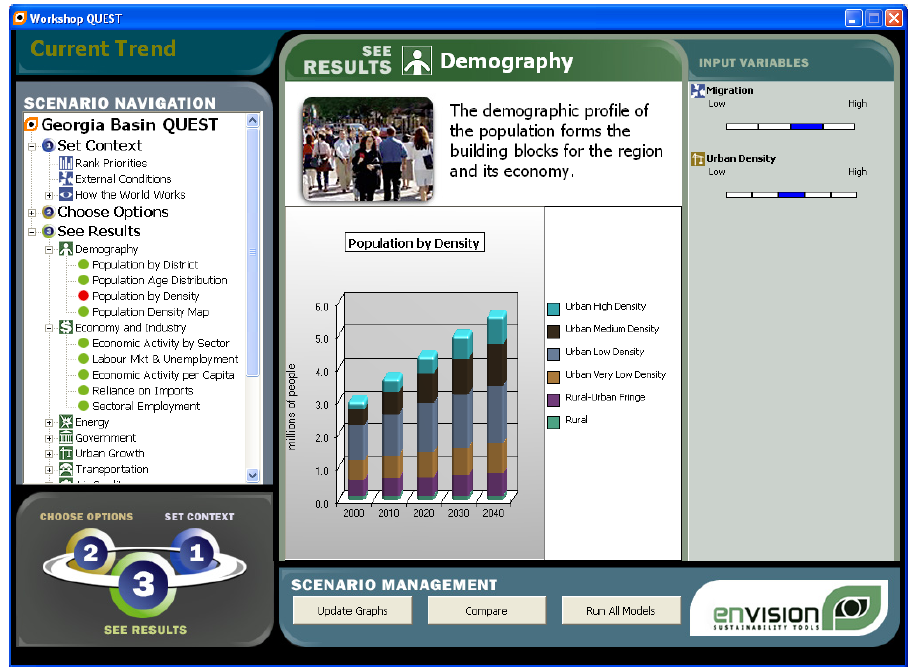
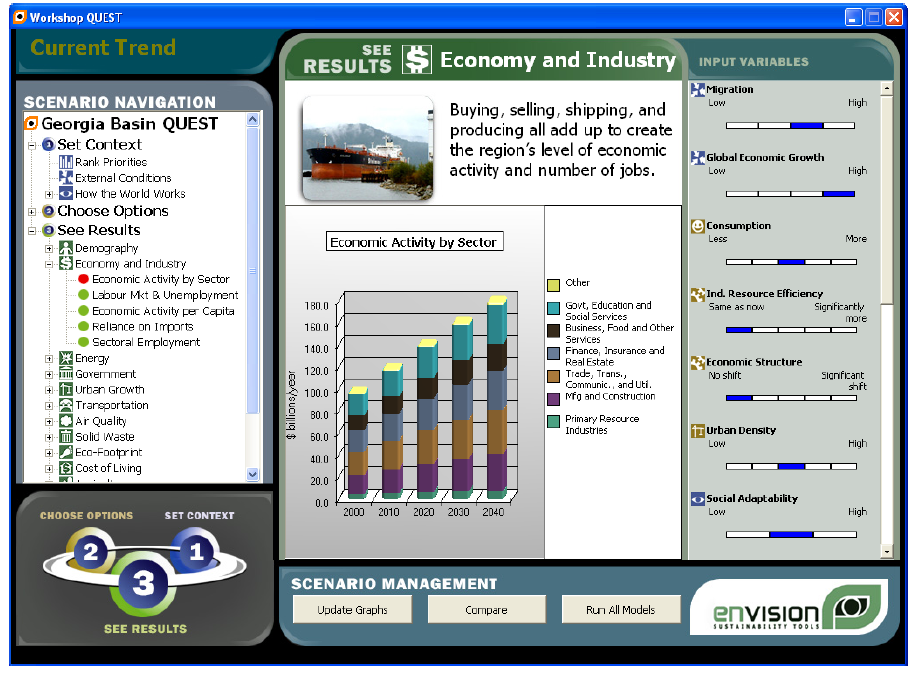
model. The QUEST model predicts the effects of policy choices in the
present using scenarios of future outcomes that consist of several
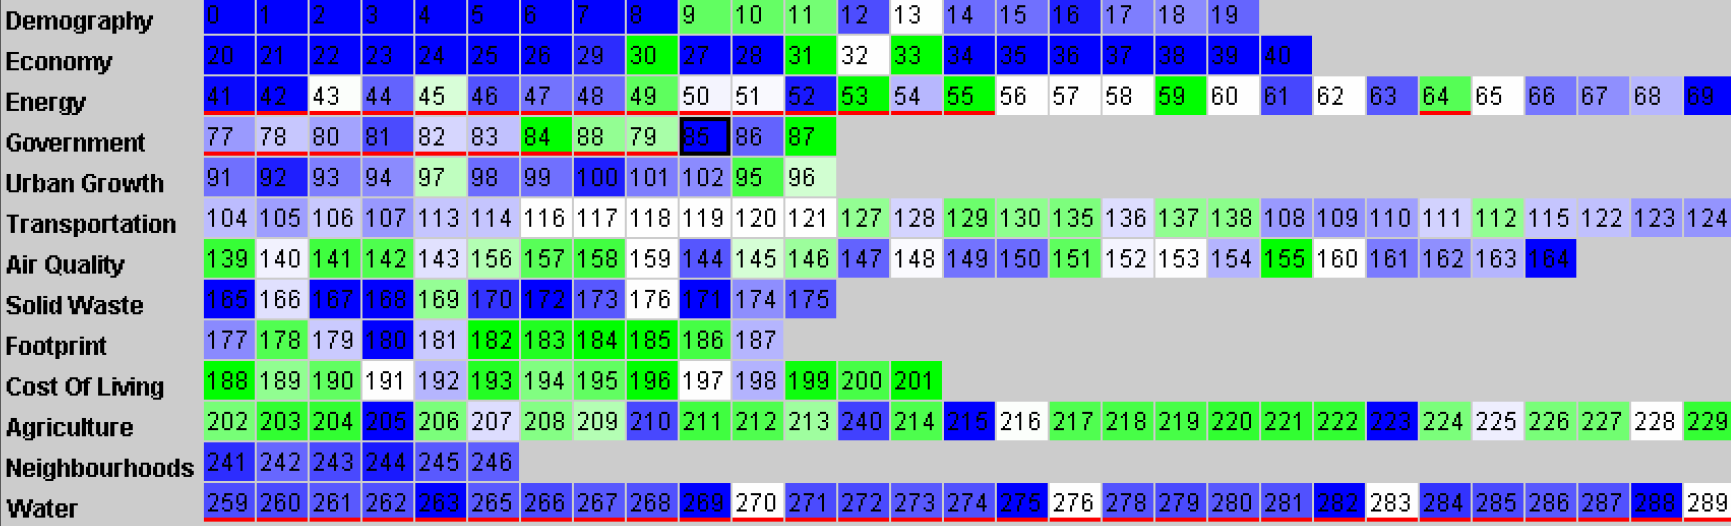
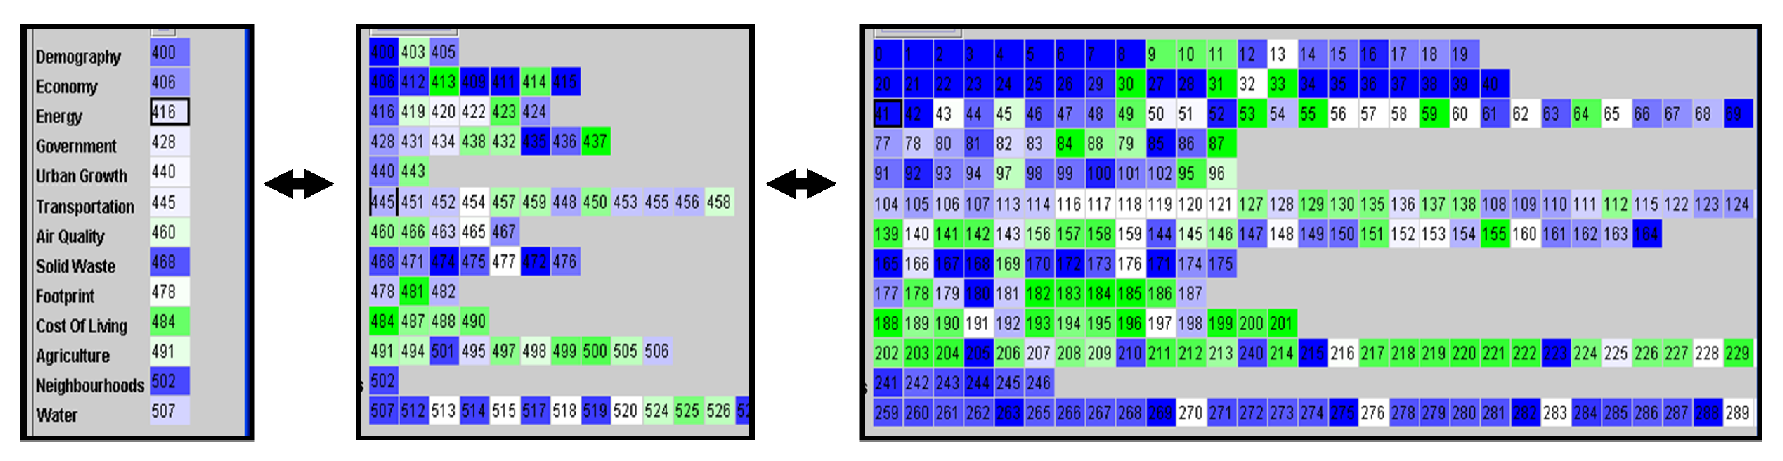
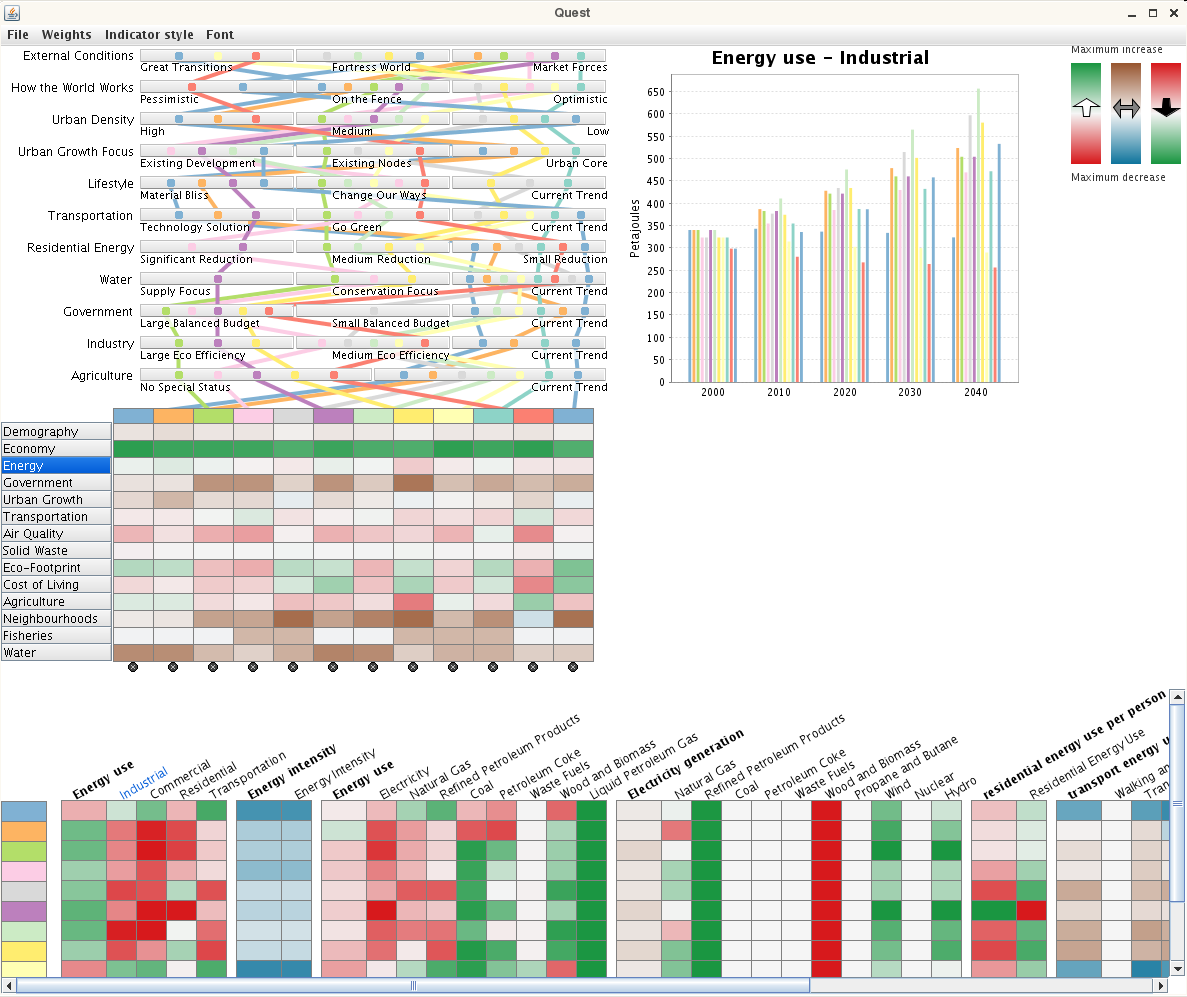
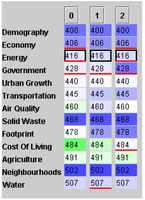
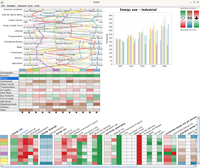
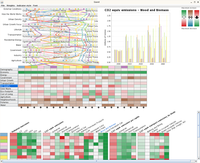
hundred indicators. QuestVis treats this information as a
high-dimensional dataset, and shows the relationship between input
choices and output indicators using linked views and a compact
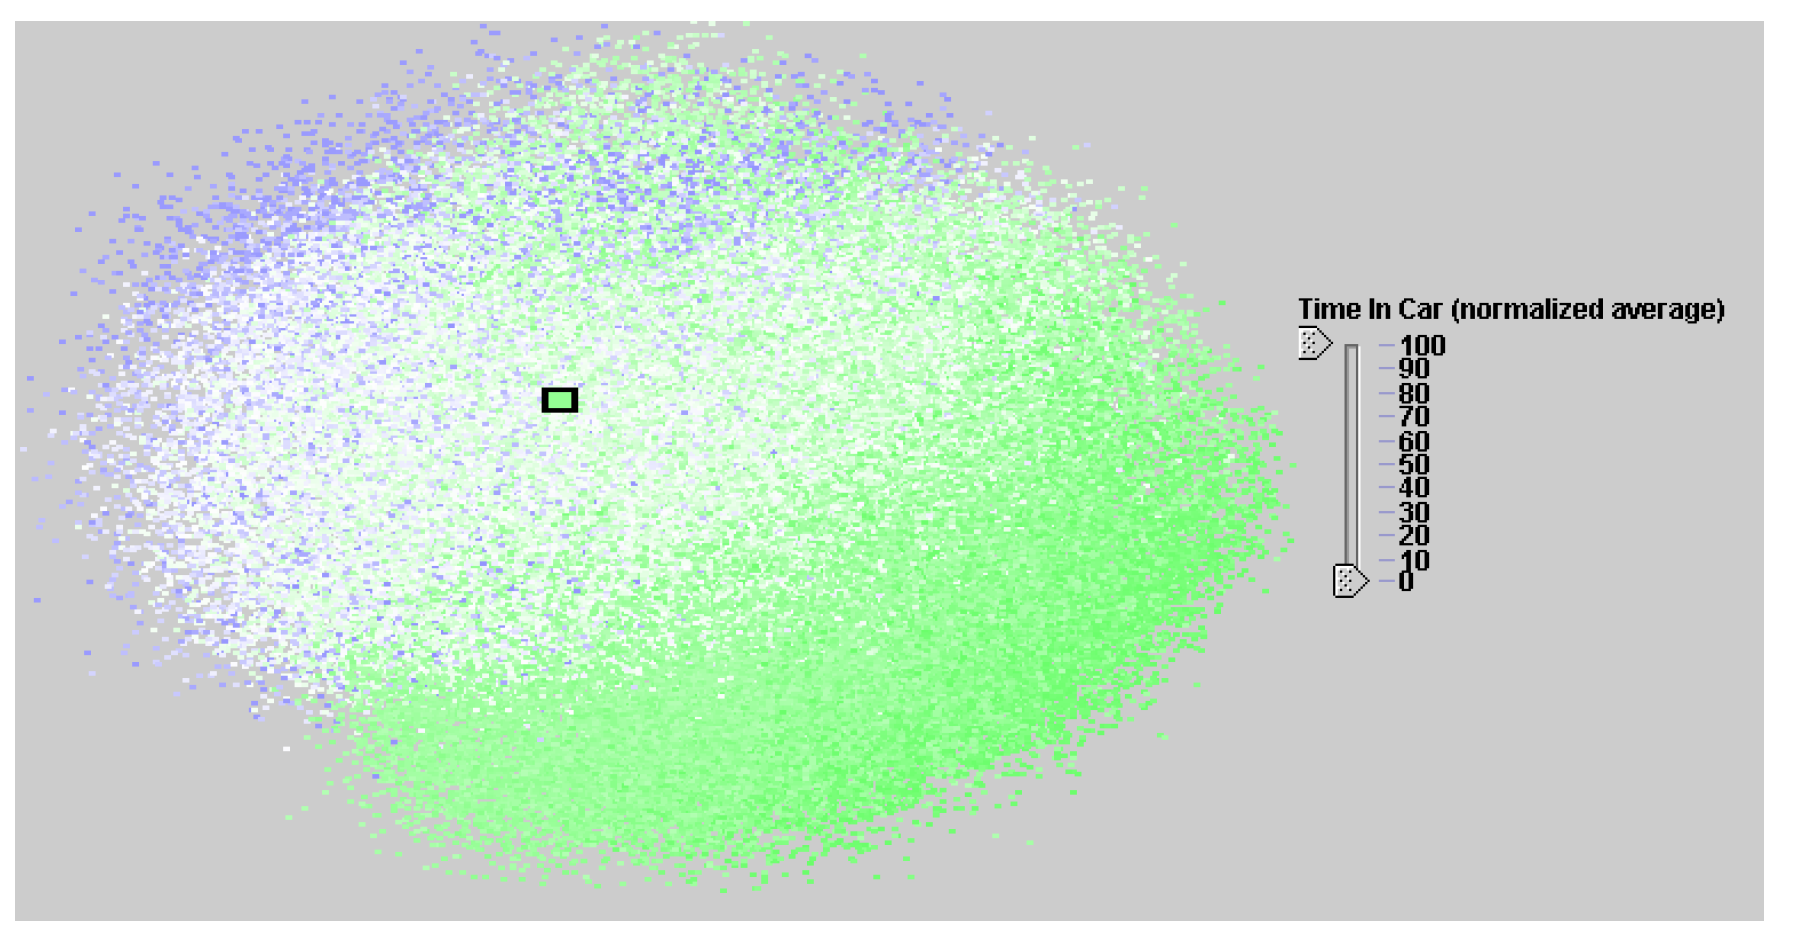
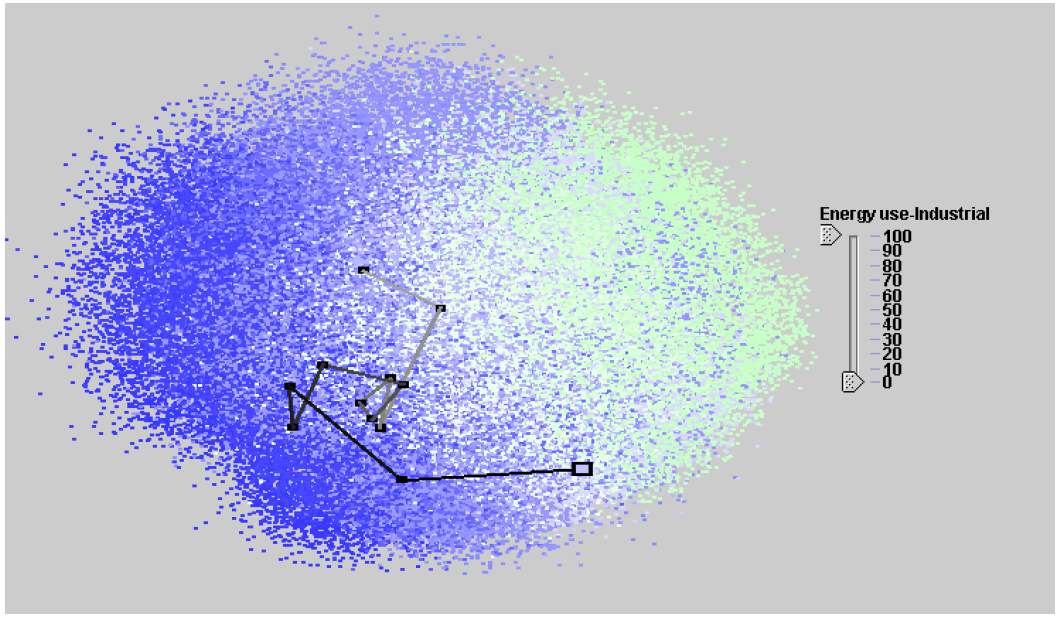
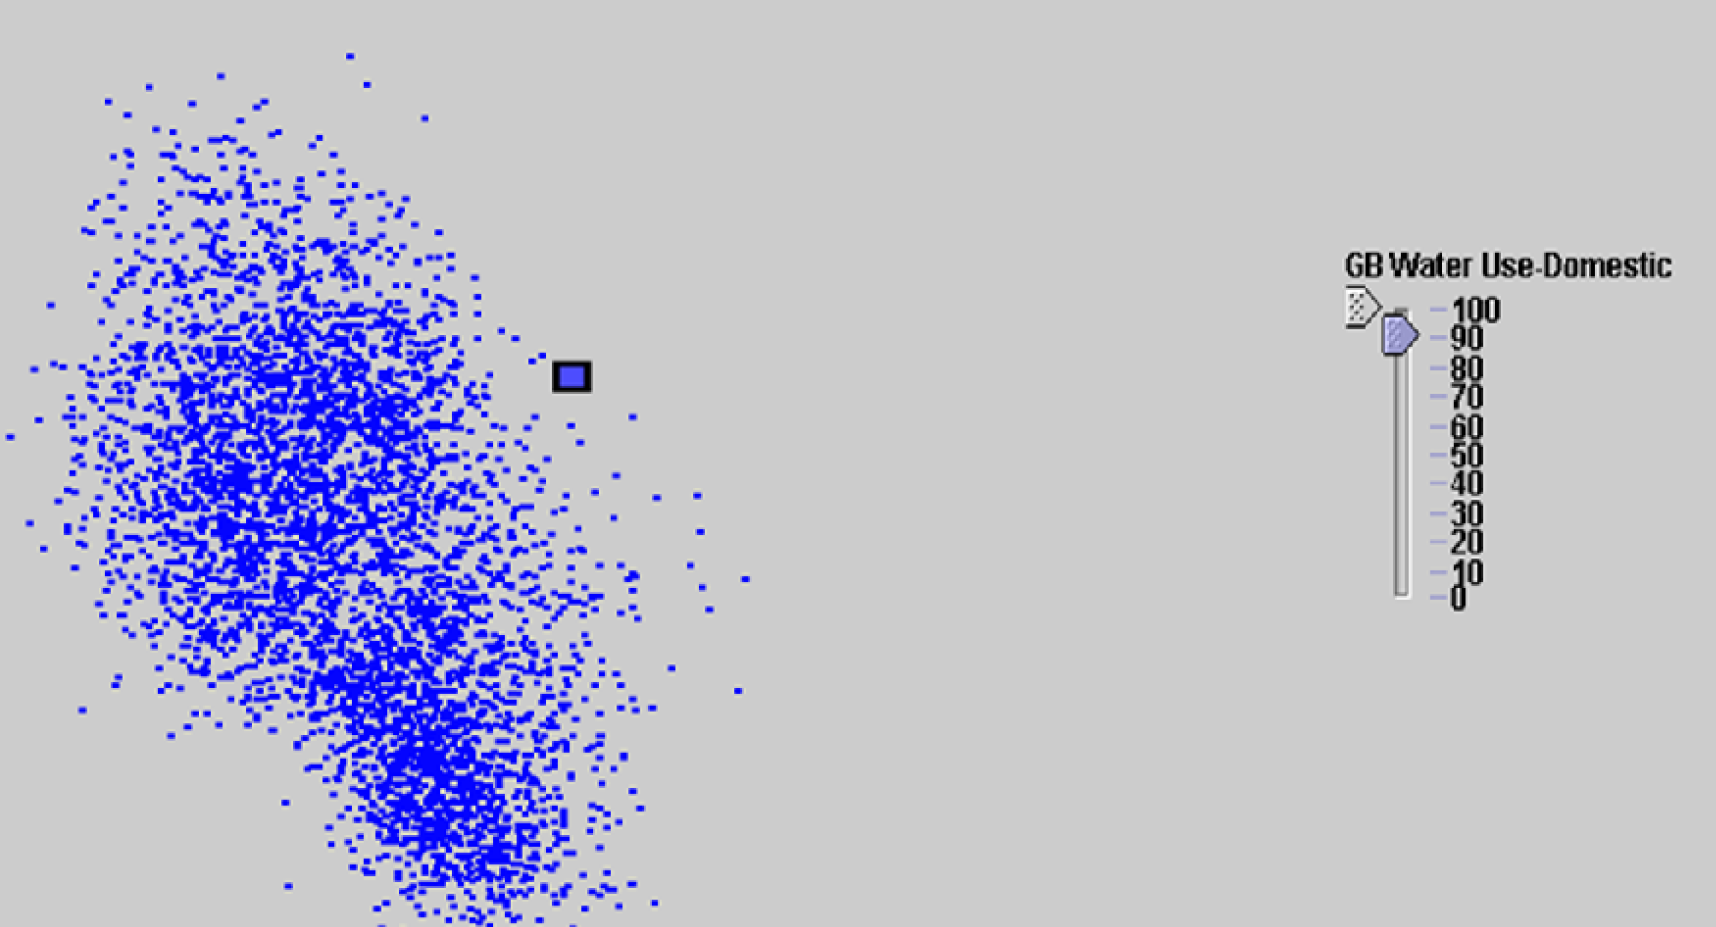
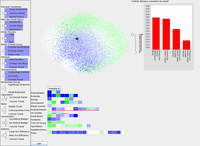
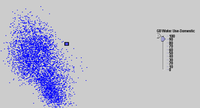
multilevel browser for indicator values. A first prototype also
featured an overview of the space of all possible scenarios based on
dimensionality reduction, but this representation was deemed to be
be inappropriate for a target audience of people unfamiliar with
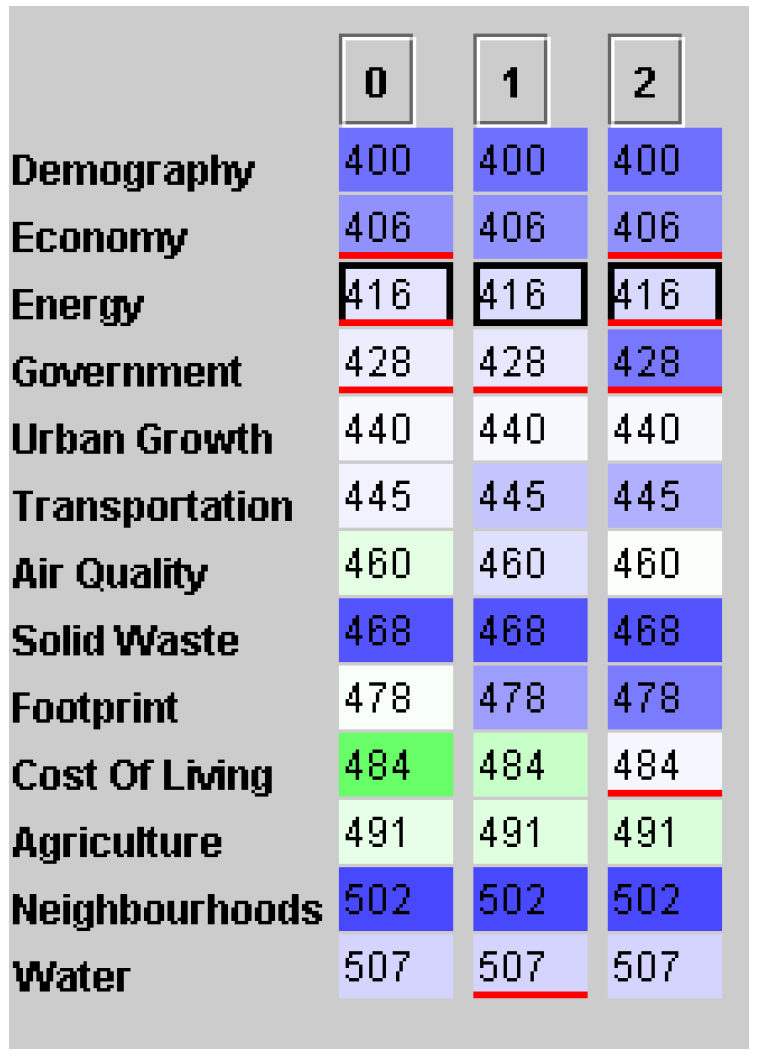
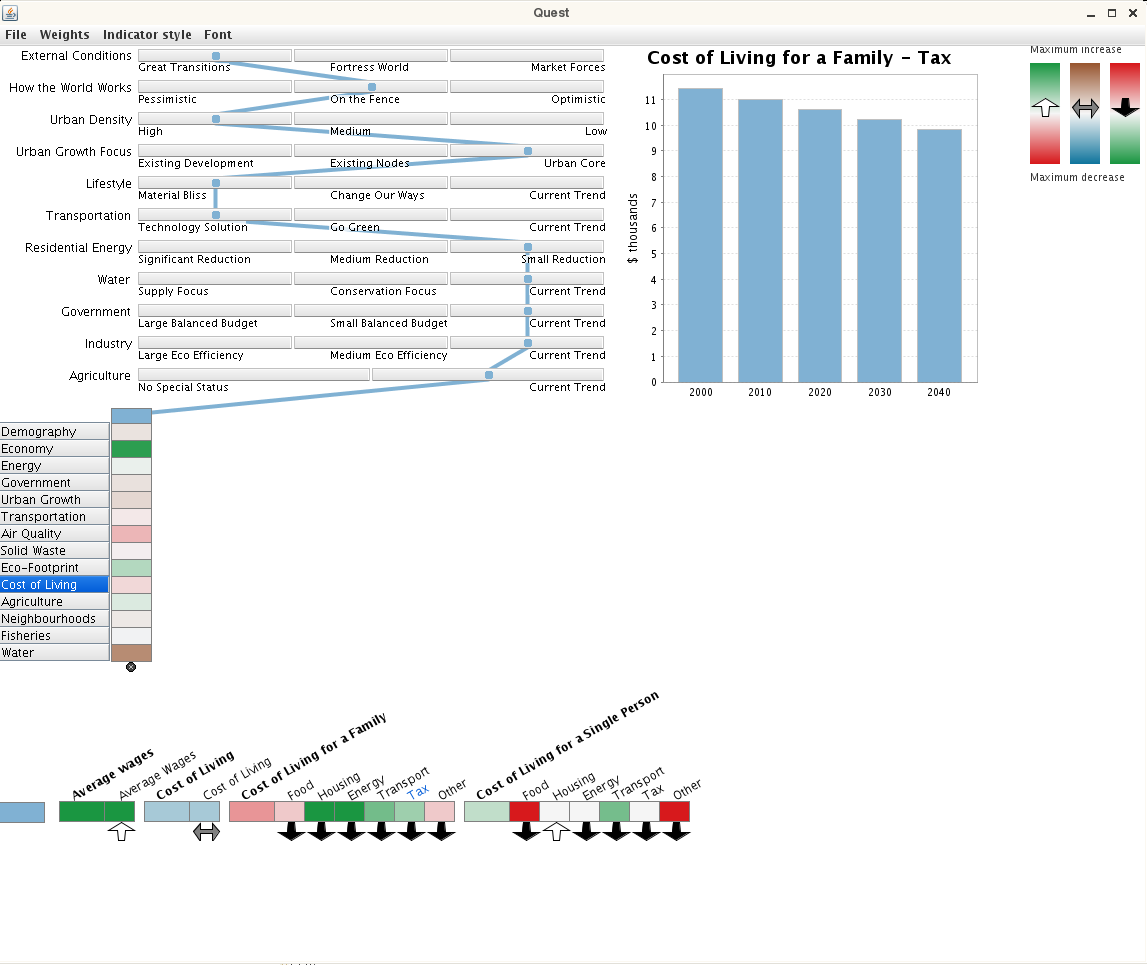
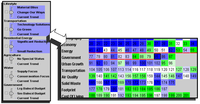
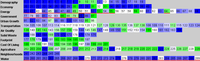
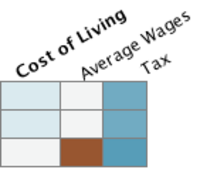
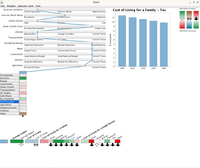
data analysis. A second prototype with a considerably simplified and
streamlined interface was created that supported comparison between
multiple scenarios using a flexible approach to aggregation.
However, QuestVis was not deployed because of a mismatch between the
design goals of the project and the true needs of the target user
community, who did not need to carry out detailed analysis of the
high-dimensional dataset. We discuss this breakdown in the context
of a nested model for visualization design and evaluation.
Figures
- Figure 1:

- Figure 2:

- Figure 3:
- Figure 4:
- Figure 5:

- Figure 6:

- Figure 7:

- Figure 8:

- Figure 9:
- Figure 10:
- Figure 11:
- Figure 12:
- Figure 13:
Back to Imager pubs
Last modified: Sun Oct 30 15:48:20 PDT 2011