Visualization collections, accessed by platforms such as Tableau Online or Power BI, are used by millions of people to share and access diverse analytical knowledge in the form of interactive visualization bundles. Result snippets, compact previews of these bundles, are presented to users to help them identify relevant content when browsing collections. Our engagement with Tableau product teams and review of existing snippet designs on five platforms showed us that current practices fail to help people judge the relevance of bundles because they include only the title and one image. Users frequently need to undertake the time-consuming endeavour of opening a bundle within its visualization system to examine its many views and dashboards. In response, we contribute the first systematic approach to visualization snippet design. We propose a framework for snippet design that addresses eight key challenges that we identify. We present a computational pipeline to compress the visual and textual content of bundles into representative previews that is adaptive to a provided pixel budget and provides high information density with multiple images and carefully chosen keywords. We also reflect on the method of visual inspection through random sampling to gain confidence in model and parameter choices.
Paper
VizSnippets: Compressing Visualization Bundles Into Representative Previews for Browsing Visualization Collections
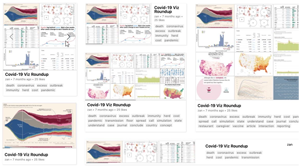
Fig. 1. Automatically generated snippets of the same Observable notebook. (1) Vertical snippet layout with image collage of six images, and image carousel to scroll through additional content; (2) Existing visualization snippets in commercial products are limited to a single thumbnail; (3) Horizontal snippet layout; (4) Small minimum image size allows more images to fit in a collage; (5) Table layout; (6) Large preview snippet minimizes information loss.
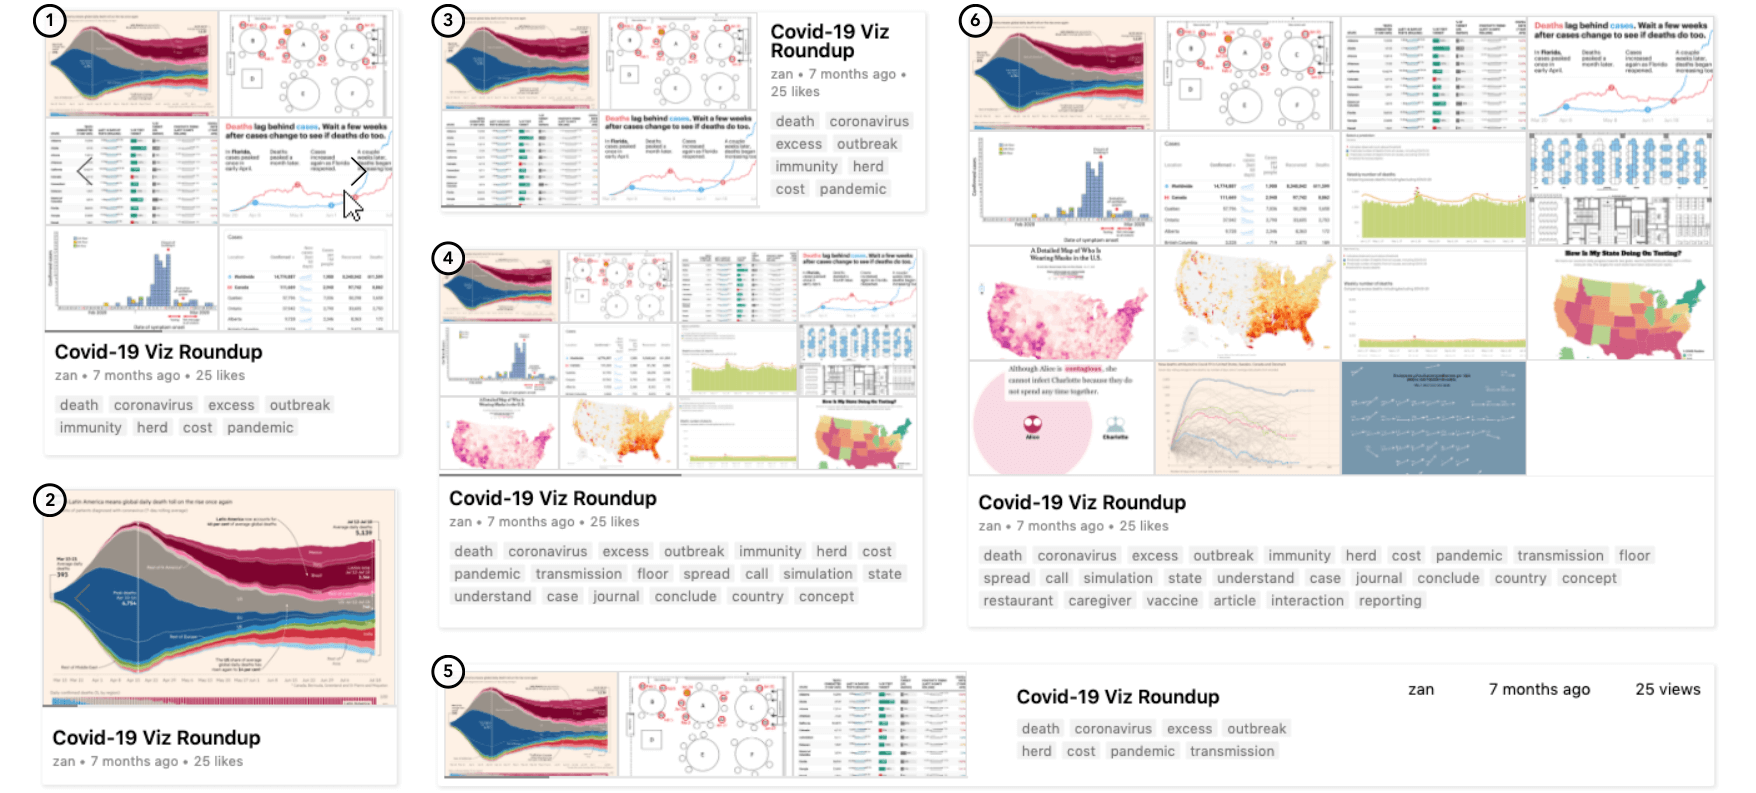
Fig. 2. Design framework for displaying visualization snippets, with three levels and two categories of choices.
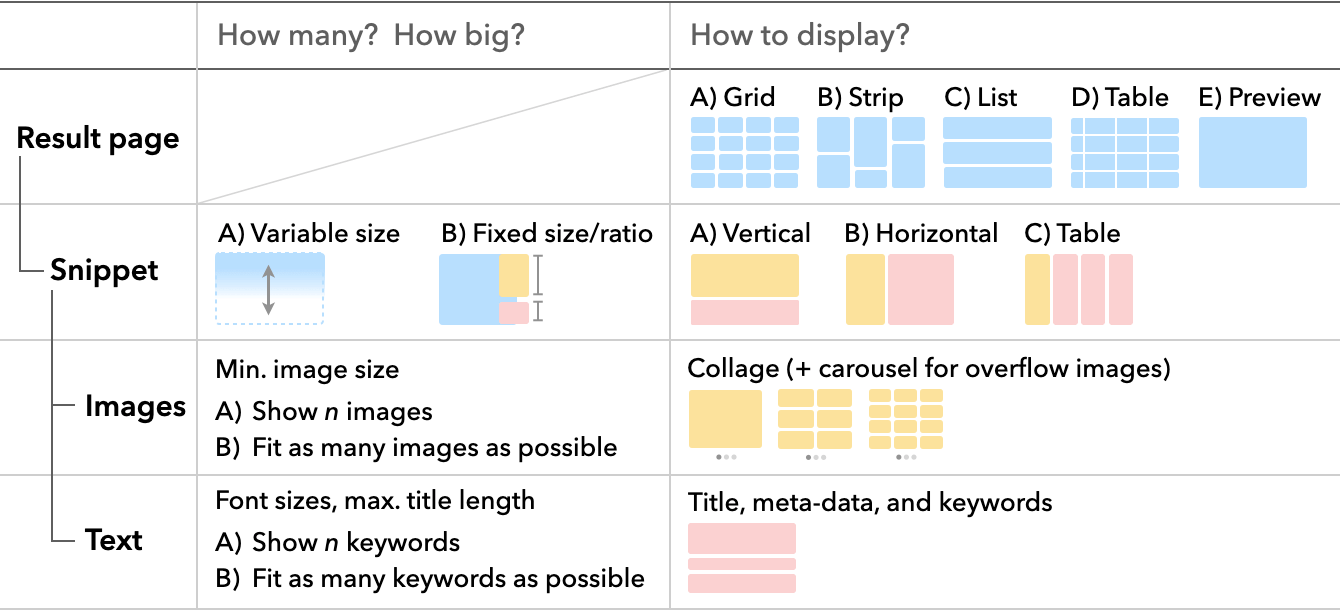
Fig. 3. VizSnippets computational pipeline to compress visual and textual content of visualization bundles into representative snippets.
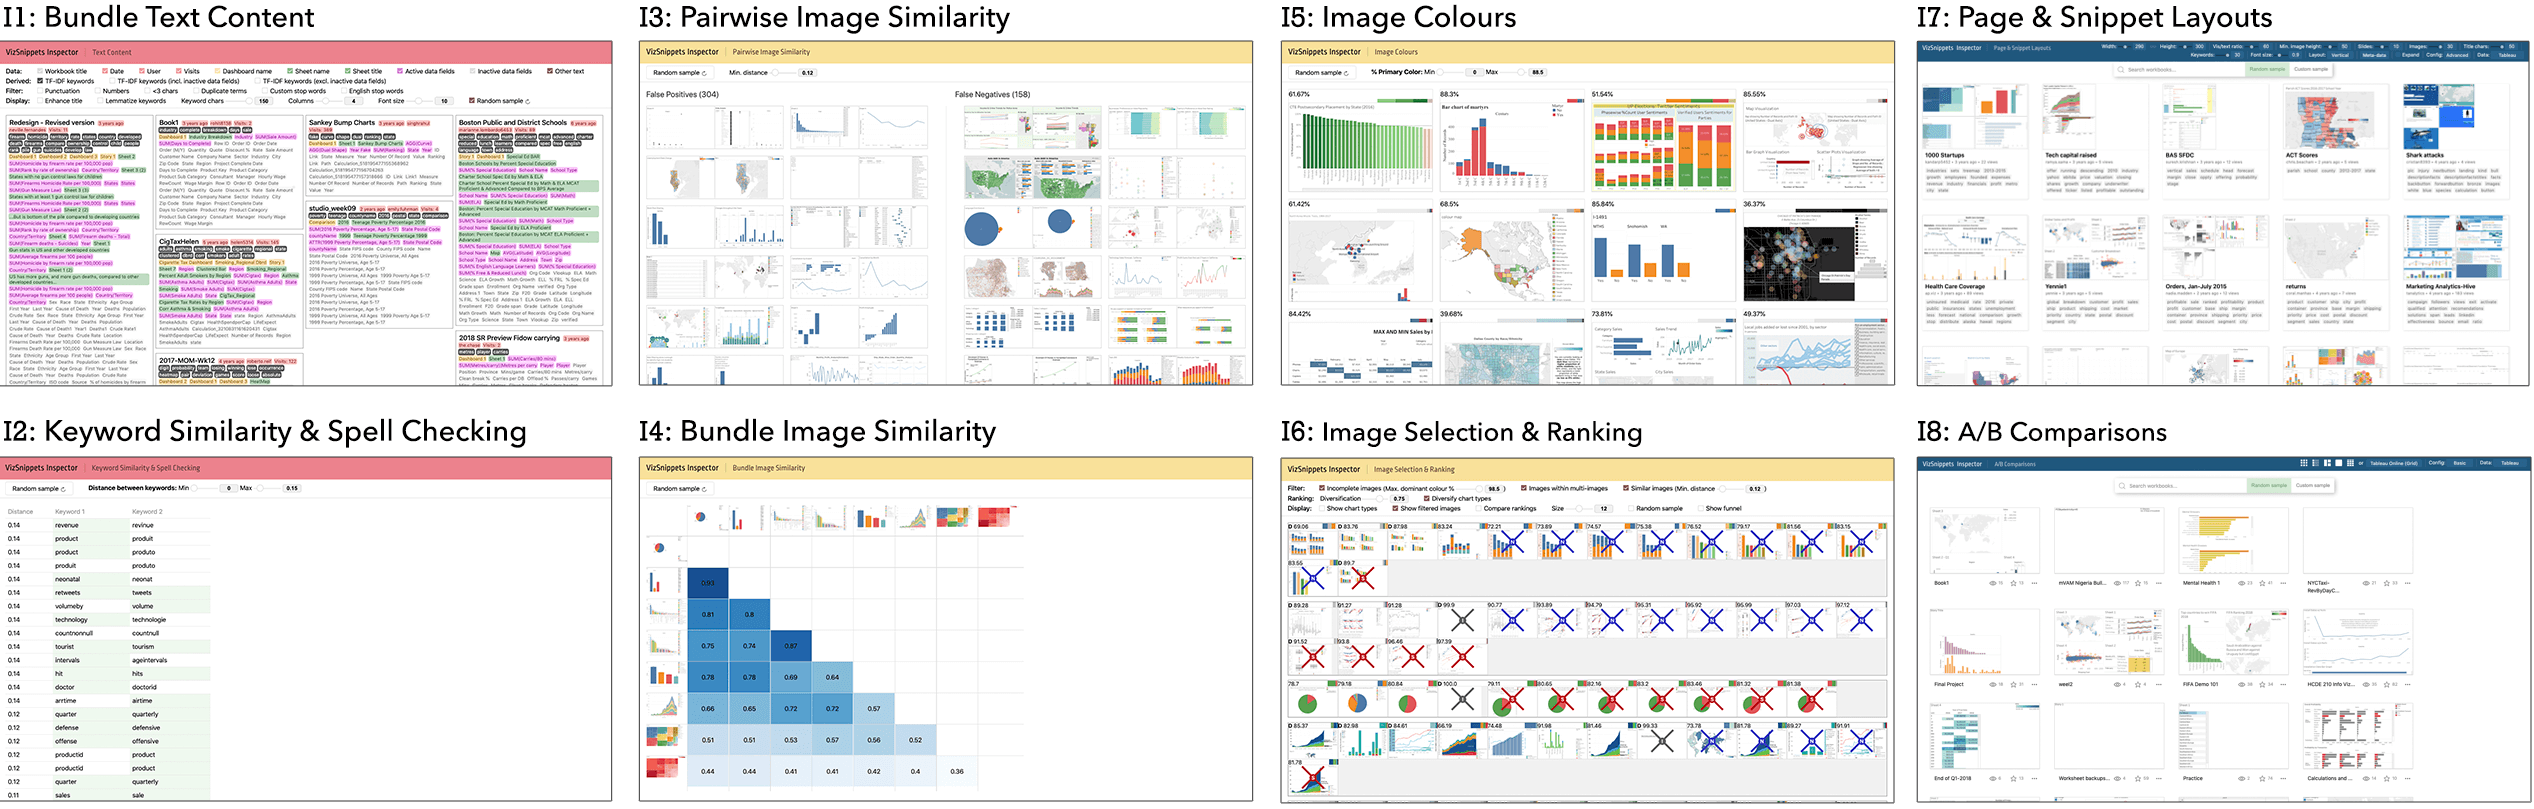
Fig. 4. Overview of visual inspectors that we used to analyze models and parameter settings.
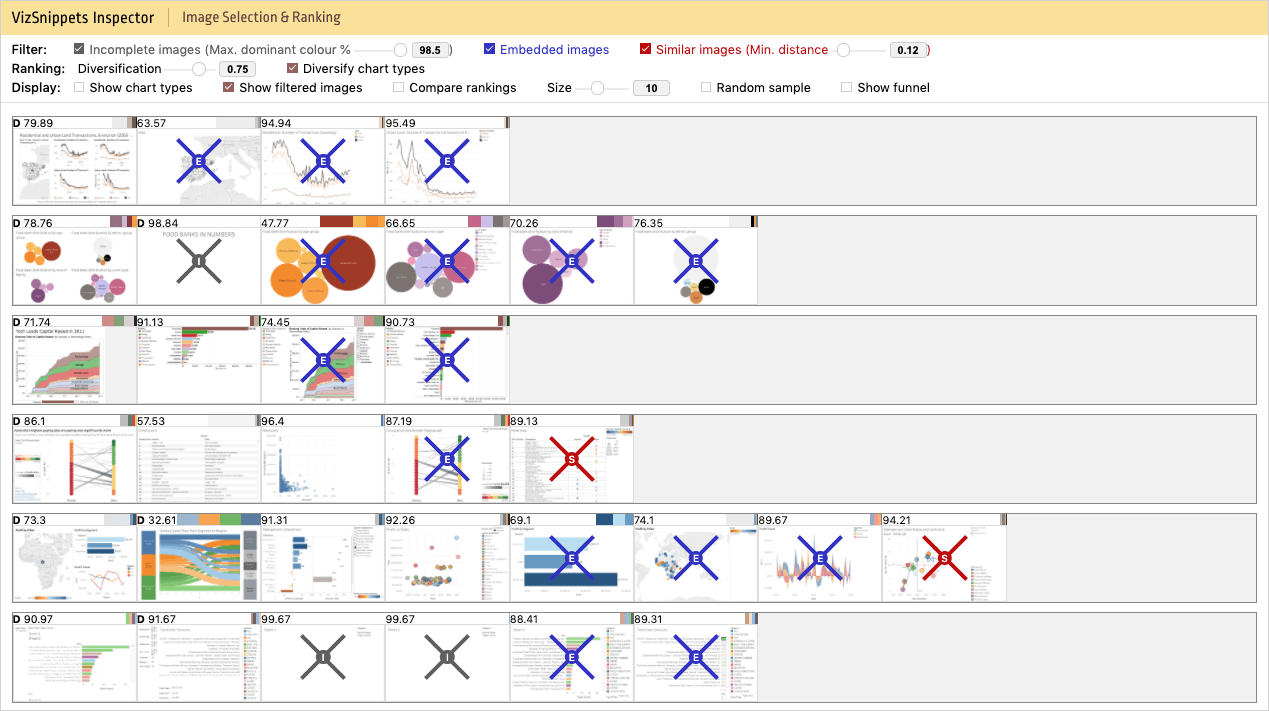
Fig. 5. Visual inspector to analyze the ranking and which images are filtered.
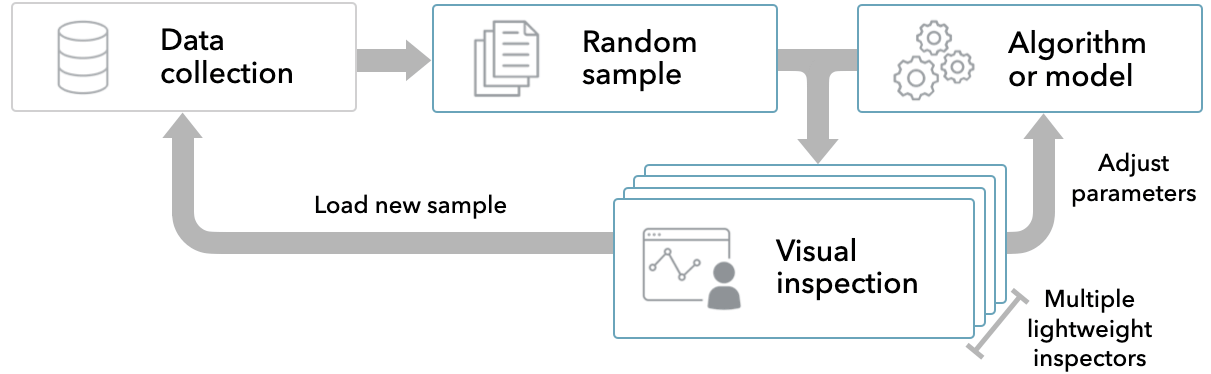
Fig. 6. A conceptual model for extensive, item-level visual inspection through random sampling.