The Sprawlter Graph Readability Metric: Combining Sprawl and Area-aware Clutter
IEEE Transactions on Visualization and Computer Graphics (TVCG), 26(6):2180-2191, 2020.
DOI: 10.1109/TVCG.2020.2970523
(Accepted at IEEE Pacific Visualization Symposium 2020 and invited to TVCG.)
DOI: 10.1109/TVCG.2020.2970523
(Accepted at IEEE Pacific Visualization Symposium 2020 and invited to TVCG.)
Best paper honorable mention award at PacificVis 2020.
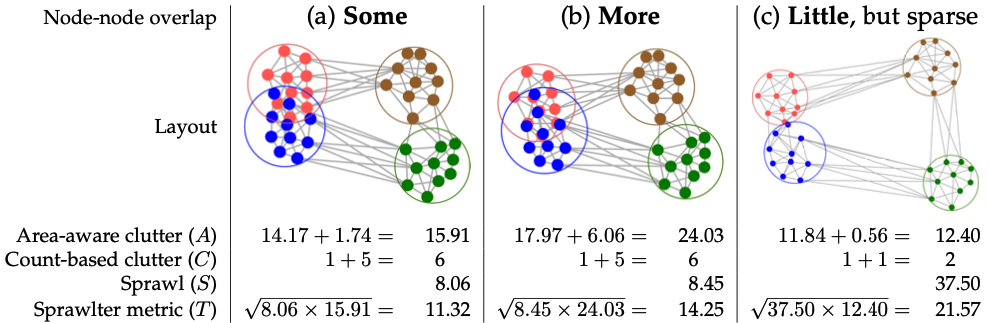
Fig.1 Comparison of approaches to measuring node-node crossing in three synthetic 2-level graph layouts.
Abstract
Graph drawing readability metrics are routinely used to assess and create node-link layouts of network data. Existing readability metrics fall short in three ways. The many count-based metrics such as edge-edge or node-edge crossings simply provide integer
counts, missing the opportunity to quantify the amount of overlap between items, which may vary in size, at a more fine-grained level. Current metrics focus solely on single-level topological structure, ignoring the possibility of
multi-level structure such as large and thus highly salient metanodes. Most current metrics focus on the measurement of clutter in the form of crossings and overlaps, and do not take into account the trade-off between the clutter and
the information sparsity of the drawing, which we refer to as sprawl. We propose an area-aware approach to clutter metrics that tracks the extent of geometric overlaps between node-node, node-edge, and edge-edge pairs in detail. It
handles variable-size nodes and explicitly treats metanodes and leaf nodes uniformly. We call the combination of a sprawl metric and an area-aware clutter metric a sprawlter metric. We present an instantiation of the sprawlter metrics
featuring a formal and thorough discussion of the crucial component, the penalty mapping function. We implement and validate our proposed metrics with extensive computational analysis of graph layouts, considering four layout algorithms
and 56 layouts encompassing both real-world data and synthetic examples illustrating specific configurations of interest.
Materials
- Paper: preprint| IEEE Digital Library| bib
- Supplemental: zip
- Code: github repo
- Talk at PacificVis'20: youtube| slides