Visualizing Dimensionally-Reduced Data: Interviews with Analysts and a Characterization of Task Sequences

Matthew Brehmer, Michael Sedlmair, Stephen Ingram, and Tamara Munzner


Abstract | Paper | Talk | Figures | Supplemental Material

Abstract

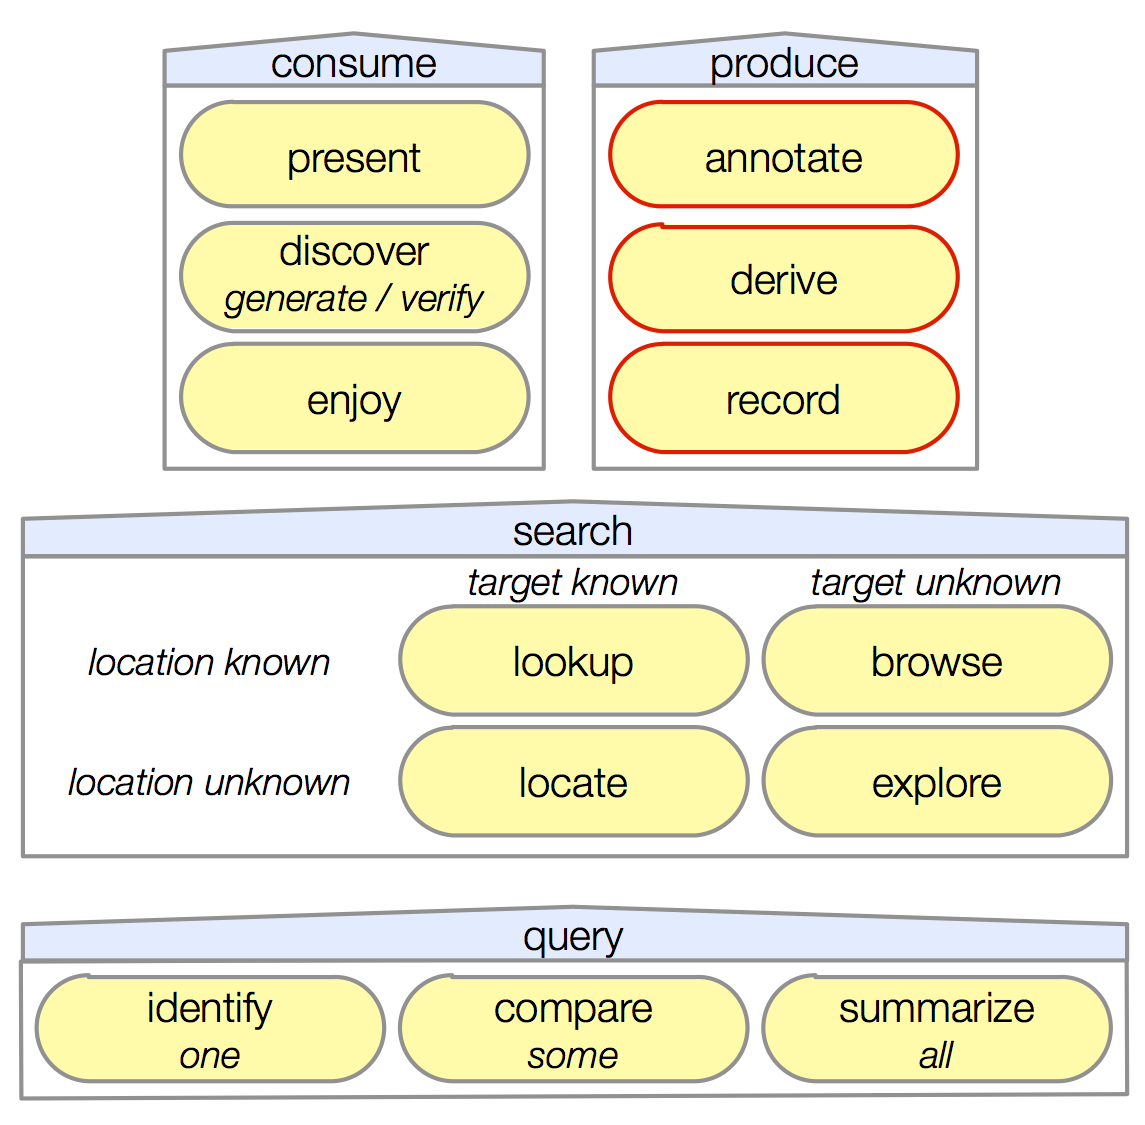
We characterize five task sequences related to visualizing dimensionally-reduced data, drawing from data collected from interviews with ten data analysts spanning six application domains, and from our understanding of the technique literature. Our characterization of visualization task sequences for dimensionally-reduced data fills a gap created by the abundance of proposed techniques and tools that combine high-dimensional data analysis, dimensionality reduction, and visualization, and is intended to be used in the design and evaluation of future techniques and tools. We discuss implications for the evaluation of existing work practices, for the design of controlled experiments, and for the analysis of post-deployment field observations.

Paper

Visualizing Dimensionally-Reduced Data: Interviews with Analysts and a Characterization of Task Sequences

Talk

This paper was presented on Monday, Nov. 10, in the "Rethinking Evaluation Level: Abstracted Task vs In Situ Evaluation" session of BELIV 2014.

Slides (3 MB PDF)
Slides (13 MB Keynote)
Video (8 MB MP4)

High-Resolution Figures

Click on a Figure to open in a new tab.
Fig. 1 (a) Data is reduced to 2D; (b) encoded in a scatter- plot to verify visible clusters; and (c) colour-coded according to preexisting class labels to match clusters and classes.

Fig. 2. A figure from Tenenbaum et al. (2000), in which three synthesized dimensions have been identified: up-down pose along the y-axis, left-right pose along the x-axis, and light- ing direction indicated below each image.

Fig. 3. Example scatterplots of dimensionally-reduced data illus- trating tasks related to item clusters: Verifying the existence of clusters, naming clusters, and matching clusters and classes. (a) no discernible clusters (b) three discernible clusters (c) a match between clusters and class labels (d) a partial match between clusters and class labels (e) no discernible class separation.

Fig. 4 Six tasks related to dimensionally-reduced data, characterized using an abstract task typology [(Brehmer and Munzner, 2013), (Munzner, 2014)], which describes why a task is perform at multiple levels of abstraction (yellow) and what inputs and outputs a task has (grey). These tasks are combined to form the task sequences described in Section 4.

Fig. 5. The why part of the abstract task typology (Brehmer and Munzner, 2013), with the refinement (emphasized in red) that the actions of annotate, record, and derive are forms of produce (Munzner, 2014).


Supplemental Material

Further reading:
Matthew Brehmer
Last modified: Nov 26, 2014.