See Google Scholar for latest papers, this page is not up to date
|
J52:
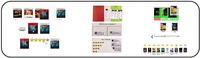
VizSnippets: Compressing Visualization Bundles Into Representative Previews for Browsing Visualization Collections.
Michael Oppermann
and Tamara Munzner
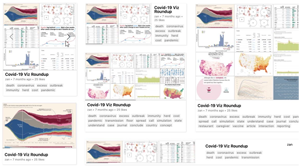
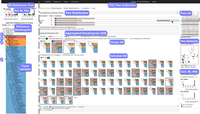
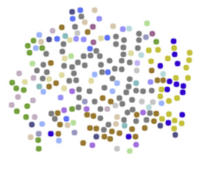
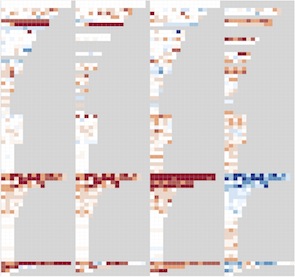
We contribute the first systematic approach to designing visualization snippets: compact previews of interactive visualization bundles, used by millions of people on platforms such as Tableau Online or Power BI. We present a computational pipeline to compress the visual and textual content of bundles into representative previews that is adaptive to a provided pixel budget and provides high information density with multiple images and carefully chosen keywords. We also reflect on the method of visual inspection through random sampling to gain confidence in model and parameter choices.
|
|
|
C31:
TimeElide: Visual Analysis of Non-Contiguous Time Series Slices..
Michael Oppermann
Luce Liu,
and Tamara Munzner
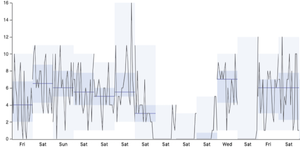
Short paper on the design and implementation of TimeElide, a visual analysis tool for the novel data abstraction of non-contiguous time series slices, namely time intervals that contain a sequence of time-value pairs but are not adjacent to each other.
|
|
|
J51:
Visualizing Graph Neural Networks with CorGIE: Corresponding a Graph to Its Embedding.
Zipeng Liu,
Yang Wang,
Jürgen Bernard,
and
Tamara Munzner
IEEE TVCG 28(6):2500-2516, 2022. doi:10.1109/TVCG.2022.3148197
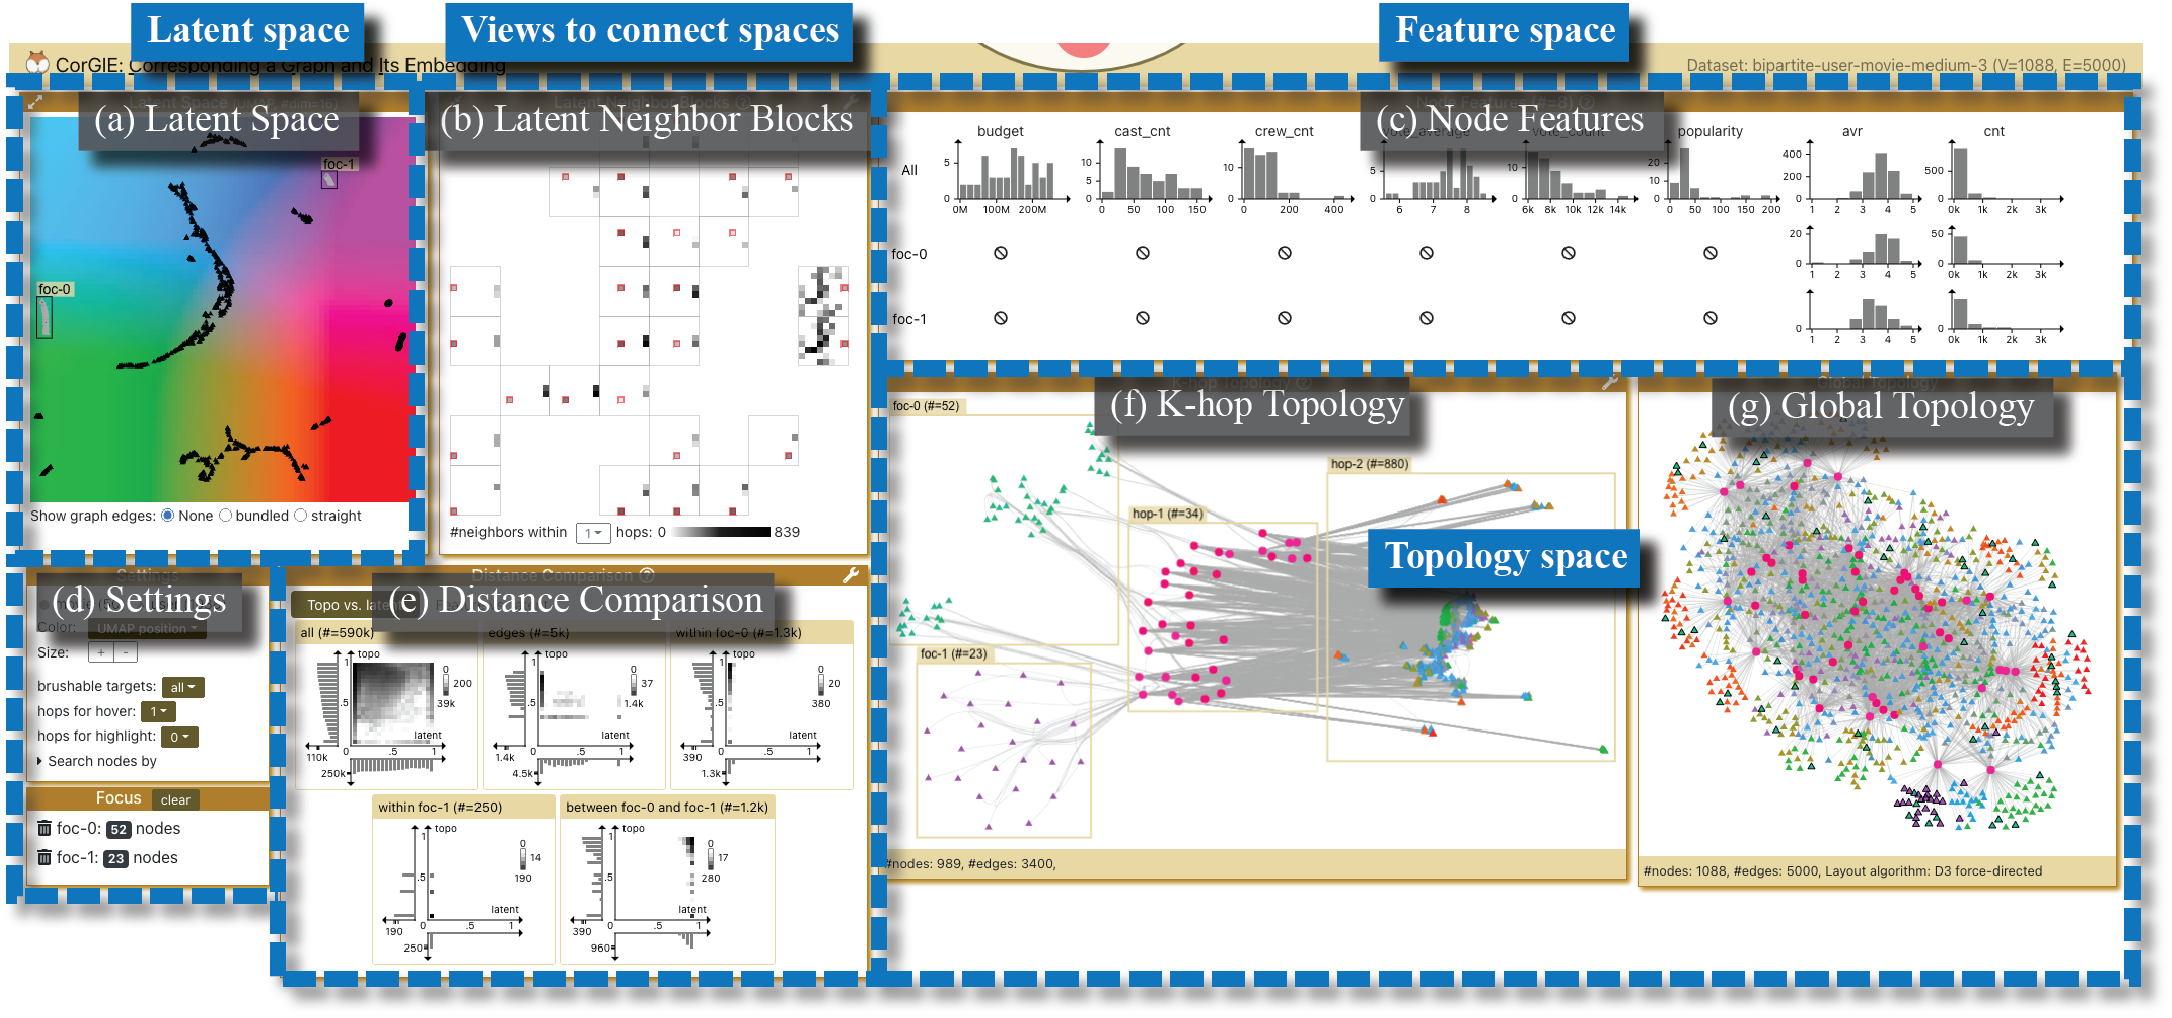
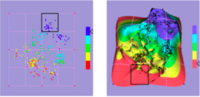
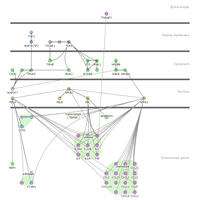
Graph neural networks (GNNs) are a class of powerful machine learning tools that model node relations for making predictions of nodes or links. We propose an approach to corresponding an input graph to its node embedding (aka latent space), a common component of GNNs that is later used for prediction. We abstract the data and tasks, and develop an interactive multi-view interface called CorGIE to instantiate the abstraction. As the key function in CorGIE, we propose the K-hop graph layout to show topological neighbors in hops and their clustering structure.
|
|
|
J50:
GEViTRec: Data Reconnaissance Through Recommendation Using a Domain-Specific Prevalence Visualization Design Space.
Anamaria Crisan,
Shannah Fisher, Jennifer L.
Gardy, Tamara
Munzner.
arXiv:2010.11975 preprint, IEEE
TVCG 28(12):4855-4872, 2022
version
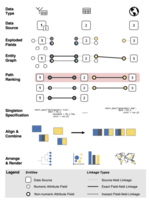
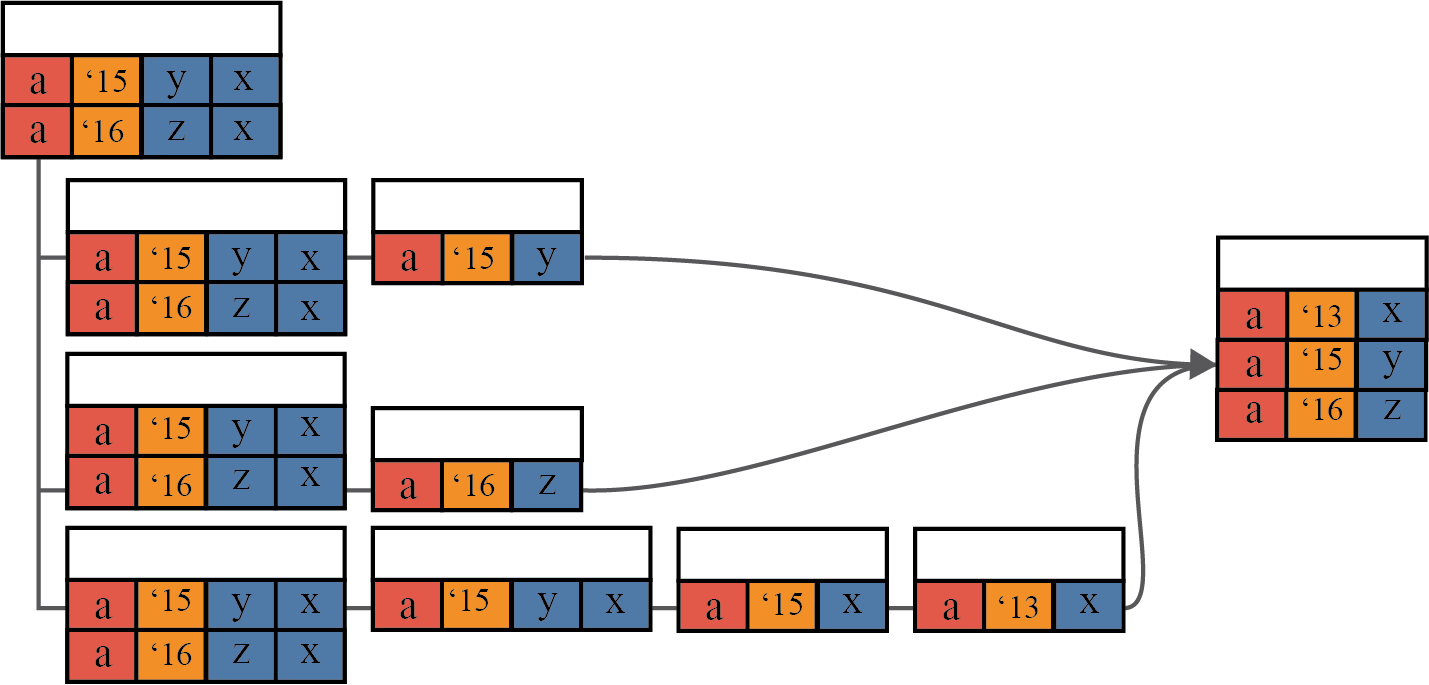
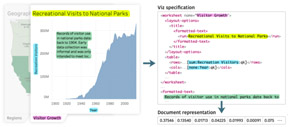
We present an algorithm for data reconnaissance through automatic visualization recommendation, GEViTRec. Our approach handles a broad variety of dataset types and automatically generates coordinated combinations of charts, in contrast to existing systems that primarily focus on singleton visual encodings of tabular datasets. We automatically detect linkages across multiple input datasets by analyzing non-numeric attribute fields, creating an entity graph within which we analyze and rank paths. For each high-ranking path, we specify chart combinations with spatial and color alignments between shared fields, using a gradual binding approach to transform initial partial specifications of singleton charts to complete specifications that are aligned and oriented consistently. A novel aspect of our approach is its combination of domain-agnostic elements with domain-specific information that is captured through a domain-specific visualization prevalence design space.
|
|
|
J49:
ProSeCo:
Visual analysis of class separation measures and dataset
characteristics.
Jürgen Bernard, Marco Hutter, Matthias Zeppelzauer, Michael Sedlmair, Tamara Munzner.
Computers & Graphics 96:48-60 2021.
Journal version of SepEx EuroVA workshop
paper.
|
|
|
J48:
Table Scraps: An Actionable Framework for Multi-Table DataWrangling From An Artifact Study of Computational Journalism.
Steve Kasica, Charles Berret, and
Tamara Munzner.
IEEE Trans. Visualization and Computer Graphics (Proc.
InfoVis 2020) 27(2):957-966 2021.
We conduct a technical observation study of 50 public repositories of data and analysis code authored by 33 professional journalists at 26 news organizations. We develop two detailed and cross-cutting taxonomies of data wrangling in computational journalism, for actions and for processes. We observe the extensive use of multiple tables, a notable gap in previous wrangling analyses. We develop a concise, actionable framework for general multi-table data wrangling that includes wrangling operations documented in our taxonomy that are without clear parallels in other work.
|
|
|
J47:
VizCommender: Computing Text-Based Similarity in Visualization Repositories for Content-Based Recommendations.
Michael Oppermann,
Robert Kincaid,
and Tamara Munzner.
IEEE Trans. Visualization and Computer Graphics (Proc. VAST
2020) 27(2): 495-505, 2021.
We discuss the challenges associated with creating a
content-based recommendation system based on visualization specifications and explore more concretely how to implement the relevance measures required using Tableau workbook specifications as the source of content data. We also demonstrate what information can be extracted from these visualization specifications and how various natural language processing techniques can be used to compute similarity between workbooks as one way to measure relevance.
|
|
|
C30:
Data-First
Visualization Design Studies.
Michael Oppermann
and Tamara Munzner
IEEE VIS Workshop Evaluation and Beyond - Methodological
Approaches for Visualization (BELIV) 2020.
We introduce the notion of a data-first design study which is triggered by the acquisition of real-world data instead of specific stakeholder analysis questions.
|
|
|
O15:
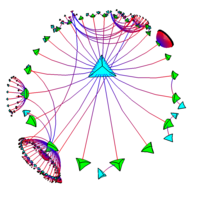
LSQT: Low-Stretch Quasi-Trees
for Bundling and Layout.
Rebecca Vandenberg, Madison Elliott,
Nicholas Harvey, and
Tamara
Munzner.
arXiv:2007.06237 preprint
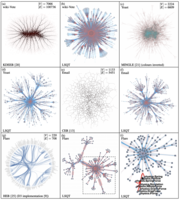
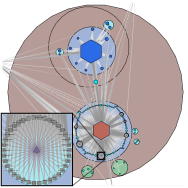
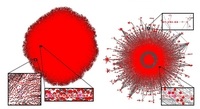
We introduce low-stretch trees to the visualization community with LSQT, our novel technique that uses quasi-trees for both layout and edge bundling. Our method offers strong computational speed and complexity guarantees by leveraging the convenient properties of low-stretch trees, which accurately reflect the topological structure of arbitrary graphs with superior fidelity compared to arbitrary spanning trees. Low-stretch quasi-trees also have provable sparseness guarantees, providing algorithmic support for aggressive de-cluttering of hairball graphs. LSQT does not rely on previously computed vertex positions and computes bundles based on topological structure before any geometric layout occurs.
|
|
|
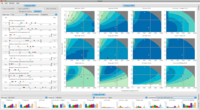
C29:
SepEx: Visual Analysis of Class Separation Measures.
Jürgen Bernard, Marco Hutter, Matthias Zeppelzauer, Michael Sedlmair, Tamara Munzner.
EuroVis Workshop on Visual Analytics (EuroVA), 2020.
We present SepEx, an interactive visualization
approach for the assessment and comparison of class separation measures for multiple datasets. SepEx supports analysts with
the comparison of multiple separation measures over many high-dimensional datasets, the effect of dimensionality reduction
on measure outputs by supporting nD to 2D comparison, and the comparison of the effect of different dimensionality reduction
methods on measure outputs.
|
|
|
C28:
Towards Rigorously Designed Preference Visualizations for Group Decision Making
Emily Hindalong, Jordon Johnson, Giuseppe Carenini. Tamara Munzner.
Proc. IEEE PacificVis Symp. 2020
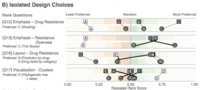
We present detailed data and task models that capture the
demands of group decision making in particular, going through the
four stages of the nested model of visualization design to develop and test a prototype to support group decision making when decision makers express their preferences directly on the alternatives.
|
|
|
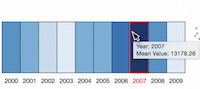
J46:
Ocupado: Visualizing Location-Based Counts Over Time Across Buildings.
Michael Oppermann
and Tamara Munzner.
Computer Graphics Forum 39(3):127-138 (Proc. EuroVis 2020).
We present a multi-year design study that resulted in Ocupado, a set of visual decision-support tools centered around occupancy data for stakeholders in facilities management and planning. Ocupado uses WiFi devices as a proxy for human presence, capturing location-based counts that preserve privacy without trajectories. We contribute data and task abstractions for studying space utilization for combinations of data granularities in both space and time. In addition, we contribute generalizable design choices for visualizing location-based counts relating to indoor environments.
|
|
|
C27:
Data-driven Multi-level Segmentation of Image Editing Logs
Zipeng Liu,
Zhicheng Liu, and Tamara Munzner
Proc. CHI 2020.
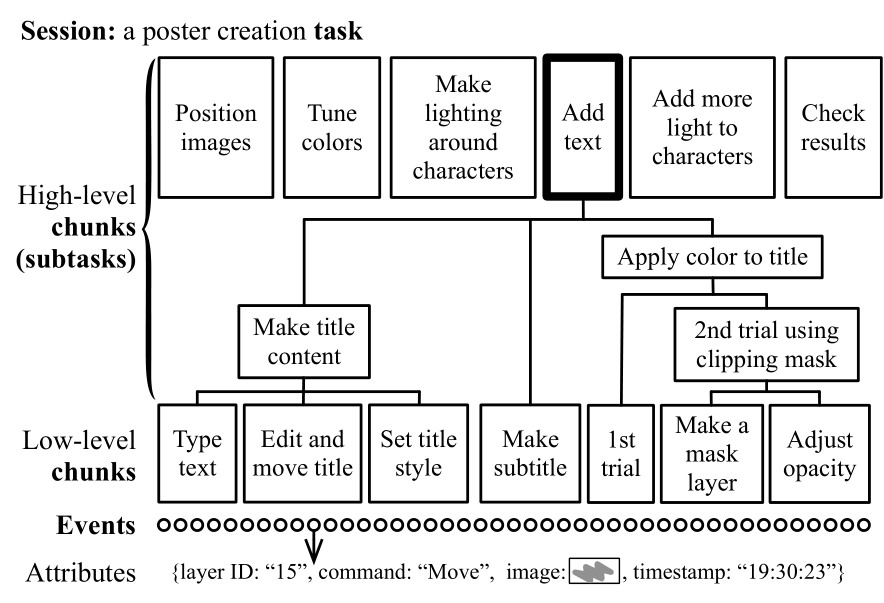
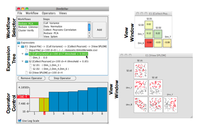
We propose a multi-level segmentation model that works for many image editing tasks including poster creation, portrait retouching, and special effect creation. The lowest-level chunks of logged events are computed using a support vector machine model and higher-level chunks are built on top of these, at a level of granularity that can be customized for specific use cases. Our model takes into account features derived from four event attributes collected in realistically complex Photoshop sessions with expert users: command, timestamp, image content, and artwork layer.
|
|
|
J45:
The Sprawlter Graph Readability Metric: Combining Sprawl and Area-aware Clutter.
Zipeng Liu,
Takayuki Itoh,
Jessica Q. Dawson, and Tamara Munzner.
IEEE PacificVis 2020, published
in IEEE TVCG 26(6):2180-2191, 2020. [Best Paper Honorable Mention]
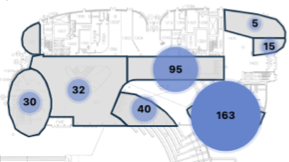
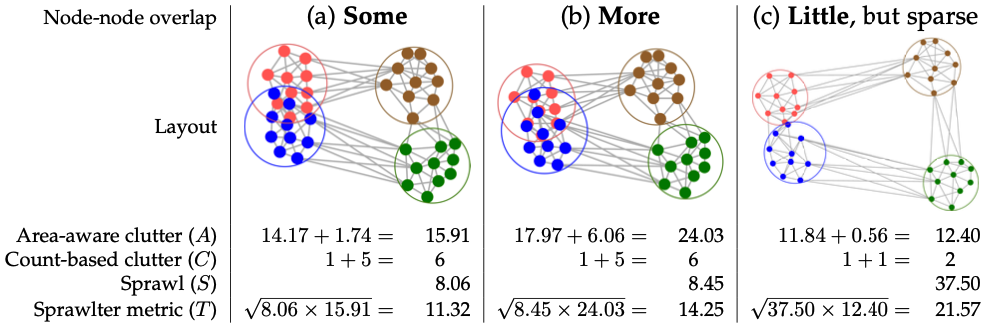
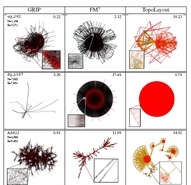
We propose an area-aware approach to clutter metrics that tracks the extent of geometric overlaps between node-node, node-edge, and edge-edge pairs in detail. It handles variable-size nodes and explicitly treats metanodes and leaf nodes uniformly. We call the combination of a sprawl metric and an area-aware clutter metric a sprawlter metric.
|
|

|
C26:
Uncovering Data Landscapes through
Data Reconnaissance and Task Wrangling.
Anamaria
Crisan and Tamara Munzner.
IEEE VIS Short Papers Proceedings 2019.
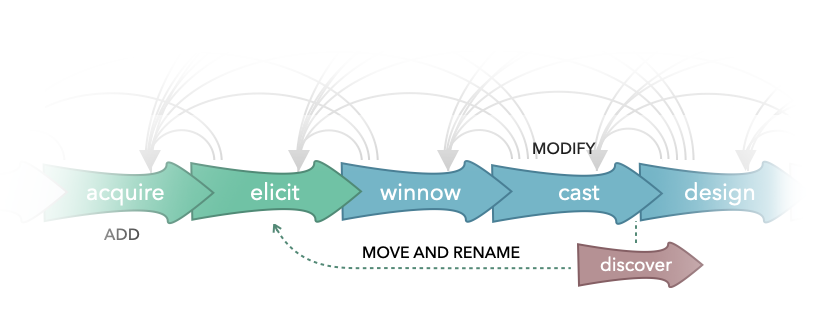
We identify data reconnaissance and task wrangling as processes that experts undertake to discover and identify
sources of data that could be valuable for some specific analysis goal.We propose
a conceptual framework with a four-phase cycle of acquire, view,
assess, and pursue that occurs within three distinct chronological
stages, which we call fog and friction, informed data ideation, and
demarcation of final data.
|
|
|
J44:
Segmentifier: Interactive Refinement of Clickstream Data.
Kimberly Dextras-Romagnino and Tamara Munzner.
Computer Graphics Forum (Proc. EuroVis 2019).
Segmentifier supports an iterative process of refining collections of action sequences into meaningful segments, to make sense of large and noisy real-world e-commerce clickstream datasets.
|
|
|
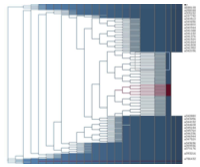
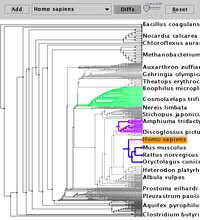
J43:
Aggregated Dendrograms for Visual Comparison Between Many Phylogenetic Trees.
Zipeng Liu, Shing
Hei Zhang, and Tamara
Munzner.
IEEE Trans. Visualization and Computer Graphics (TVCG) 29(9):2732-2747
2019.
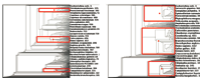
We present the new visual encoding idiom of aggregated dendrograms to concisely summarize the topological relationships between interactively chosen focal subtrees according to biologically meaningful criteria, and provide a layout algorithm that automatically adapts to the available screen space.
|
|
|
J42:
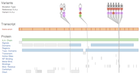
A systematic method for surveying data visualizations and a resulting genomic epidemiology visualization typology: GEViT.
Anamaria Crisan, Jennifer L. Gardy, and Tamara Munzner. Bioinformatics, 35(10):1668-1676, 2019.
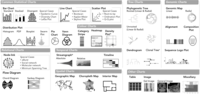
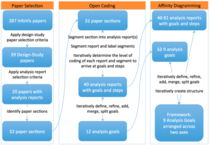
We present a method for systematically surveying data visualizations using the analysis of both text and images, and the result of applying this method to the domain of genomic epidemiology.
|
|
|
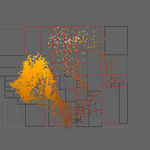
J41:
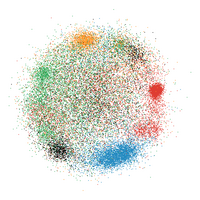
Adjutant: an R-based tool to support topic discovery for systematic and literature reviews.
Anamaria Crisan, Jennifer L. Gardy, and Tamara Munzner. Bioinformatics Application Note 35(6):1070-1072, 2019.
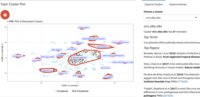
Given a PubMed-compatible search query, Adjutant downloads the relevant articles and allows the user to perform an unsupervised clustering analysis to identify data-driven topic clusters. Following clustering, users can also sample documents using different strategies to obtain a more manageable dataset for further analysis.
|
|
|
O14:
Uncovering Spatiotemporal Dynamics From Non-Trajectory Data.
Michael Oppermann and Tamara Munzner. Proc. CityVis 2018 (workshop affiliated with IEEE VIS).
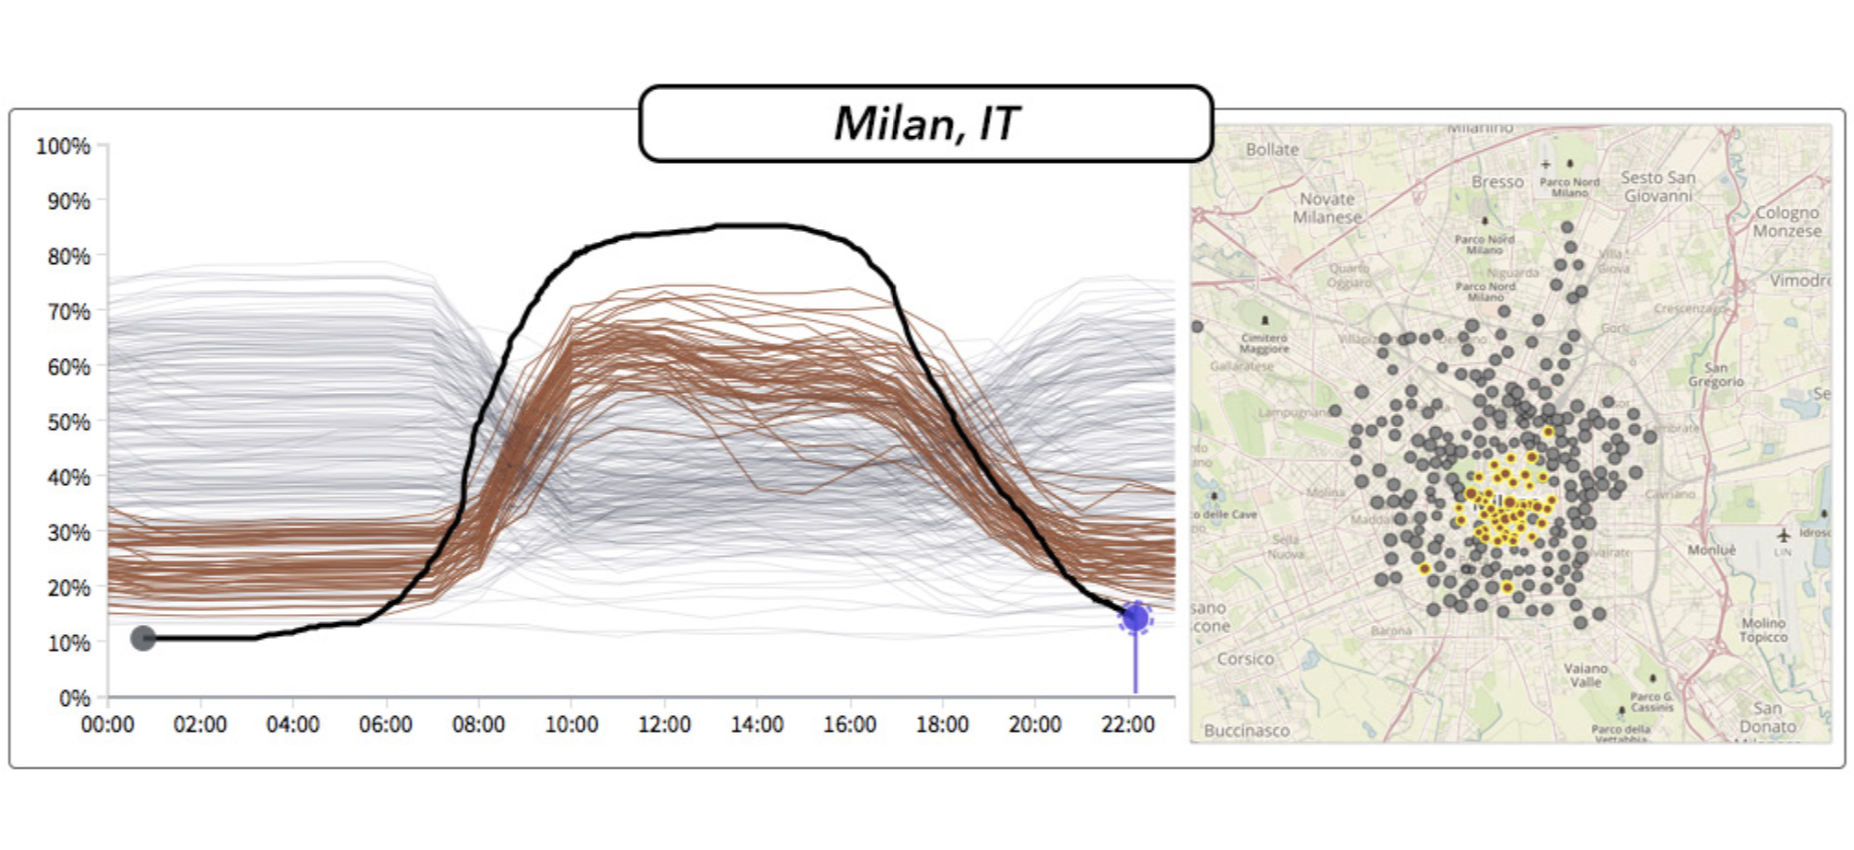
We discuss we learned across two projects involving spatiotemporal data that does not use the data abstraction of trajectories: bike-sharing networks and human occupancy data for buildings. We discuss the general implications of this data type in terms of ethics, data preprocessing, tasks, and visual encodings.
|
|

|
C25:
GaRSIVis: Improving the Predicting
of Self-Interruption during Reading using Gaze Data.
Jan Pilzer, Shareen
Mahmud, Vanessa Putnam,
and Tamara Munzner. Proc. ETVIS 2018.
The Gaze Reading Self-Interruption Visualizer integrates a visualization front-end suitable for data cleansing and a prediction back-end that can be run repeatedly as the input data is iteratively improved.
|
|
|
J40:
A Novel Methodology for
Characterizing Cell Subpopulations in Automated Time-lapse
Microscopy.
Georges Hattab, Veit
Wiesmann, Anke
Becker, Tamara Munzner and Tim W.
Nattkemper. Frontiers in in Bioengineering and Biotechnology
28;6:17, 2018.
The patch lineage graph encapsulates the history of
cellular colonies by exploiting temporal and spatial coherence
of subpopulations using a particle-based approach, for datasets
where the traditional approach of single-cell detection fails due to
high density, and high diversity of cell shapes and numbers, for
high-resolution images with high amounts of noise.
|
|
|
J39:
Evidence-based design and evaluation of a whole genome sequencing clinical report for the reference microbiology laboratory.
Anamaria Crisan, Geoff
McKee, Tamara Munzner, and Jennifer
L. Gardy.
PeerJ 6:e4218, 2018.
Evidence-based guidelines for communicating tuberculosis genomic test results, using
rigorous methods for generating and testing
alternative formats based on iterative and human-centered visualization design study methodology.
|
|
|
J38:
Bridging
From Goals to Tasks with Design Study Analysis Reports.
Heidi Lam, Melanie
Tory, and Tamara Munzner.
IEEE TVCG 24(1):435-445 (Proc. InfoVis 2017). [Best Paper
Honorable Mention]
Framework based on analysis reports derived from open-coding 20 design study papers published at IEEE InfoVis 2009-2015, to build on the previous work of abstractions that collectively encompass a broad variety of domains.
|
|
|
C24:
On Regulatory and Organizational Constraints in Visualization Design and Evaluation.
Anamaria Crisan,
Jennifer Gardy, and
Tamara Munzner.
ACM Workshop on Beyond Time And Errors: Novel Evaluation Methods For Visualization (BELIV) 2016.
Discussion of adapting visualization methodology in the highly regulated fields such as public health, with a case study on tuberculosis clinical care through the BC Centre for Disease Control. |
|
|
J37:
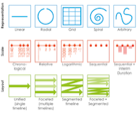
Timelines Revisited: A Design Space and Considerations for Expressive Storytelling
.
Matthew Brehmer, Bongshin Lee, Benjamin Bach, Nathalie Henry Riche, and Tamara Munzner. IEEE Transactions on
Visualization and Computer Graphics 23(9) 2017.
An exploration of the design space of timelines for presentation. |
|
|
J36:
Matches,
Mismatches, and Methods: Multiple-View Workflows for Energy
Portfolio Analysis.
Matthew Brehmer, Jocelyn Ng, Kevin
Tate, and Tamara Munzner. IEEE Transactions on
Visualization and Computer Graphics (Proc IEEE InfoVis 2015), 22(1):449-458.
Redesign study in the energy analysis domain. |
|
|
J35:
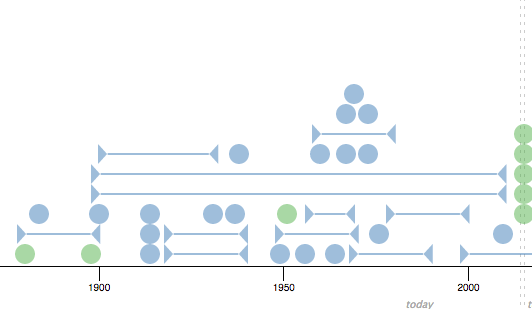
TimeLineCurator:
Interactive Authoring of Visual Timelines from Unstructured
Text.
Johanna Fulda, Matthew Brehmer, and Tamara
Munzner. IEEE Transactions on
Visualization and Computer Graphics (Proc IEEE VAST 2015), 22(1):300-309.
Authoring tool for journalists and others who want to
quickly create timelines from free-form text.
|
|
|
J34:
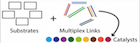
Detangler:
Visual Analytics for Multiplex Networks.
Benjamin Renoust, Guy
Melancon, and Tamara Munzner
Computer Graphics Forum (Proc. EuroVis 2015) 34(3):321-330, 2015.
Visual analysis of group cohesion in multiplex networks
through dual linked views, featuring the new data abstractions of
substrate and catalyst networks.
|
|
|
C23:
Visualizing Dimensionally-Reduced Data: Interviews with Analysts and a Characterization of Task Sequences.
Matthew Brehmer,
Michael Sedlmair (University of Vienna),
Stephen Ingram, and
Tamara
Munzner.
BELIV 2014 (Workshop on
BEyond time and errors: novel evaLuation methods for Information Visualization)
We characterize five task sequences related to visualizing dimensionally-reduced data, drawing from data collected from interviews with ten data analysts spanning six application domains, and from our understanding of the technique literature.
|
|
|
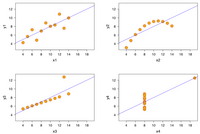
J33:
A Search Set Model of Path Tracing in Graphs.
Jessica Dawson, Joanna McGrenere, and Tamara Munzner.
Information Visualization Journal, 14(4):308-338 2015
A predictive model based on extensive qualitative
analysis from an observational study, with preliminary validation
through a hierarchical multiple regression analysis comparing
graph readability factors.
|
|
|
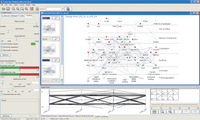
J32:
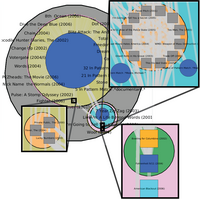
Overview: The Design, Adoption, and Analysis of a Visual Document Mining Tool For Investigative Journalists.
Matthew Brehmer, Stephen Ingram, Jonathan Stray, and Tamara Munzner.
IEEE Trans. Visualization and
Computer Graphics 20(12):2271-2280 (Proc. InfoVis 2014).
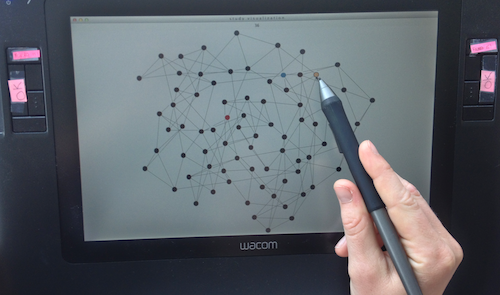
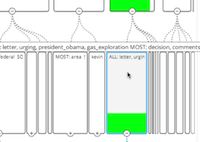
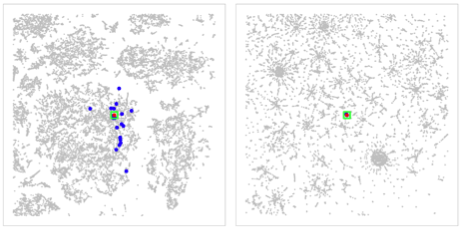
A design study about Overview, an application for the
systematic analysis of large document collections based on document
clustering, visualization, and tagging.
|
|
|
J31:
Dimensionality Reduction for Documents with Nearest Neighbor Queries.
Stephen Ingram and Tamara Munzner.
Neurocomputing (Special Issue
Visual Analytics using Multidimensional
Projections held at EuroVis 2013), Volume 150 Part B, p 557-569, 2015.
The QSNE document-focused dimensionality reduction algorithm combines stochastic neighborhood embedding with query techniques from information retrieval.
|
|
|
J30:
The Nested Blocks and Guidelines Model.
Michael Sedlmair, Miriah Meyer, P. Samuel Quinan, and Tamara Munzner.
Information Visualization Journal, 14(3):234-249, 2015.
Journal version of BELIV 2012 workshop paper on nested model extension; additions are analysis of three papers from InfoVis12 with the NBGM, and an examination of design models in previous work.
|
|
|
J29:
Empirical Guidance on Scatterplot and Dimension Reduction Technique Choices.
Michael Sedlmair, Tamara Munzner, and Melanie Tory.
IEEE Trans. Visualization and Computer Graphics (Proc. InfoVis), 19(12):2634-2643, 2013.
Quantitative data study analyzing three types of scatterplots (2D, SPLOM, and 3D) and four types of DR choices. Key findings: 2D is often good enough, and switching DR techniques is the best next step; SPLOMs occasionally add value; interactive 3D rarely helps and often hurts.
|
|
|
J28:
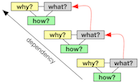
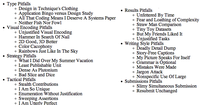
A Multi-Level Typology of Abstract Visualization Tasks.
Matthew Brehmer and Tamara Munzner.
IEEE Trans. Visualization and Computer Graphics (Proc. InfoVis),
19(12):2376-2545, 2013.
Framework for analyzing individual and compound tasks in terms of why-what-how.
|
|
|
J27:
Variant View: Visualizing Sequence Variants in their Gene Context
Joel A. Ferstay,
Cydney B Nielsen and
Tamara Munzner.
IEEE Trans. Visualization and Computer Graphics (Proc. InfoVis), 19(12):2546-2555, 2013.
Design study for genomic data proposing alternative to standard genome browser approach.
|
|
|
C22:
The Four-Level Nested
Model Revisited: Blocks and Guidelines.
Miriah Meyer, Michael Sedlmair,
and Tamara Munzner.
Proc. Workshop on BEyond time and errors: novel evaLuation
methods for Information Visualization (BELIV), 2012.
An extension to the four-level Nested Model for design and
validation of visualization systems that defines the term
guidelines in terms of blocks at each level.
|
|
|
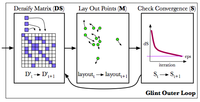
C21:
Glint: An MDS Framework for
Costly Distance Functions.
Stephen Ingram and
Tamara Munzner.
Proc. SIGRAD 2012, p 29-38.
Glint is designed to automatically minimize the total number of
distances computed by progressively computing a more and more
densely sampled approximation of the distance matrix.
|
|
|
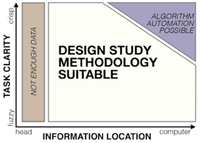
J26:
Design Study Methodology:
Reflections from the Trenches and the Stacks.
Michael Sedlmair,
Miriah Meyer, and
Tamara Munzner.
IEEE Trans. Visualization and Computer Graphics (Proc. InfoVis 2012),
18(12):2431-2440, 2012. [Best Paper Honorable Mention]
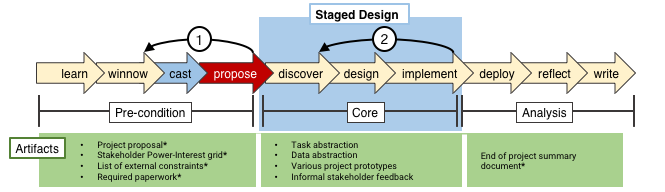
We provide definitions, propose a methodological framework, and
provide practical guidance for conducting design studies.
|
|
|
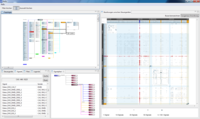
J25:
RelEx: Visualization for
Actively Changing Overlay Network Specifications.
Michael Sedlmair, Annika Frank,
Tamara Munzner, and Andreas Butz.
IEEE Trans. Visualization and Computer Graphics (Proc. InfoVis 2012),
18(12):2729-2738, 2012.
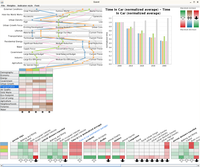
Design study focused on supporting automotive engineers who need
to specify and optimize traffic patterns for in-car communication
networks. The task and data abstractions for
actively making changes to an overlay network, where logical
communication specifications must be mapped to an underlying
physical network network, are very different than the dominant use
cases from the domain of social network analysis.
|
|
|
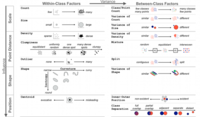
J24:
A Taxonomy of Visual
Cluster Separation Factors.
Michael Sedlmair, Andrada
Tatu, Tamara Munzner, and Melanie Tory
Computer Graphics Forum (Proc. EuroVis 2012), 31(3):1335-1344, 2012.
Qualitative evaluation of 800+ plots, including analysis of the
reasons for failure of previous cluster separation metrics and a
taxonomy of factors that affect separation.
|
|
|
J23:
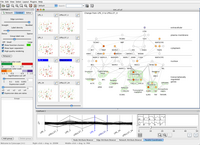
Vismon: Facilitating Analysis of
Trade-Offs, Uncertainty, and Sensitivity In Fisheries Management
Decision Making.
Maryam Booshehrian,
Torsten Möller,
Randall
Peterman, and
Tamara Munzner.
Computer Graphics Forum (Proc. EuroVis 2012), 31(3):1235-1244, 2012.
Design study supporting the analysis of fisheries simulation data,
including sensitivity analysis, global trade-offs analysis, and
staged uncertainty.
|
|
|
|
|
C20:
The design space of opinion measurement interfaces: exploring recall
support for rating and ranking.
Syavash
Nobarany, Louise Oram, Vasanth Kumar Rajendran, Chi-Hsiang
Chen, Joanna McGrenere, Tamara Munzner
Proc. Conf. on Human Factors in Computing Systems (CHI) 2012,
pp 2035-2044.
The proposed design space is spanned by two axes: recall support,
and absolute rating vs.
relative ranking.
|
|
|
M1:
Applying Information Visualization Principles to Biological Network
Displays.
Tamara Munzner
Proc. SPIE-IS&T Human Vision and Electronic Imaging 2011, SPIE
Vol 7865, 78650D1-13.
Invited paper discussing Cerebral
and Pathline design rationale in detail in the
context of the Nested Model framework.
|
|
|
D3:
Reflections
on QuestVis: A Visualization System for an Environmental
Sustainability Model
Tamara Munzner, Aaron
Barsky, Matt Williams.
Scientific Visualization: Interactions, Features, Metaphors.
Dagstuhl Follow-Ups 2, 2011, Chapter 17, p 240--259.
DOI
Reflections on the design of a system for visualizing a
high-dimensional environmental sustainability dataset. Despite some
successes on designing visual encoding and interaction techniques,
QuestVis was ultimately not deployed because of a mismatch between the
design goals of the project and the true needs of the target user
community. We analyze this breakdown in the context of the
Nested Model framework, which was
motivated in part by this experience.
|
|
B2:
A
Guide to Visual Multi-Level Interface Design From Synthesis of
Empirical Study Evidence.
Heidi Lam
and Tamara Munzner.
Synthesis Lectures on Visualization Series, Lecture 1, Morgan
Claypool, November 2010. ISBN: 9781608455928 paperback, ISBN:
9781608455935 ebook. (117 page monograph)
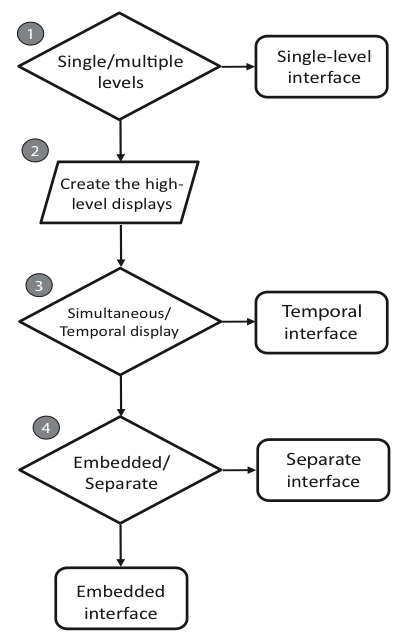
This monograph provides design guidelines for designing multi-level
interfaces based on a fine-grained analysis of of 22 empirical
studies. We considered three multi-level interface types in this
synthesis review: temporal, or temporal switching of the
different levels as in zooming interfaces; separate, or
displaying the different levels simultaneously but in separate windows
as in overview + detail interfaces; and embedded, or showing
the different levels in a unified view as in focus + context
interfaces.
|
|
J22:
MulteeSum: A Tool for Comparative Temporal Gene
Expression and Spatial Data.
Miriah Meyer,
Tamara Munzner,
Angela DePace
and
Hanspeter Pfister.
IEEE Trans. Visualization and Computer Graphics 16(6):908-917 (Proc. InfoVis
2010), 2010.
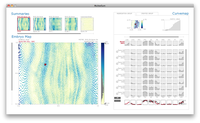
Design study about a visualization tool that supports exploration
of multiple possible computational summaries that mix spatial
information about each cell in a developing fruit fly embryo, gene
expression measurements over time, and data from multiple related
species or organisms.
|
|
|
C19:
DimStiller: Workflows for dimensional analysis and reduction.
Stephen Ingram, Tamara Munzner, Veronika Irvine, Melanie Tory, Steven Bergner, and Torsten Möller.
IEEE Conference on Visual Analytics Software and Technologies (VAST) 2010, p 3-10.
Dimensionality reduction for the rest of us: system paper about
toolkit for dimensionality reduction providing
local and global guidance to users who may not be
experts in the mathematics of high-dimensional
data analysis.
|
|
|
J21:
Tugging
Graphs Faster: Efficiently Modifying Path-Preserving Hierarchies for Browsing Paths
Daniel Archambault, Tamara
Munzner, and David
Auber.
IEEE Trans. Visualization and Computer Graphics 17(3):276--289, 2011.
Journal version of PacificVis TugGraph paper.
|
|
|
J20:
Pathline: A Tool for Comparative
Functional Genomics.
Miriah Meyer,
Bang Wong,
Tamara Munzner,
Mark
Styczynski
and
Hanspeter Pfister.
Computer Graphics Forum (Proc.
EuroVis 2010), 29(3):1043-1052
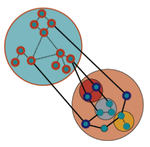
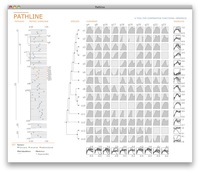
Design study of a visualization tool for comparative functional genomics
supporting simultaneous analysis of functional, pathway, and
phylogenetic data. We
present two new visual encoding techniques:
linearized metabolic pathways, and curvemaps.
|
|
|
J19:
A Nested Model for Visualization Design and Validation.
Tamara Munzner.
IEEE Trans. Visualization and Computer Graphics (Proc. InfoVis
09), 15(6):921-928, 2009.
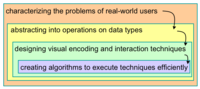
This model provides a unified framework for considering both
the design and the validation of visualization systems at
four cascading levels, with
prescriptive advice on determining appropriate evaluation
approaches by identifying threats to validity unique to each
level.
|
|
|
J18:
MizBee: A Multiscale Synteny Browser.
Miriah Meyer,
Tamara Munzner, and
Hanspeter Pfister.
IEEE Trans. Visualization and Computer Graphics (Proc. InfoVis
09), 15(6):897-904, 2009.
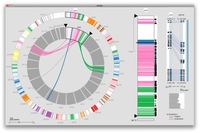
Design study on the creation of a
multiscale synteny browser for exploring conservation relationship in
comparative genomics data.
|
|
|
C18:
TugGraph:
Path-Preserving Hierarchies for Browsing Proximity and Paths in Graphs
Daniel Archambault, Tamara
Munzner, and David
Auber.
IEEE Pacific Visualization Symposium 2009, pp 113-121.
TugGraph is a system for exploring paths and proximity around
nodes and subgraphs in a multilevel graph.
|
|
|
D2:
Visualization.
Tamara Munzner.
Chapter 27, p 675-707, of Fundamentals
of Graphics, Third Edition. by Peter Shirley and Steve Marschner,
with additional contributions by Michael Ashikhmin, Michael Gleicher,
Naty Hoffman, Garrett Johnson, Tamara Munzner, Erik Reinhard, Kelvin
Sung, William B. Thompson, Peter Willemsen, Brian Wyvill. AK Peters,
2009. ISBN: 978-1-56881-469-8
A book chapter for an
undergraduate computer graphics textbook summarizing process,
principles, and techniques for visualization with an emphasis on
abstract data.
|
|
|
J17:
Glimmer: Multilevel MDS on the GPU.
Stephen Ingram, Tamara
Munzner and Marc Olano.
IEEE Trans. Visualization and Computer Graphics (TVCG) 15(2):249-261, Mar/Apr 2009.
Glimmer is a new multilevel multidimensional scaling algorithm
that exploits the GPU. We demonstrate its benefits in a
detailed comparison against several previous algorithms.
|
|
|
J16:
InnateDB: facilitating systems-level
analyses of the mammalian innate immune response.
David J Lynn, Geoffrey L Winsor, Calvin Chan, Nicolas Richard,
Matthew R Laird, Aaron Barsky, Jennifer L Gardy,
Fiona M Roche, Timothy H W Chan, Naisha Shah,
Raymond Lo, Misbah Naseer, Jaimmie Que, Melissa Yau,
Michael Acab, Dan Tulpan, Matthew D Whiteside,
Avinash Chikatamarla, Bernadette Mah, Tamara Munzner,
Karsten Hokamp, Robert E W Hancock, and Fiona S L
Brinkman
Molecular Systems Biology 4:218, 2008.
Paper for the biological community describing InnateDB,
including the Cerebral visualization component.
|
|
|
J15:
Cerebral: Visualizing
Multiple Experimental Conditions on a Graph with Biological Context.
Aaron Barsky,
Tamara Munzner,
Jennifer L. Gardy, and
Robert Kincaid.
IEEE Transactions on Visualization and Computer Graphics (Proc.
InfoVis 2008) 14(6) (Nov-Dec) 2008, p 1253-1260.
We describe the data information display needs of immunologists
and describe the design decisions used to create Cerebral, a system
that
incorporates
experimental data directly into the graph display,
using the biologically guided graph layout announced in the previous appnote.
|
|
|
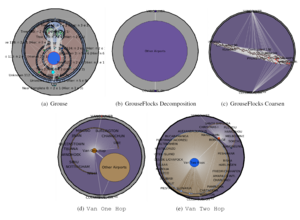
J14:
GrouseFlocks: Steerable Exploration of Graph Hierarchy Space.
Daniel Archambault, Tamara
Munzner, and David
Auber.
IEEE Transactions on Visualization and Computer Graphics 14(4):900-913 (July/August) 2008.
GrouseFlocks supports interactive exploration of the space of possible
hierarchies for an input graph with domain-specific attributes at the
nodes. The system generates hierarchies that reflect
the underlying graph topology by requiring that subgraphs respect
edge and connectivity conservation.
|
|
|
|
C17:
Increasing the Utility of
Quantitative Empirical Studies for Meta-analysis.
Heidi Lam and Tamara Munzner.
Proc. CHI Workshop on BEyond time and errors: novel evaLuation
methods for Information Visualization (BELIV), 2008, pp. 21-27.
Based on our experience in extracting design guidelines from
existing quantitative studies, we recommend improvements to both study
design and reporting to promote meta-analysis.
|
|
|
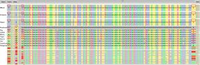
C16:
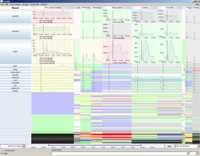
LiveRAC - Interactive Visual
Exploration of System Management Time-Series Data.
Peter McLachlan, Tamara
Munzner, Eleftherios
Koutsofios, Stephen North.
Proc. Conf. on Human Factors in Computing Systems (CHI) 2008,
pp 1483-1492.
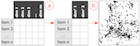
The LiveRAC visualization system supports the analysis of
large collections of time-series data with hundreds of parameters
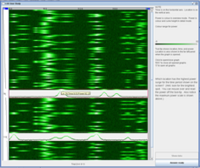
across thousands of network devices. It provides high information
density using a reorderable matrix of charts, with semantic zooming
adapting each chart's visual representation to the available space.
|
|
|
D1:
Process and Pitfalls in
Writing Information Visualization Research Papers.
Tamara Munzner.
Information Visualization: Human-Centered Issues and Perspectives.
Andreas Kerren, John T. Stasko, Jean-Daniel Fekete,
Chris North, eds.
Springer LNCS Volume 4950, p 134-153, 2008.
A book chapter exhorting
infovis authors to avoid pitfalls at several stages of research process,
including visual encoding during design, a checkpoint before starting
to write, and after a full paper draft exists. The paper page includes my
current list of favorite design study examples.
|
|
|
J13:
Spatialization Design: Comparing Points and Landscapes.
Melanie Tory, David W. Sprague,
Fuqu Wu, Wing Yan So, and Tamara Munzner.
IEEE Trans. Visualization and Computer Graphics (Proc. InfoVis 07),
13(6):1262--1269, 2007.
For the task we studied, point-based spatializations were far superior to landscapes, and 2D
landscapes were superior to 3D landscapes.
|
|
|
J12:
Overview Use in Multiple Visual Information Resolution Interfaces.
Heidi Lam, Robert Kincaid, and Tamara Munzner.
IEEE Trans. Visualization and Computer Graphics (Proc. InfoVis 07)
13(6):1278--1285, 2007.
We compared four interfaces: overview-only, detail-only,
separate overview and detail windows, and detail embedded within
overview as in Focus+Context interfaces.
|
|
|
C15:
Session Viewer: Visual Exploratory Analysis of Web Session Logs.
Heidi Lam, Daniel Russell, Diane Tang, and Tamara Munzner.
Proc. IEEE Symposium on Visual Analytics Science and
Technology (VAST), p 147-154, 2007.
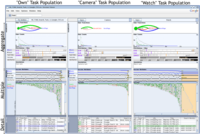
Taking a multiple-coordinated view approach, Session Viewer
shows multiple session populations at the Aggregate, Multiple, and
Detail data levels to support different analysis styles.
|
|
|
C14:
Grouse: Feature-Based, Steerable Graph Hierarchy Exploration.
Daniel Archambault, Tamara
Munzner, and David Auber.
Proc. Eurographics / IEEE VGTC Symposium on Visualization (EuroVis
07), p 67-74.
Interactive and steerable exploration of multilevel graph
hierarchies, as created by TopoLayout.
|
|
|
J11:
Cerebral: a Cytoscape plugin for layout of and interaction with biological networks using subcellular localization annotation.
Aaron Barsky,
Jennifer L. Gardy,
Robert E.W. Hancock, and
Tamara
Munzner.
Bioinformatics 23(8):1040-1042, 2007.
Bioinformatics Advance Access published online on February 19, 2007
Short note aimed at the bioinformatics community announcing a
graph layout approach for protein-protein interaction networks that
exploits annotations about where genes/proteins are expressed within a
cell and their function.
|
|
|
J10:
TopoLayout:
Multi-Level Graph Layout by Topological Features.
Daniel Archambault, Tamara
Munzner, and David
Auber.
Transactions on Visualization and Computer Graphics,
13(2):305--317, Mar/Apr 2007.
Multilevel graph drawing algorithm where the original graph is
decomposed into features based on topological structures such as trees
and clusters, each feature is drawn with an appropriately tuned
algorithm, and passes for crossing reduction and overlap elimination
reduce visual clutter.
|
|
|
J9:
Smashing
Peacocks Further: Drawing Quasi-Trees From Biconnected Components.
Daniel Archambault, Tamara
Munzner, and David
Auber.
IEEE Trans. Visualization and Computer Graphics (Proc. InfoVis 06)
12(5), September 2006, p 813-820.
Two-level approach to drawing complex graphs where an
area-aware version of the RINGS tree drawing algorithm is used to show
the high-level structure, and the force-directed LGL approach is used
to show the low-level structure.
|
|
|
J8:
Composite Rectilinear Deformation for Stretch and Squish Navigation.
James Slack and Tamara Munzner.
IEEE Trans. Visualization and Computer Graphics (Proc. Visualization 2006) 12(5), September 2006, p 901-908.
Navigation for accordion drawing, whereas previous papers focused on rendering.
|
|
|
C13:
Effects of 2D Geometric Transformations on Visual Memory.
Heidi Lam, Ronald A. Rensink, and Tamara Munzner.
Proc. Applied Perception in Graphics and Visualization (APGV 2006), 119-126, 2006.
Evaluation of how both linear and nonlinear geometric transformations affect visual memory, as opposed to previous paper on visual search.
|
|
|
C12:
An Evaluation of Pan&Zoom and Rubber Sheet
Navigation with and without an Overview.
Dmitry Nekrasovski, Adam
Bodnar, François
Guimbretière, Joanna McGrenere,
and Tamara Munzner
Proc. ACM Conf. on Human Factors in Computing Systems (CHI) 2006, p 11-20
Evaluation comparing navigation techniques and availability of
contextual information.
|
|

|
J7:
Visualization Research
Challenges: A Report Summary.
Robert Moorhead,
Chris Johnson,
Tamara Munzner,
Hanspeter Pfister,
Penny Rheingans, and
Terry S. Yoo.
IEEE Computing in Science & Engineering,
Vol 8, No 4 (July/Aug) 2006, p 66-73.
Five-page summary of VRC report.
|
|
|
|
J6:
NIH/NSF Visualization Research
Challenges Report Summary.
Tamara Munzner,
Chris Johnson,
Robert Moorhead,
Hanspeter Pfister,
Penny Rheingans, and
Terry S. Yoo.
IEEE Computer Graphics and Applications, Vol 26, No 2 (March/April) 2006, p 20-24.
Five-page summary of VRC report.
|
|
|
|
B1:
NIH/NSF Visualization Research
Challenges Report.
Chris Johnson,
Robert Moorhead,
Tamara Munzner,
Hanspeter Pfister,
Penny Rheingans, and
Terry S. Yoo.
IEEE Computer Society Press, 2006, ISBN 0-7695-2733-7 (36 page book).
This report, sponsored by the NIH and NSF, is a
followup to the 1987 NSF Visualization report. Our goal
is to evaluate the progress of the maturing field of
visualization, to help focus and direct future research projects, and
to provide guidance on how to apportion national resources.
Our findings and recommendations reflect not only information gathered
from visualization and applications scientists during two
workshops on Visualization Research Challenges but also input
from the larger visualization community.
|
|
|
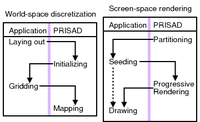
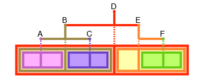
J5:
Partitioned
Rendering Infrastructure for Scalable Accordion Drawing
(Extended Version).
James Slack, Kristian
Hildebrand, and Tamara Munzner .
Information Visualization, 5(2), p. 137-151, 2006.
Longer journal version of PRISAD paper, recommended over the
conference version. The algorithm explanation is clearer and
more detailed.
|
|
|
C11:
Partitioned
Rendering Infrastructure for Scalable Accordion Drawing.
James Slack, Kristian
Hildebrand, and Tamara Munzner .
Proc. IEEE Symposium on Information Visualization (InfoVis) 2005, pp 41--48.
Conference version of PRISAD paper, presenting generic and efficient
infrastructure for accordion drawing with an emphasis on rendering.
|
|
|
C10:
Scalable,
Robust Visualization of Large Trees.
Dale Beermann,
Tamara Munzner, and Greg Humphreys.
Proc. EuroVis 2005, pp 37--44.
Highly scalable accordion drawing for huge trees of 15 million nodes with
leading-edge graphics hardware and 5 million nodes on commodity
platforms.
|
|
|
C9:
SequenceJuxtaposer: Fluid Navigation For Large-Scale Sequence
Comparison In Context.
James Slack, Kristian Hildebrand, Tamara Munzner, and Katherine St. John.
German Conference on Bioinformatics 2004, pp 37-42.
Accordion drawing for comparing gene sequences.
|
|
|
C8:
Steerable, Progressive Multidimensional
Scaling.
Matt Williams and Tamara Munzner.
Proc IEEE Symposium on Information Visualization (InfoVis) 2004, pp
57-64.
Steerable multidimensional scaling with progressive layout.
|
|
|
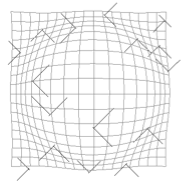
C7:
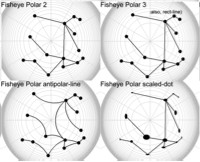
Perceptual Invariance of Nonlinear Focus+Context Transformations.
Keith Lau, Ron Rensink, and Tamara Munzner.
Proc. First Symposium on Applied Perception in Graphics and
Visualization (APGV 04)
2004, pp 65-72.
We quantify the perceptual cost of geometric transformations
for visual search tasks, finding no-cost and low-cost zones
for fisheye transformations.
|
|
|
J4:
TreeJuxtaposer: Scalable Tree Comparison using Focus+Context
with Guaranteed Visibility.
Tamara Munzner, François Guimbretière,
Serdar Tasiran, Li Zhang, and Yunhong Zhou.
SIGGRAPH 2003, pp 453--462.
Visual diff for trees, introducing accordion drawing.
|
|
|
|
G1:
Guest Editor's
Introduction to Special Issue on Information Visualization.
Tamara Munzner.
IEEE Computer Graphics and Applications Special Issue on
Information Visualization, 22(1), Jan/Feb 2002, pp 20-21.
In this short introduction I briefly describe the goals of the
field of information visualization to set the stage for the
four accepted papers in this special issue, for which I was
the guest editor.
|
|
|
J3:
An initial examination of ease of use for 2D and 3D information
visualizations of web content.
Kirsten Risden, Mary P. Czerwinski,
Tamara Munzner, Daniel B. Cook.
International
Journal of Human Computer Studies, Vol. 53, No. 5, November 2000, pp 695-714.
This paper discusses a user study conducted at Microsoft
Research that found a statistically significant improvement in task
time when a novel web browser that included the H3Viewer was compared
to more traditional browsers.
|
|
|
|
T1:
Interactive Visualization of
Large Graphs and Networks.
Tamara Munzner
Ph.D. Dissertation, Stanford University, June 2000.
My dissertation includes a chapter each on the H3, Planet
Multicast, and Constellation projects, with much more analysis than
appeared in any of the original papers.
|
|
|
C5:
Artistic Multiprojection Rendering.
Maneesh Agrawala, Denis Zorin, Tamara
Munzner.
Proceedings of the 11th Eurographics Rendering
Workshop, June 26-28 2000, pp 125-136. These proceedings were
also published as
Rendering Techniques 2000, B. Peroche and H. Rushmeier, eds,
Springer, 2000.
A paper on interactive rendering of scenes where objects can
have different projections, as in the simulaneous multiple viewpoints
of Cubist paintings.
|
|
|
C4:
Constellation: A Visualization Tool For
Linguistic Queries from MindNet.
Tamara Munzner
and François Guimbretière and
George Robertson.
Proceedings of the 1999 IEEE Symposium on Information
Visualization (InfoVis 99),
1999, pp 132-135.
A paper on a 2D interactive system that uses a custom graph
layout algorithm and many perceptual channels to help computational
linguists debug their algorithms for generating and using large
semantic networks.
|
|
|
C4:
Drawing Large Graphs with H3Viewer and Site Manager.
Tamara Munzner.
Proceedings of Graph Drawing '98, Montreal, Canada, August 1998, Lecture Notes in Computer
Science 1547, pp. 384-393, Springer-Verlag.
A paper which presents the H3Viewer guaranteed frame rate
drawing algorithm, along with a brief review of the H3 layout
algorithm for context. Very large graphs can be navigated at a
constant frame rate, as long as the entire graph can fit into main
memory. The viewer is custom OpenGL/C++ code. My implementation of
the algorithm discussed here was shipped with the Site Manager 1.1
software from SGI. The source is available for free
noncommercial use.
|
|
|
J2:
Exploring Large Graphs in 3D Hyperbolic
Space.
Tamara Munzner.
IEEE Computer Graphics and Applications, Vol. 18, No. 4,
pp 18-23, July/August 1998.
An article which briefly reviews the H3 layout and H3Viewer
drawing algorithms. The main new material here is a discussion about
possible tasks for graph drawing beyond the global overview
problem.
|
|
|
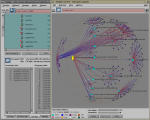
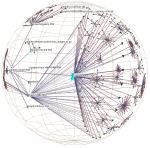
C3:
H3: Laying Out Large Directed Graphs in 3D Hyperbolic Space.
Tamara Munzner.
Proceedings of the 1997 IEEE Symposium on Information
Visualization (InfoVis 97),
October 20-21 1997, Phoenix, AZ, pp 2-10, 1997.
A paper that presents a much improved layout algorithm that
exploits some of the properties of 3D hyperbolic space to achieve
reasonable information density. The viewer is a highly modified
version of Geomview, which supports manual subtree collapse and
expansion. My implementation of the algorithm discussed here was shipped
with the Site Manager 1.0 software from SGI.
|
|
|
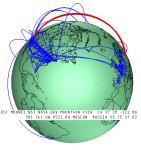
C2:
Visualizing the Global Topology of the MBone.
Tamara Munzner and Eric Hoffman and
K. Claffy and Bill Fenner.
Proceedings of the 1996 IEEE Symposium on Information
Visualization (InfoVis 96),
October 28-29 1996, San Francisco, CA, pp 85-92, 1996.
A case study describing the Planet Multicast project: an
interactive 3D geographic
visualization of the Internet's multicast backbone, where tunnels
are shown as arcs on a globe.
|
|
|
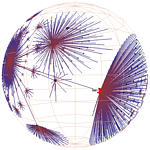
C1:
Visualizing the Structure of the World Wide Web in 3D Hyperbolic Space.
Tamara Munzner and
Paul Burchard.
Proceedings of the Virtual Reality Modelling Language (VRML 95)
(San Diego, California, December 14-15, 1995), special issue of
Computer Graphics, pp 33-38, ACM SIGGRAPH, New York, 1995.
The first of my hyperbolic papers. The layout algorithm is the
the most straightforward extension of cone trees to 3D hyperbolic
space. The viewer is Geomview/WebOOGL. The system allows neither
manual nor automatic collapsing of the graph, so scalability is
extremely limited.
|
|
|
J1:
Interactive Methods for Visualizable Geometry.
Andrew J. Hanson and
Tamara Munzner and
George Francis.
IEEE Computer, Vol. 27, No. 4, pp 73-83, July 1994.
A survey article about interactive mathematical
visualization, includes many pictures.
|
|