Euros für Ärzte
Drug Payment Reports Analysis
Overview
In this tutorial, we will combine twelve tables of pharmaceutical payment records into two consolidated datasets — one for drug study notifications (meldungen) and one for completions (abschl). We will resolve a schema mismatch that appears in the 2013–2014 tables, add a derived year column to each stack, and finish by aligning the two stacks for export.
Note that the source data is in German, but the workflow steps are in English and are reproducible without knowledge of German.
This workflow is based on a CORRECTIV investigation: “Euros für Ärzte”.
Data Sources
Raw tables for this workflow include Anwendungsbeobachtungen (AWB) data, known in English as post-marketing surveillance studies or non-interventional studies, which are scientific studies conducted on human subjects after a pharmaceutical drug or medical device has received marketing authorization. Data was exported from two Excel files:
AWB KBV Meldungen und Abschlusse 2004 - 2011.xlsx— annual AWB notification and completion records for 2004–2011.AWB KBV Meldungen und Abschlusse 2012 - 2014.xlsx— annual AWB notification and completion records for 2012–2014.
The goal of this workflow is to combine the annual tables in these two Excel files into a single consolidated table for analysis.
Workflow Steps
Pre-processing
- Open both Excel files in a spreadsheet application, e.g. Microsoft Excel or Google Sheets.
- Export individual year sheets for 2009–2014 only from both Excel files to separate CSV files, if the sheet has the word “meldungen” in the name, include it in the filename, likewise if the sheet has the string “Abschl” in the name, include it in the filename. This will result in TK CSV files, which are bundled in this tutorials data package:
meldungen-2009.csvmeldungen-2010.csvmeldungen-2011.csvmeldungen-2012.csvmeldungen-2013.csvmeldungen-2014.csvabschl-2009.csvabschl-2010.csvabschl-2011.csvabschl-2012.csvabschl-2013.csvabschl-2014.csv
OpenRoundup Steps
- Import all
*.csvfiles into OpenRoundup. - Create a stack operation with all the
meldungen-*tables.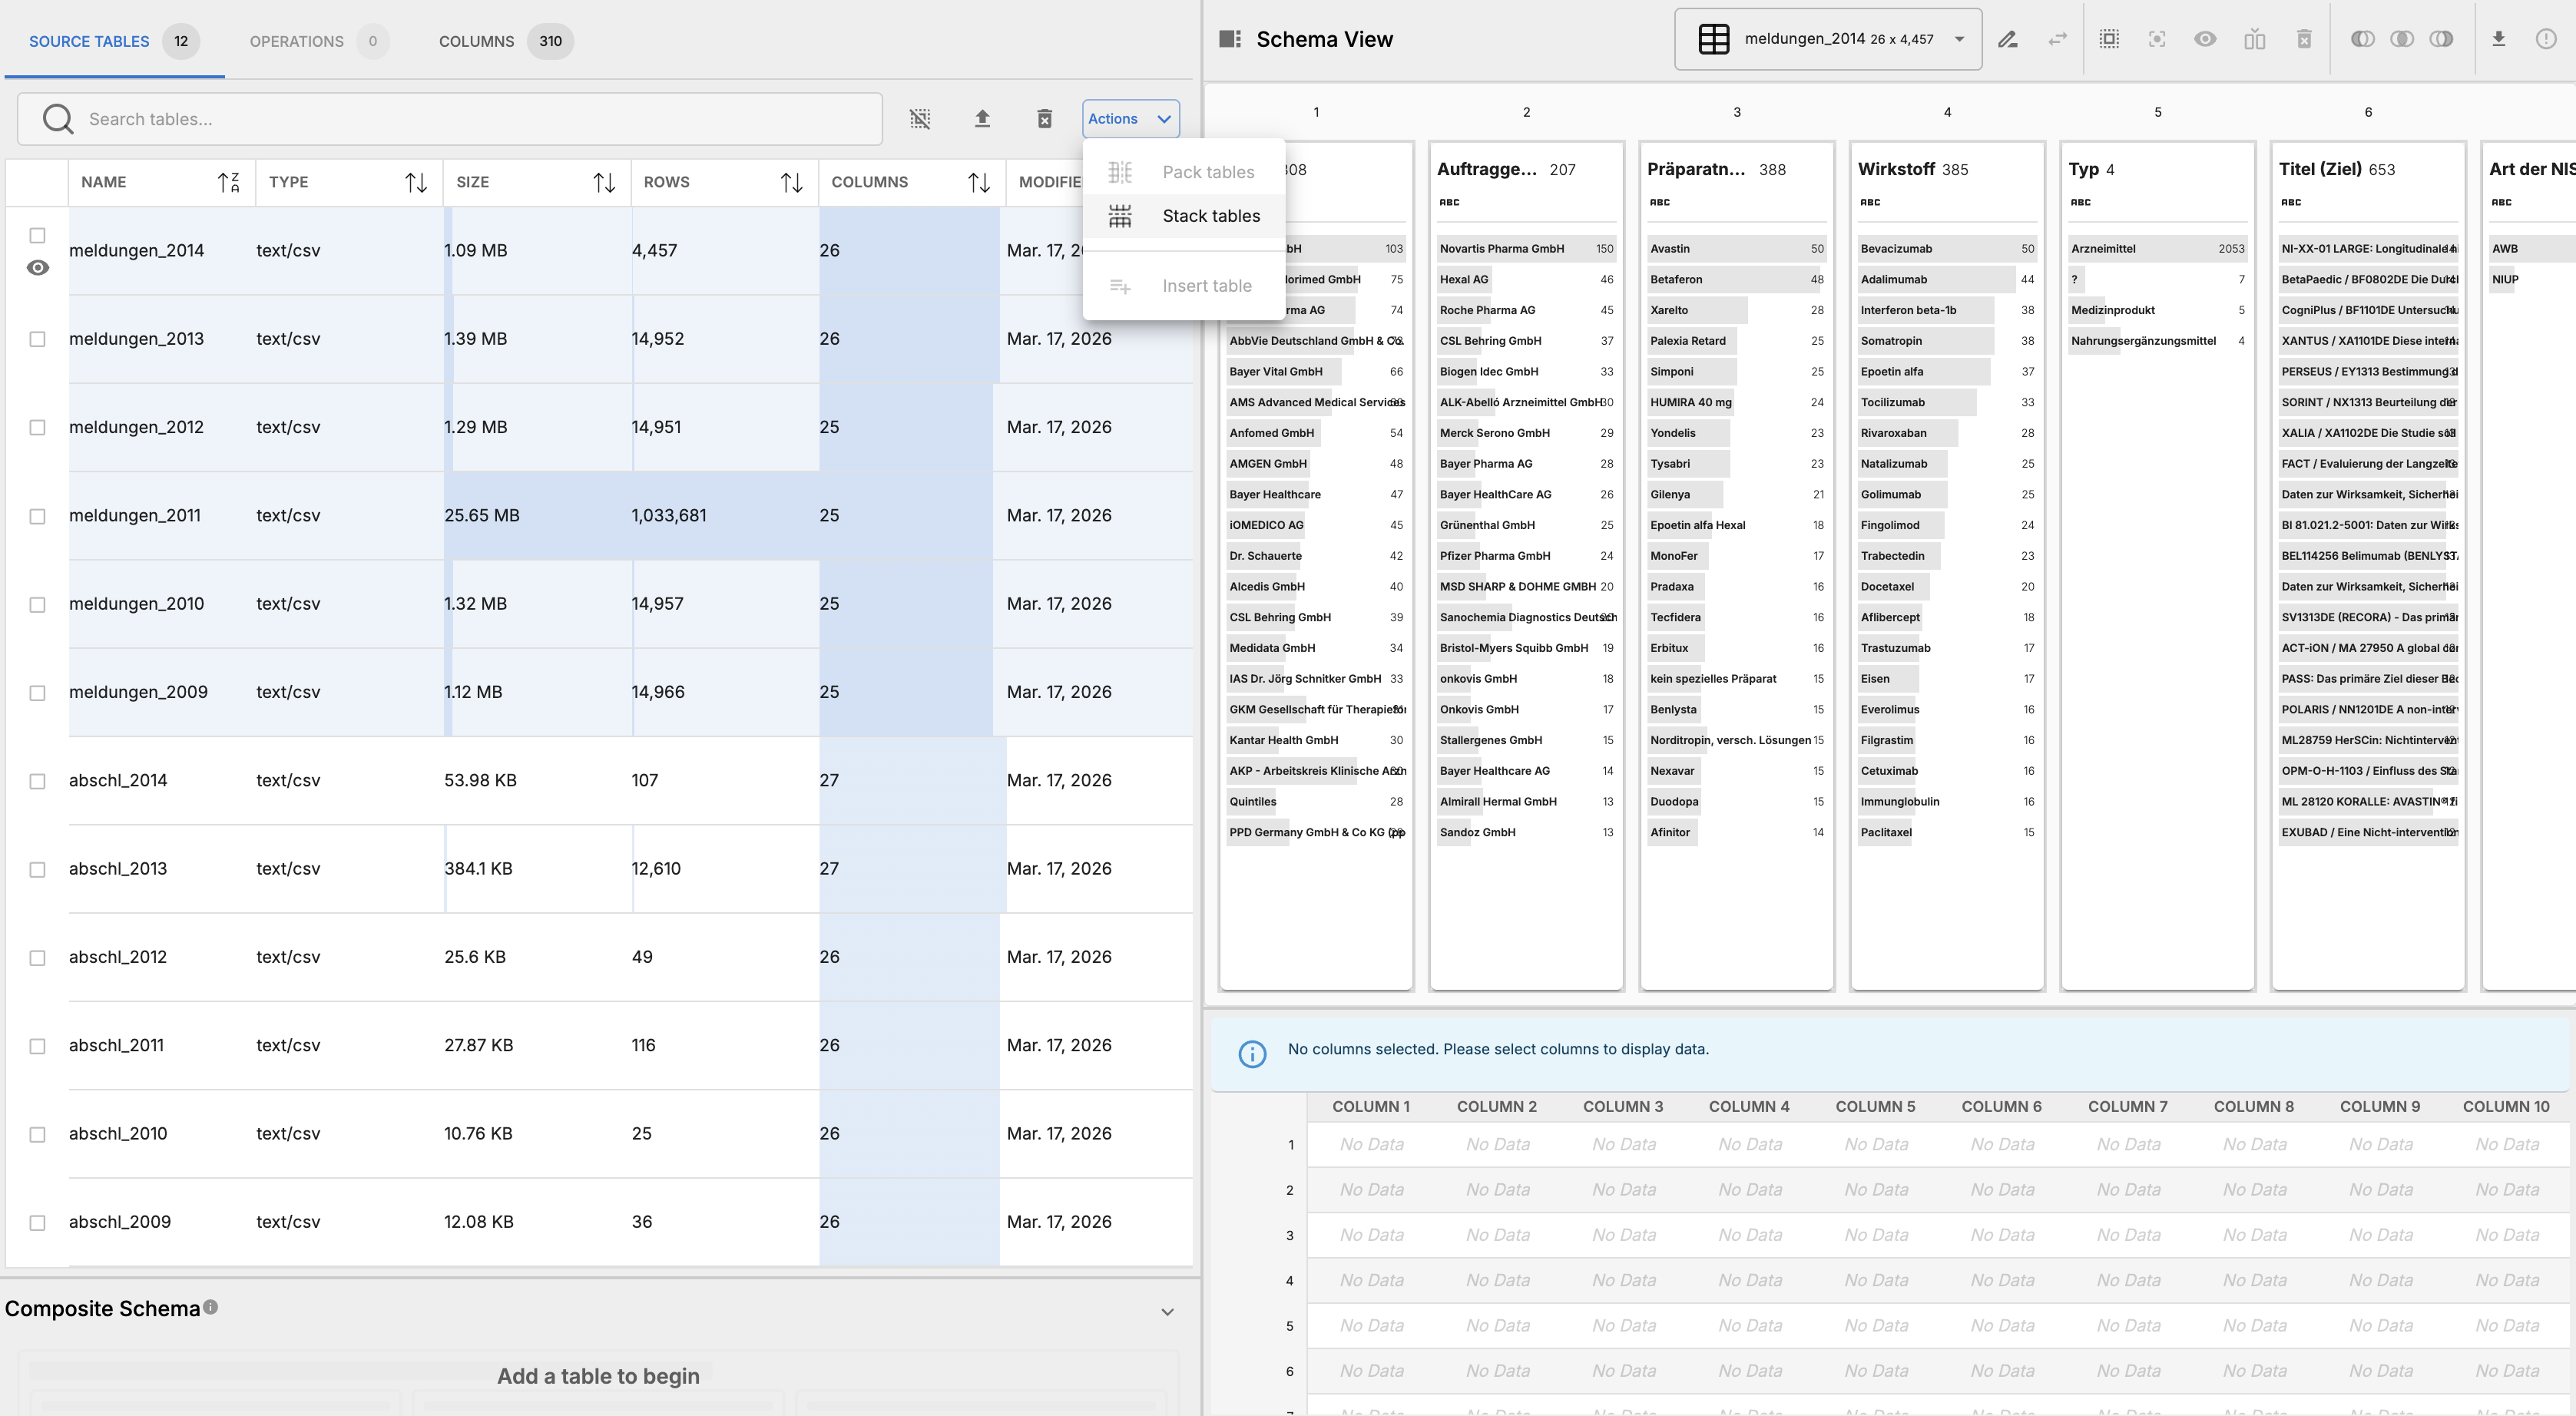
- Inspent the results in the schema view, an alert tells us that there is a schematic discrepancy in the number of table columns in this operation. Scroll to the 26th column to see that not all schemas are aligned, which is a requirement for stack operations.

- Inspect the schema view further, you’ll find that at index 7 is where the schema discrepancies start. Years 2013 and 2014 have an extra column at index 7, “Art der NIS.”

- Delete these columns to align the schemas across all tables.

- Materialize the stack operation and inspect results.

- Rename this operaiton “meldungen” to reflect the fact that it contains all the “meldungen” tables stacked together.

- Select all the columns in the first index of the Meldungen operation and insert a new column to the left from the schema toolbar.

- From the dialog, title the new columns “year” and select the table name radio option. This will fill the new column with the name of the source table for each row, which contains the year information we need to perform time-based analysis on this data.

- Now re-materialize the stack operation and inspect results. We can see that the new “year” column has been successfully added and filled with the correct year information for each row.

- Stack the “abschl” tables together in a new stack operation.

- Likewise, delete columns titled “Art de NIS” in tables
abschl_2013andabschl_2014
- Select all the columns from the “abschl” tables in the first index and insert a new column to the left, just like we did for the “meldungen” stack operation. Title this column “year” and fill it with the table name as well. Materialize and inspect results to confirm that the year column has been added correctly.

- Insert a null column to the right of the last column in the “meldungen” stack operation and title it “Aufwandsentschädigung gesamt in €,” which means “total reimbursement of expenses in euros.” Set this value to NULL.
- Materialize the combined stack operation and inspect the results.

- Export the file as .CSV for further analysis. It will take approximately 30 seconds to export, as there are more than 1,000,000 rows in the materialized table. The final output file is 48MB.