Composite Schema View
The Composite Schema provides a highest-level overview of the structure of all combined data, recursively showing how all incorporated source tables are combined by all defined operations. This visualization is updated in real-time as you perform operations on your data.
 The Composite Schema view, taken from the Crime & Heat tutorial.
The Composite Schema is designed to display only operations and their child tables/operations. It is composed of table blocks that represent the source tables for all operations. Each table block is equally partitioned by its column count.
Layout
The Composite Schema is essentially a treemap visualization using a layout algorithm that preserves the order and size of tables based on column and row counts. It is organized in a hierarchical layout that reflects the structure of operations and their source tables. The top-level blocks represent the root operations, and nested blocks represent child operations and their source tables. This layout allows users to easily understand the relationships between different operations and how their source tables are being combined together in the table that will eventually be exported by OpenRoundup.
Table blocks
Each table block in the Composite Schema view represents a source table for an operation. The table is color-coded by its direct parent operation using the Tableau10 color palette. When the number of operations exceeds the number of colors available in the color palette, the colors will be reused.
Table blocks are partitioned by their column count. For example, if a table has 4 columns, its block will be partitioned into 4 equal sections, each representing a column in the table. Interacting with columns in the Schema View will also update the style of the corresponding column in the Composite Schema view, which can help users understand how their source tables are being combined together in their operations.
Table blocks within Stack operations
When tables are combined together in a Stack operation, table blocks will be juxtaposed vertically within their parent operation block. This will naturally allign the partition lines within a table block that represent columns. This allows you to easily see if tables are incongruent in a Stack operation.
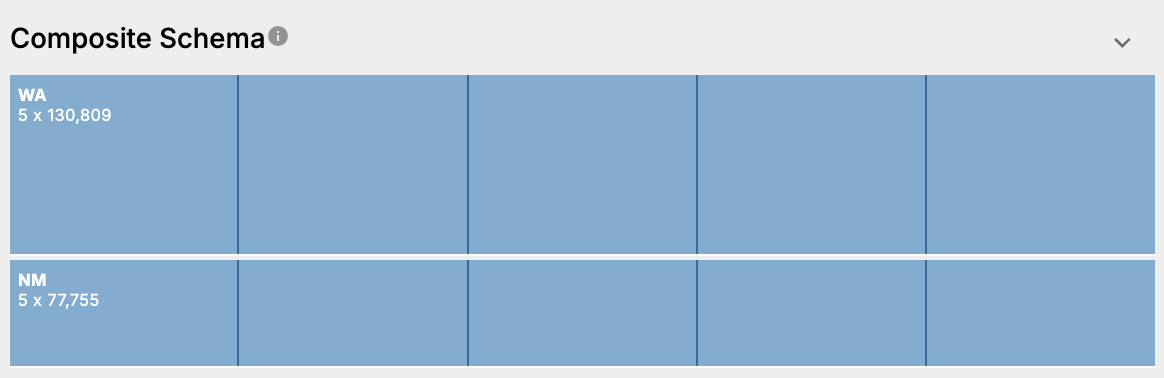 Two tables being stacked together in the Composite Schema view, taken from the Baby Name Politics tutorial.
When there are null columns in a table, due to mismatched columns in a stack operation, the null columns will be displayed at the end of the table block. This allows users to easily identify which columns are null and understand how their source tables are being combined together in their operations. We use a dashed, cross-hatch pattern to visually indicate null columns.
 A table block with 4 columns, where the last two columns are null columns due to mismatched columns in a stack operation.
Table blocks within a Pack operation
When tables are combined together in a Pack operation, the table blocks of the source tables will be juxtaposed horizontally within their parent operation block. This allows users to easily see how tables are being combined together in a Pack operation and understand the structure of their combined data.
Proportional and responsive size
Table blocks in the Composite Schema view are also sized proportionally to the number of rows in their corresponding source tables relative to the total number of rows in their immediate parent operation. Each table block in the Composite Schema view is responsive to the size of the view pane. If the view pane is large enough, table blocks will display the name of the source table and its dimensions. When the table block is too small, it will hide this information.
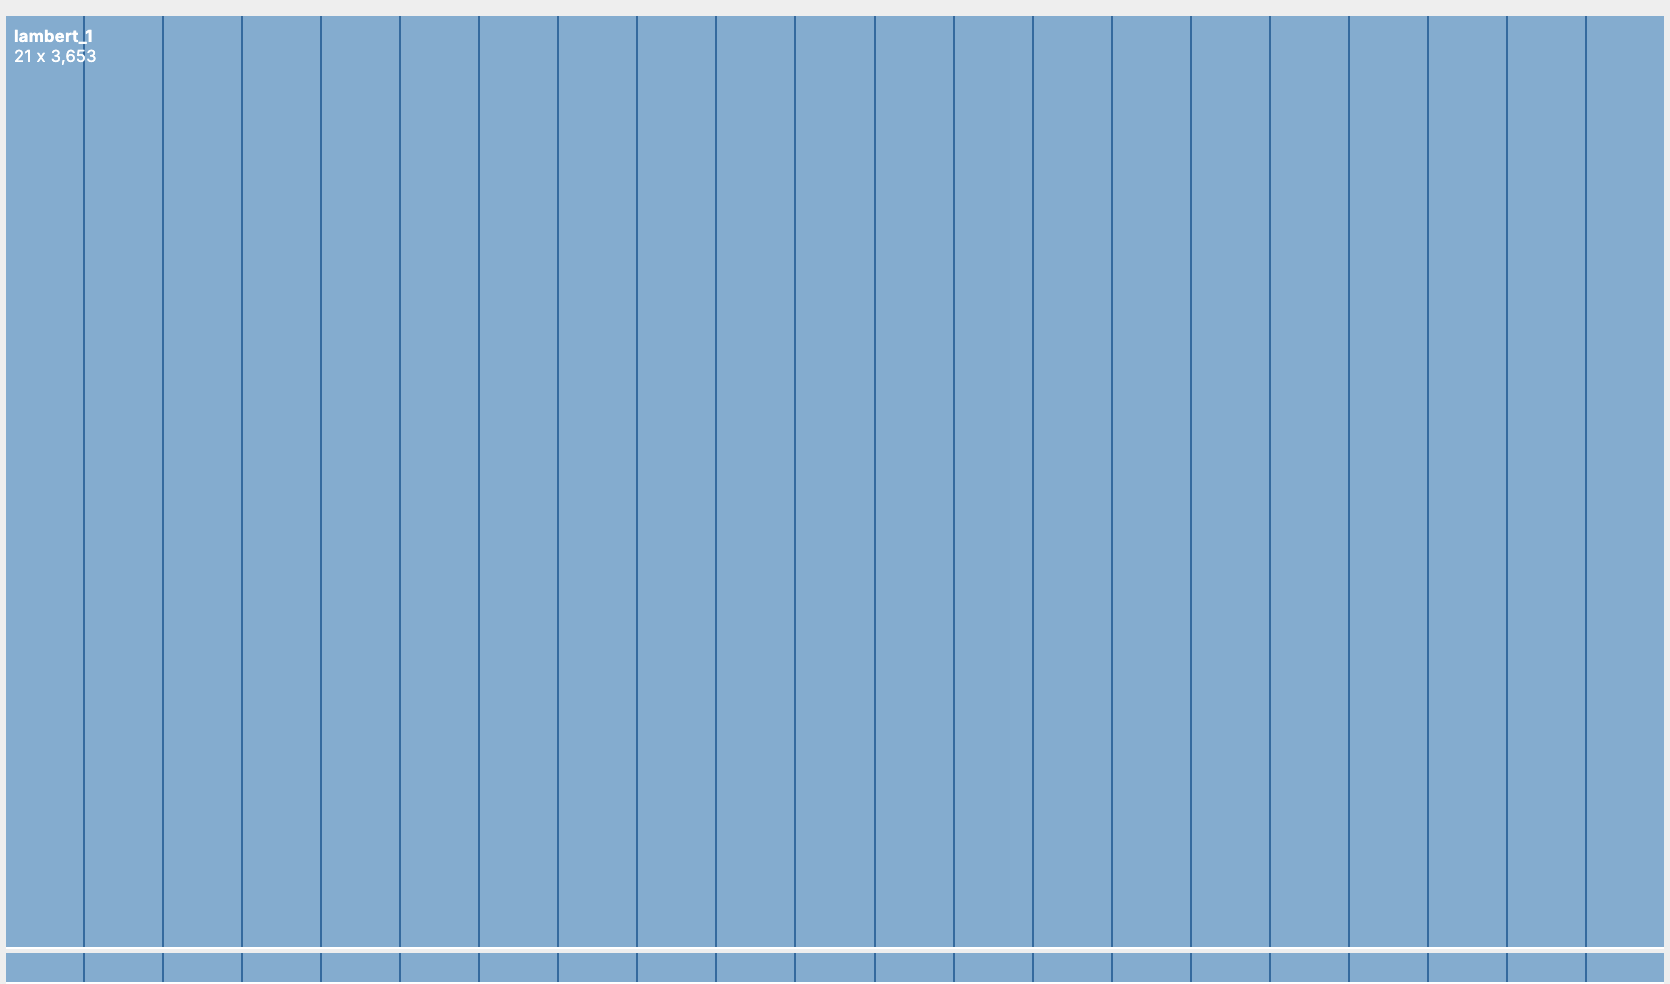 Table blocks of the two
 lambert tables in a stack operation from the Crime & Heat tutorial. lambert_1 has 3,653 rows and lambert_2 has only 120 rows. Therefore, the name and dimensions of lambert_2 are hidden due to its small size.
For example, if one table has 1,000 rows and another table has 100 rows, the table block for the first table will take up 90% of the height, leaving the other 10% to the other table. This allows users to quickly understand the relative size of their source tables and how they are being combined together in their operations.
Linked interactions with the Schema View
Hovering and selecting columns in the Schema View will also update the style of the corresponding column in the Composite Schema view, which can help users understand how their source tables are being combined together in their operations.
Examples
Below are some examples of the Composite Schema View taken at the end of different tutorials, showing how the Composite Schema view can be used to understand the structure of combined data in different workflows.
Crime & Heat
In Crime & Heat, we stack together two tables of weather data (lambert_1 and lambert_2), resolving different schemas, and pack together the resulting table with a third table of crime data (violent-crimes).

Baby Name Politics
In Baby Name Politics, we iteratively stack together 51 tables of baby name data from 50 U.S. states and the District of Columbia, resolving different schemas before packing together the resulting table with a table of state-level election results from the 2016 U.S. presidential election.
