Schema View
The Schema View displays the schema of the currently focused object, which can be a table or an operation.

The schema view when a table is the focused object, taken from lambert_2 in the Crime & Heat tutorial.
The schema view is a central part of the OpenRoundup interface, as it provides users with a visual representation of the structure of their data and allows them to perform various actions on their tables and operations, such as selecting columns, hiding columns, focusing on columns, and more. It is comprised of two main components: the schema toolbar and the column cards.
Schema toolbar
The schema toolbar is located at the top of the schema view and provides actions that can be performed on the schema as a whole.

The Schema View toolbar provides actions that can be performed on the schema as a whole.
It is available when the focused object is a table or an operation. However, different actions will be available depending on the context of the schema view. For example, the toggle muttons for matched rows is only available when the focused object is a pack operation.
The schema toolbar provides the following actions, ordered from left to right:
- Focus object (all): This combo box allows the user to select the focused object from a list of all available tables and operations in OpenRoundup.
- Rename object (all): This button allows the user to rename the focused object. This action will open a modal dialog text input field where the user can enter a new name for the focused object. Once the user submits the new name, the focused object will be renamed and the schema will be updated accordingly. Technical note: names are completely arbitrary in OpenRoundup and have no effect on identifiers used in the persistence layer. OpenRoundup maintains both a user-defined name (
object.name), a unique identifier for the object in the application (object.id), and a unique identifier for the object in the persistence layer (object.databaseName). - Reorder tables (operations-only): This button allows the user to reorder the source tables for an operation. This action will open a dialog where the user can drag and drop the source tables to reorder them. The order of the source tables can affect the resulting table of an operation, so this action allows users to control the order of their source tables.
- Select/Deselect columns (all): This button allows the user to select or deselect all columns in the schema. This action will toggle the selection state of all columns in the schema, which can be useful for performing bulk actions on multiple columns at once from buttons in the schema toolbar.
- Focus columns (all): This button allows the user to focus on selected columns. This action will open the Column Focus View.
- Hide columns (all): This button allows the user to hide selected columns. This action will remove the selected columns from the schema and update the resulting table accordingly. This action is reversible, so a “Show hidden columns” button will appear in the schema toolbar that allows users to show hidden columns again. Hidden columns are not deleted from the schema, they are just hidden from view.
- Insert column left/right (all): This button allows the user to insert a new column to the left or right of the selected column(s). This action will open a dialog where the user can specify the new column name as well as its value, including
NULLvalue. This action is useful for adding new columns to the schema that may be derived from existing columns or for adding new columns that may be used in future operations. - Delete columns (all): This button allows the user to delete selected columns. This action will remove the selected columns from the schema and update the resulting table accordingly. This action is irreversible, so a confirmation dialog will be displayed before the columns are deleted.
- Select row group (pack operations-only): These toggle buttons allows the user to toggle between selecting matched rows, left-hand table unmatched rows or right-hand table unmatched rows in a pack operation. This action will update the resulting table of the pack operation accordingly, which allows users to easily compare the results of different row selections for their pack operations.
- Export (all): This button allows the user to export the table of the currently focused table or materialized operation. This action will open a dialog where the user can specify the file format for the export (CSV, JSON, etc.) as well as other options such as the file name and the presence of a header row in the exported file. Once the user submits the export form, the table will be exported in the specified format and downloaded to the user’s computer.
- Alerts (all): This button allows the user to view any alerts that are associated with the currently focused object. It displays a dropdown menu with a list of all alerts for the current object, which can include warnings about potentiall issues with the data.
Column Cards
Column cards are the main way to displaying column metadata in the OpenRoundup interface. They are used only in the Schema View and display column information for Stack operations and tables.

Column cards display the number of unique values in a column, which is a useful metric for understanding the distribution of values in a column and can help identify potential issues with the data, such as high cardinality or low variability.
A column card displays:
- The column name, e.g. “NAME” (top left, above the line)
- The rounded number of unique values in the column, e.g. “6K+” (top right, above the line)
- The column type, e.g. “ABC” (top right, left of the unique values count)
- The value counts visualization: a bar chart visualization the count of the top unique values in that column (below the line).
Responsive display of column cards
Column cards are also responsive by height. If there are many tables in a stack operation or if the schema window is compressed when a table is focused, the column cards will shrink in height and the value counts visualization will be hidden to allow more columns to be visible at once.
Expanded  Reduced
  Compressed
 These three state represent different levels of detail for the column card:
- Expanded state: the column card displays the value counts visualization, which display the top unique values and their absolute frequency within the column.
- Reduced state: the column card hides the value counts visualization and instead displays value chips for the top unique values in that column. This view still communicates the top values in the column, but hides their exact frequency.
- Compressed state: the column card hides both the value counts visualization and the value chips to allow more columns to be visible at once. In this most compact state, only the column metadata is visible: name, unique value count, and column type.
Design rationale for column cards
In the design of OpenRoundup, we strongly believe that the values in the column are the strongest signals for identifying the semantic of a column, e.g. if the column is a date, a location, a name, etc., Other aspects of metadata such as the column name and column type are also important signals, but can be easily mis-leading. For example, a column named “DATE” may not actually contain date values, and a column with a type of “string” could contain location names. For this reason, the value counts visualization is the most prominent feature of the column card and is prioritized in the expanded view of the column card. The unique value count and column type are also important signals for understanding the semantics of a column, but they are displayed in a smaller font size and are less prominent than the value counts visualization. In the reduced and compressed views of the column card, the value counts visualization is hidden to allow more columns to be visible at once, but the unique value count and column type are still visible to provide some information about the distribution of values in the column and its data type.
Column card interactions
Column cards also support interactions that support the user in various table consolidation sub-tasks.
Actions context menu
When hovering over a column card, an actions menu icon will appear in the top right corner of the card, replacing the unique value count and column type icon.

Clicking this icon will open a context menu with actions that can be performed on that column:
- Rename column: allows the user to rename the column. This action will open a text input field where the user can enter a new name for the column. Once the user submits the new name, the column will be renamed and the schema will be updated accordingly. Technical note: names are completely arbitrary in OpenRoundup and have no effect on identifiers used in the persistence layer. OpenRoundup maintains both a user-defined name (
column.name), a unique identifier for the object in the application (column.id), and a unique identifier for the object in the persistence layer (column.databaseName). - Delete column: allows the user to delete the column. This action will remove the column from the schema and update the resulting table accordingly. This action is irreversible, so a confirmation dialog will be displayed before the column is deleted.
- Focus column: allows the user to focus on a column. This action will open the Column Focus View for that column, which provides more detailed information about the column and its values.
- Insert column left/right: allows the user to insert a new column to the left or right of the current column. This action will open a dialog where the user can specify the new column name as well as its value, including
NULLvalue.
These dropdown menu items trigger the same action as selecting one column and clicking the “Focus columns” button in the schema toolbar.
Selecting
Users can select a column by clicking on a column card. Selected columns are displayed in the Table Rows view for tables and materialized operations. It also allows users to perform bulk actions on multiple columns at once from buttons in the schema toolbar.

The column card on the left is selected, which is indicated by the blue border around the card. When a column card is selected, the column will also be highlighted in the Table Rows view, which allows users to easily identify which column they are working with when performing actions that involve both the schema and the table rows, such as filtering or sorting.
Selecting a column in the schema view will also update the style of the corresponding column in the Composite Schema View, which is a view that displays the combined schema of all source tables for an operation. This allows you to easily identify which columns in the Composite Schema correspond to the column they have selected in the schema view, which can be helpful for understanding how their source tables are being combined together in their operations.
Dragging
A single selected column can also be repositioned within a table by dragging and dropping the column card to a new location. Dropping the column card over another column card will swap the position of the two columns in the schema.
Displaying schemas of different objects
The schema view is designed to display more detail metadata about tables and their columns, when the focused object is a table. When the focused object is an operation, the schema view displays column information for only the immediate source tables of that operation. If an operation has another operation as a child table, the schema view will not display the columns of that child operation’s source tables.
This design choice was made to balance the need for displaying detailed column information with the need to avoid overwhelming users with too much information at once, which can be a common issue when working with complex data transformations that involve many tables and operations. By only displaying column information for the immediate source tables of an operation, users can still access important metadata about their data without being overwhelmed by the full complexity of their data transformations.
A focused table
When the focused object is a table, the schema view displays a horizontal layout of cards that represent columns in that table.
The schema view when a table is the focused object, taken from the Crime & Heat tutorial.
A focused operation
The schema view for all operations is designed to horizontally and vertically partition the output table of that operation in a way that’s useful for users to understand how that operation is transforming its source table.
A focused stack operation
When the focused object is a stack operation, the schema view displays a horizontal layout of column cards for each source table in that stack operation, which allows users to compare the schemas of their source tables and make decisions about how to consolidate them together.
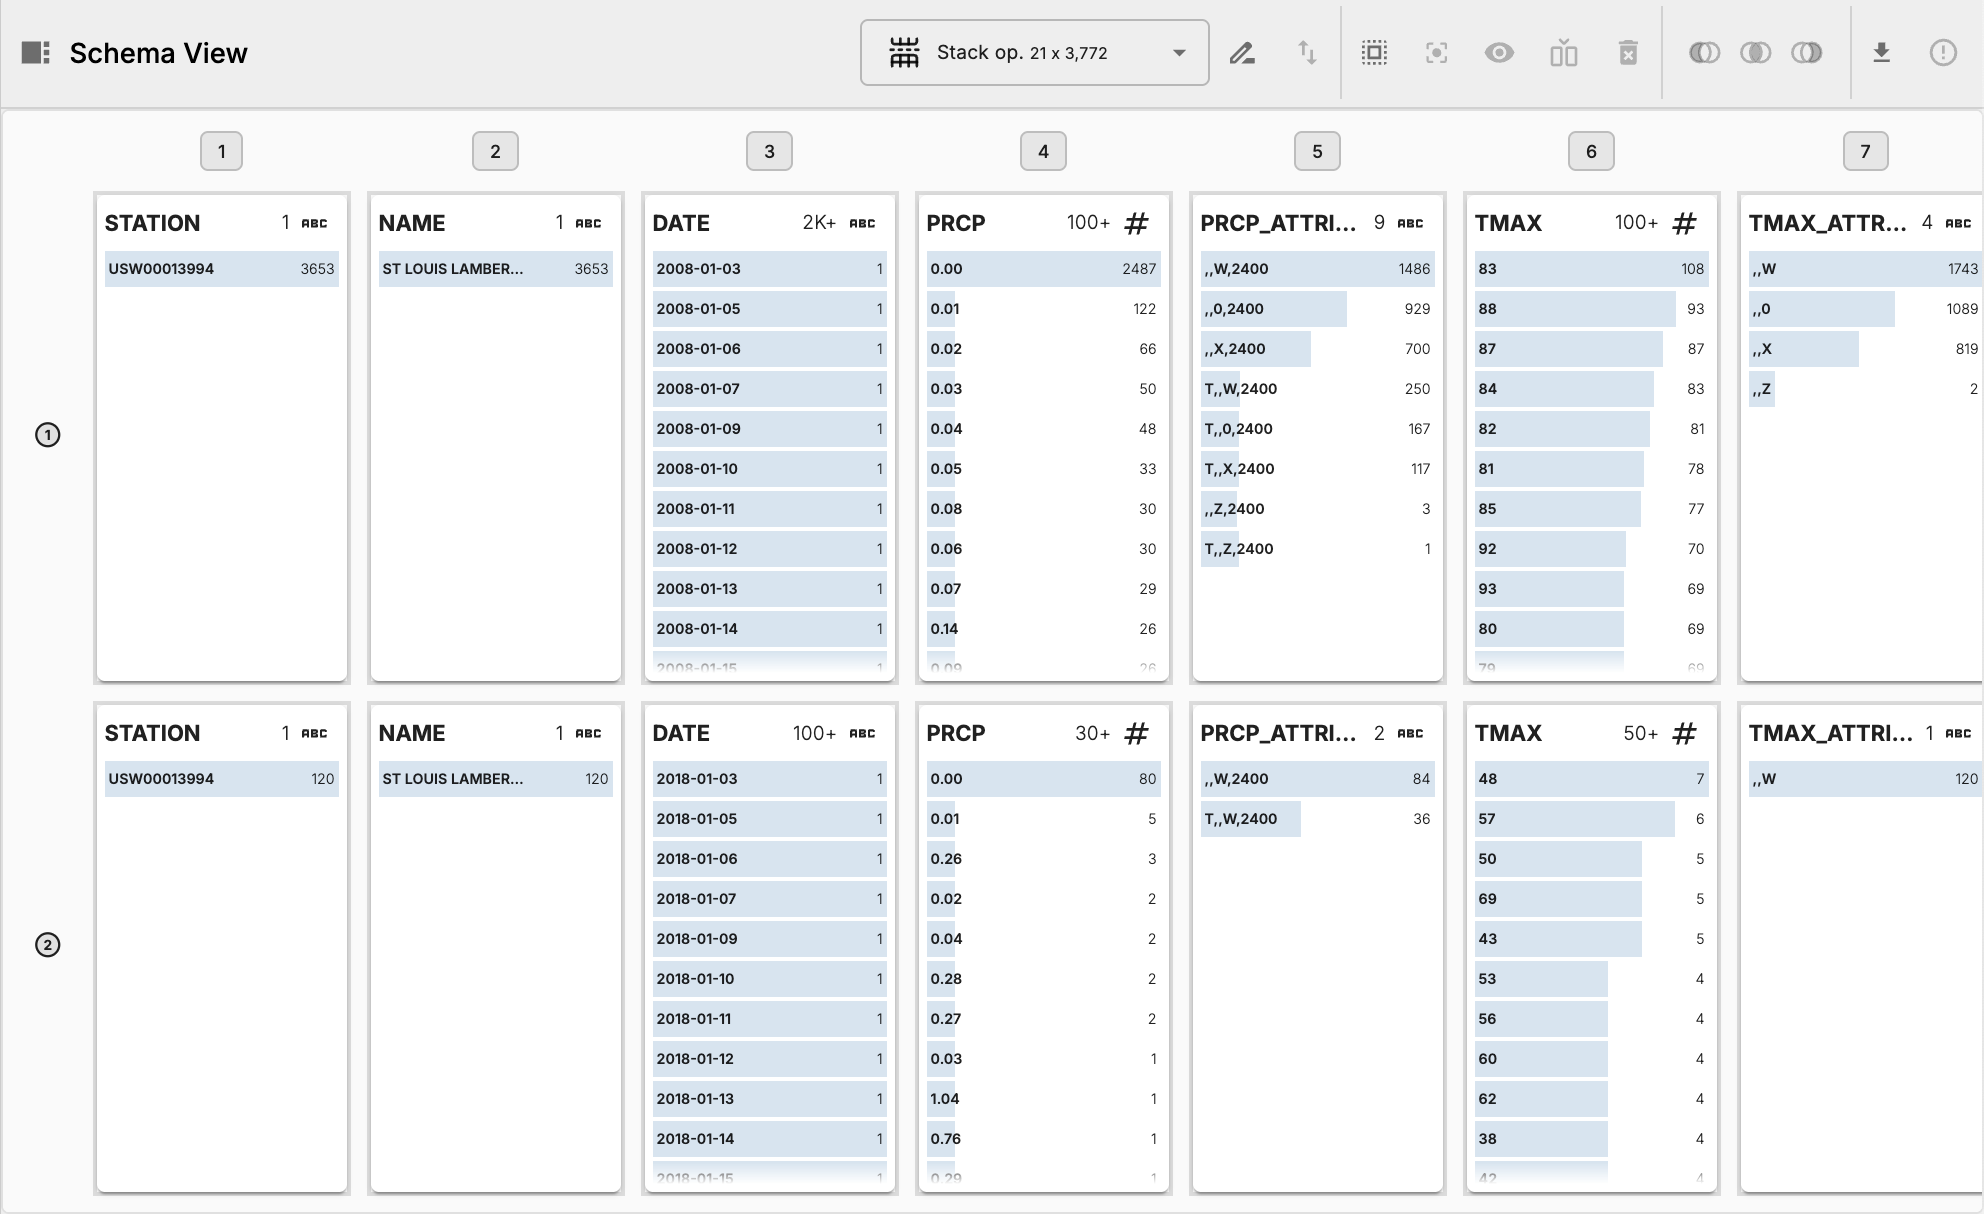
The schema view when a stack operation is the focused object, taken from the Crime & Heat tutorial.
This design partitions the schema vertically by source table, which can be rearranged by the user. This vertical order also specifies the order of the output table’s rows. The schema is also partitioned horizontally by column index within the source table. A stack operation can have more than one child table, so stack operation schema take advantange of the responsive design of column cards.
A focused pack operation
When the focused object is a pack operation, the schema view displays a $(m_1+m_2) \times 3$ grid of blocks, where $m_1$ is the number of columns in the left-hand table and $m_2$ is the number of columns in the right-hand table for that pack operation. This grid layout allows users to easily compare the schemas of the two source tables in their pack operation and understand how they are being combined together. Each of these blocks belong to their the left-hand or right-hand table. In addition to explicit labels, we also color-code blocks from the left-hand and right-hand tables with different colors, as well as visually separate them with a vertical dividing line between the two tables (following Gestalt principles of proximity and similarity, respectively.

The schema view when a pack operation is the focused object, taken from the Crime & Heat tutorial.
As in stack operation schemas, the pack operation schema is also partitioned horizontally by column. However, instead of partitioning the schema vertically by source table, the pack operation schema is partitioned vertically by row match status, which is determined by whether rows from the left-hand and right-hand tables are matched together in the output table of the pack operation.
- The top section of the pack operation schema displays columns for matched rows, which are rows that have been matched together from the left-hand and right-hand tables based on their values in the join key columns.
- The middle section of the pack operation schema displays columns for left-hand table unmatched rows, which are rows from the left-hand table that do not have a match in the right-hand table based on their values in the join key columns.
- The bottom section of the pack operation schema displays columns for right-hand table unmatched rows, which are rows from the right-hand table that do not have a match in the left-hand table based on their values in the join key columns.
We also use venn diagram icons in the row margin to visually indicate the match status of rows in each section of the pack operation schema, which can help users quickly understand the structure of their data even if the concept of set difference does not perfectly align with relations.