Which visualization library or tool
should I use for my project?
The landscape of visualization tools, including libraries and frameworks, has evolved considerably and you can (or need to) choose between a wide range of options. We selected five prominent examples of general-purpose tools:
- D3 (JavaScript)
- Vega-lite (platform-independent but usually JavaScript)
- Altair (Python)
- ggplot2 (R)
- Tableau (Software)
TL;DR If you just want to learn more about a specific tool, you can click on one of the links or use the menu on the left.
We actually want you to think more broadly about the design space and be able to evaluate various types of tools. This article describes three perspectives that should help you decide which option is best for your needs.
- API/tool design: Are you already familiar with certain programming languages or frameworks? Are there any back-end or system dependencies?
- Level of abstraction: How much do you need to customize when you map data values to graphical marks and encoding channels? (design flexibility/expressivity)
- Target users and supported tasks
These three perspectives are not isolated and should be assessed holistically. You may also need to consider other factors, such as rendering technology, performance, licensing, and support.
1. API/tool design
- Framework-agnostic (e.g., plain JavaScript): Many visualization libraries do not depend on any framework. D3 is the most popular example and offers a plain JavaScript API, ggplot2 is a widely used visualization package in R, and Altair is being increasingly used to create visualizations in Python. Framework-agnostic libraries typically use method chaining and function composition to specify a visualization. The advantage of those libraries is flexibility. The code, however, tends to be more imperative (closer to machine instructions) than declarative (closer to the output that humans want to see).
- Declarative JSON format: Some visualization libraries, such as Vega-lite, describe visualizations in a single JSON configuration. This format is more concise, easy to read, can be easily stored as text files or in databases, and may be even automatically generated by other tools (e.g, Voyager or data.world Chart Builder). With the JSON constraint, they cannot accept any function or custom object as part of the arguments, avoiding imperative instructions.
-
Framework-specific: Other libraries strongly depend on frameworks—such as React, Angular, Vue, or Ember in the JavaScript world—and embrace their syntax. For example, using a React-based library in a React web application project will be more natural and provides better overall code consistency and optimization opportunities compared to adding raw blocks of D3. The drawback is they require prerequisite knowledge about the framework and are only appropriate to be used in a project where the main framework is also used.
Examples are: react-vis, visx, Semiotic (React); Laue (Vue.js). -
Graphical user interface: Besides programming libraries, you can choose between a variety of graphical user interfaces (GUIs) to generate visualizations. Most likely you have used a spreadsheet program like Excel to create your first chart. In recent years, more software tools emerged that are specifically designed for visualization and data analysis. Tableau is probably the most ubiquitous tool and empowers people of any skill level across many domains to create interactive visualizations and dashboards. The main limitation of these tools is the strong dependence on high-level building blocks/chart templates and its limited expressivity, as we elucidate in the following.
Other examples are: Power BI, Data Illustrator, Charticulator
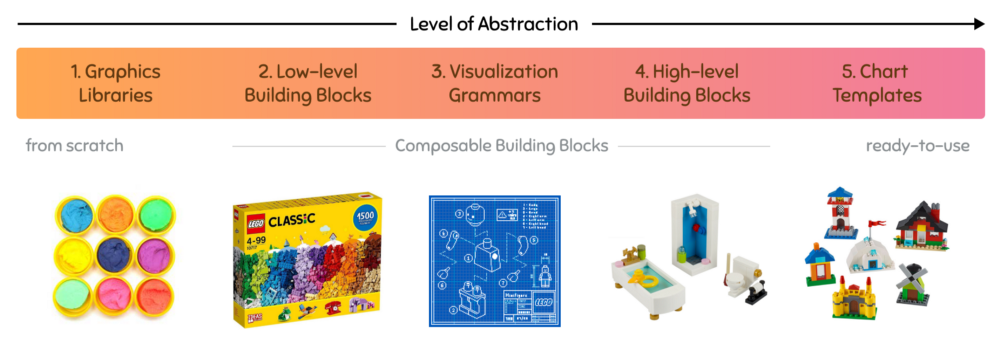
2. Level of abstraction & expressiveness
The level of abstraction is a critical factor for determining whether a tool is suitable for your visualization needs. Do you want to visualize the given data using basic chart types? Do you need to link interactions across multiple views to provide different perspectives? Do you want to design custom graphical marks to emphasize certain data characteristics? Depending on your requirements, you have to go up and down the ladder of abstraction.
These levels map roughly to the effort required to create a visualization and its expressivity. The higher-level libraries usually require fewer lines of code to produce a usable visualization but then there are fewer things you can customize compared to lower levels.
-
Graphic libraries are at the lowest level. You need to draw visual elements directly and perform traditional computer graphics operations (scene graph, shading, etc.). They are the closest to native APIs such as Canvas or WebGL. They have the maximum level of expressivity and in return require the most effort to produce the same visualizations.
Examples are Processing, p5.js, three.js, and luma.gl. - Low-level building blocks: The most notable library in this category is D3 which introduced a suite of low-level components and utilities to ease the creation of visualizations tremendously. These components are, for example, selections, shapes, scales, and axes, that you usually need in visualizations repeatedly and that can be customized and combined flexibly. D3 provides a high degree of expressivity but requires some effort to create even simple charts.
-
Visualization grammars originate from The Grammar of Graphics (Wilkinson, 2005) which offered a new perspective on designing statistical graphics. Instead of referring to charts by their traditional “types” — bar, pie, scatter plot, bubble, etc., — the book calls out their shared structures and introduces the ideas of using these common concepts to describe any chart. Similar to how the grammar of a language, such as English, defines part of speech (noun, verb, etc.) and gives you a structure for combining these parts into a meaningful sentence, the grammar of graphics defines its own parts and provides a structure for combining them to describe an output graphics. This rigid structure is what differentiates them from the low-level building blocks. You have less control and can only use the available marks and encoding channels.
The most famous implementation is ggplot2 for R. However, a limitation of ggplot2 is that it only generates static figures and you need to use additional packages to add interactivity.
Vega-lite employs a declarative visualization grammar that is specified in a JSON format which is platform-independent but mostly used on the web with JavaScript. Vega-lite also supports various interaction techniques. Altair is a declarative visualization library for Python and based on Vega-lite. -
High-level building blocks are pre-assembled components that enable you to quickly show your data but offer less potential for custom visualizations. Data and transformations are often not strictly separated as is the case with low-level libraries and grammars. Scales and axes are usually considered as a single component. These libraries include methods for creating common charts and allow you to combine them as different layers or facets.
Examples are Tableau (GUI), Highcharts, ECharts, Bokeh, and deck.gl. - Chart templates are at the highest level of the abstraction ladder. By using these libraries you just need to load your data and select a chart type (e.g., pie, bar, stacked area, treemap, ...). They require the least effort to produce a usable output if your data is in the correct format. Although you can apply some customizations (i.e. colors and labels), the expressive power of predefined chart templates is relatively low. Examples are RAWGraphs (GUI), Chart.js, Google Charts, nivo.
3. Target users and supported tasks
Don't forget about your target user groups and their intended tasks when you choose a visualization tool. Some tools make it very easy to produce visualizations but the deployment might be more complicated. Do you want to export high-resolution figures? Share a computational notebook (e.g., Jupyter or Observable)? Or maybe embed interactive visualizations in a web application? Think about the medium you want to use to communicate your results.This guide focused mostly on general-purpose visualization tools. If you are dealing with special data formats, such as network or GIS data, you may want to consider specialized solutions.
Source
This guide was adapated from an excellent article by Krist Wongsuphasawat on navigating the world of JavaScript visualization libraries.