Altair is a declarative visualization library for Python, based on the visualization grammar
Vega-lite.
Pros
- Simplicity of the Vega-lite grammar.
- Altair’s pythonic API is comprehensive and may be less confusing than matplotlib.
- Altair charts work out-of-the-box on Jupyter Notebook, JupyterLab, and related notebook environments which is convenient for analyzing machine learning models or creating figures for publications.
- You can export Python-generated visualizations as Vega or Vega-lite specifications.
Cons
- Altair is a high-level visualization library and faces the same limitations as Vega-lite (i.e., less fine-grained control of how data values map to graphical marks).
Resources
Example
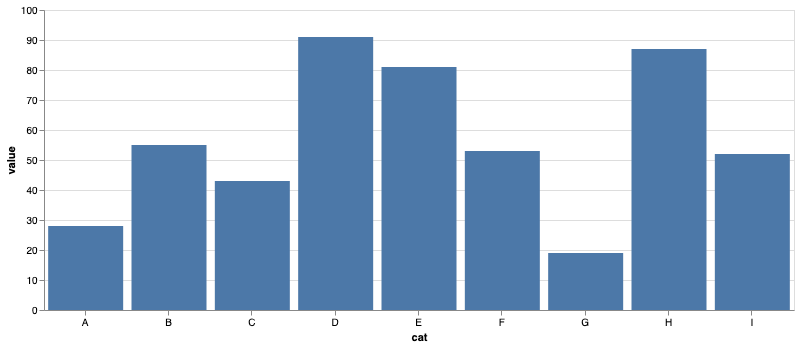
The following Altair specification describes the bar chart below.
import altair as alt

data = alt.Data(values=[
    {"cat": "A", "value": 28}, {"cat": "B", "value": 55}, {"cat": "C", "value": 43},
    {"cat": "D", "value": 91}, {"cat": "E", "value": 81}, {"cat": "F", "value": 53},
    {"cat": "G", "value": 19}, {"cat": "H", "value": 87}, {"cat": "I", "value": 52}
])

alt.Chart(data).mark_bar().encode(
    x=alt.X('cat:O', axis=alt.Axis(labelAngle=0)),
    y='value:Q',
).properties(
    width=750,
    height=300
)
Alternatives
Other visualization libraries for Python are, for example,
matplotlib,
seaborn, and
Plotly.