D3 (JavaScript)
D3.js (Document-Driven-Data) is a powerful JavaScript library for manipulating documents based on data.
D3 allows you to bind arbitrary data to a Document Object Model (DOM), and then apply data-driven transformations to the document. For example, you can use D3 to generate an HTML table from an array of numbers. Or, use the same data to create an interactive SVG bar chart with smooth transitions and interaction.
D3 is not a monolithic framework. Instead, D3 is a suite of many small modules with minimal dependencies that can be loaded independently. These modules provide low-level building blocks, such as selections, scales, shapes, etc. rather than configurable charts. Although D3 is a popular choice for implementing web-based visualizations, the low-level primitives and wide range of functionality can be used for all kinds of things.
Pros
- Great expressive power and flexibility.
- High industry relevance.
- Thousands of examples (D3 blocks, Observable notebooks) and tutorials.
- D3 is modular since version 4; a suite of many small modules that are designed to work together. This makes it more manageable and you can focus on key concepts first before learning supplemental functionality.
- JavaScript is an integral part of the modern web and thus D3 is particularly suitable for implementing interactive web-based visualizations.
- Once you have mastered D3 it becomes relatively easy to pick up Vega-lite or ggplot.
Cons
- Steep learning curve: D3 requires a solid understanding of JavaScript, SVG, DOM, CSS, geometry, data structures, and color perception.
- Low-level primitives necessitate many custom implementation steps and some sense of design and layout to create aesthetic visualizations.
Resources
- Observable notebook: Learn D3 by Mike Bostock
- D3 Graph Gallery
- Observable D3 Gallery
- Dashing D3.js Tutorials
Example
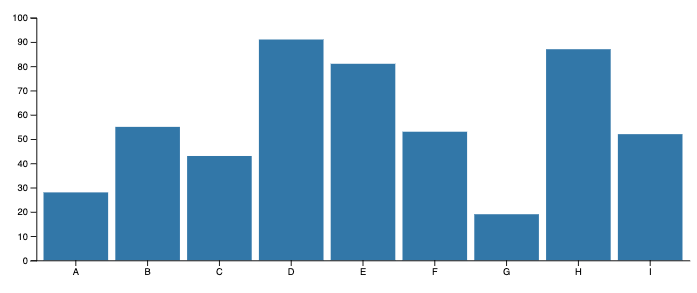
D3 works with selectors (similar to CSS) to manipulate DOM elements. In case of visualizations, these elements are usually SVG but can also be Canvas. The following D3 code leads to the bar chart that is shown below:const data = [
{"cat": "A", "value": 28}, {"cat": "B", "value": 55}, {"cat": "C", "value": 43},
{"cat": "D", "value": 91}, {"cat": "E", "value": 81}, {"cat": "F", "value": 53},
{"cat": "G", "value": 19}, {"cat": "H", "value": 87}, {"cat": "I", "value": 52}
];
const margin = ({top: 20, right: 10, bottom: 20, left: 40}),
height = 300,
width = 750;
const x = d3.scaleBand()
.domain(d3.range(data.length))
.range([margin.left, width - margin.right])
.padding(0.1);
const y = d3.scaleLinear()
.domain([0, d3.max(data, d => d.value)]).nice()
.range([height - margin.bottom, margin.top])
xAxis = g => g
.attr("transform", `translate(0,${height - margin.bottom})`)
.call(d3.axisBottom(x).tickFormat(i => data[i].cat).tickSizeOuter(0));
yAxis = g => g
.attr("transform", `translate(${margin.left},0)`)
.call(d3.axisLeft(y));
const svg = d3.select("svg")
.attr("viewBox", [0, 0, width, height]);
svg.append("g").selectAll("rect")
.data(data)
.join("rect")
.attr("x", (d, i) => x(i))
.attr("y", d => y(d.value))
.attr("height", d => y(0) - y(d.value))
.attr("width", x.bandwidth())
.attr("fill", "steelblue")
svg.append("g")
.call(xAxis);
svg.append("g")
.call(yAxis);
Alternatives
Other visualization libraries in JavaScript are, for example, Vega-lite, Highcharts, ECharts, FusionCharts, and react-vis.
D3 was developed by Michael Bostock, Vadim Ogievetsky, and Jeffrey Heer as an academic research project.
D3: Data-Driven Documents, IEEE Trans. Visualization & Computer Graphics (Proc. InfoVis), 2011.