Tableau
Tableau is one of the most widely used visualization tools. The user interface allows you to compose interactive visualizations and dashboards without requiring programming knowledge. Tableau can connect with various data sources such as text, CSV or Excel files, or even with large-scale database systems.
Tableau Desktop can be used for free if you save your visualization results on Tableau Public. There is also a free license for students.
Pros
- Drag and drop user interface to create powerful visualizations and dashboards without coding.
- High industry relevance (business intelligence).
- Relatively easy to create simple visualizations.
- Easy to share and embed results on web pages.
- Large online community, many tutorials available
Cons
- Tableau becomes quickly more complicated and difficult to use when you need to create more advanced visualizations.
- Tableau is not open source.
- License required if results can not be published on Tableau Public.
Resources
Example
Screenshot of an example visualization in Tableau Desktop.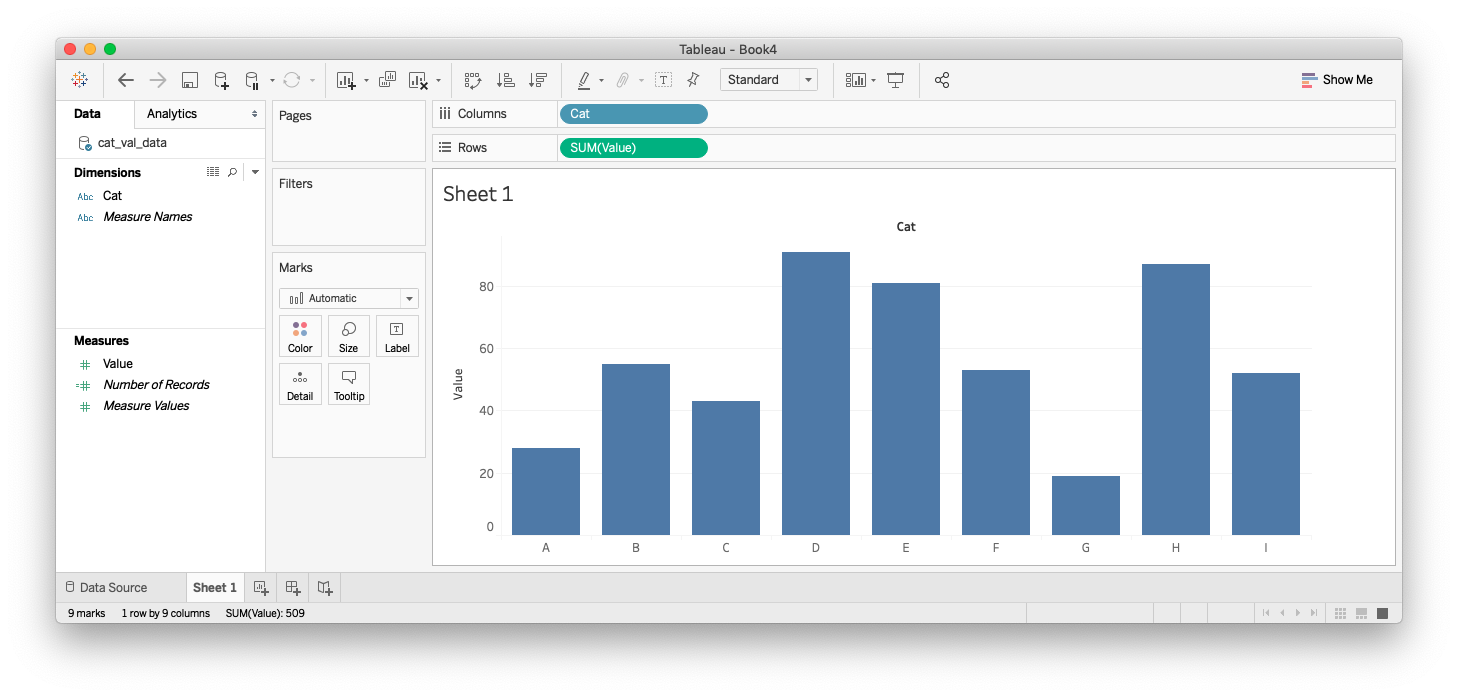
Alternatives
Other tools with a graphical user interface are, for example, Power BI, Data Illustrator, and Charticulator.Tableau evolved from the Polaris research project at Stanford University by Chris Stolte and Pat Hanrahan: Polaris: A System for Query, Analysis and Visualization of Multi-dimensional Relational Databases, Proc. InfoVis 2000.