Overview: The Design, Adoption, and Analysis of a Visual Document Mining Tool For Investigative Journalists
Abstract |
Paper |
Overview |
Stories |
Talk |
Video Preview |
Figures |
Supplemental Material
Abstract
For an investigative journalist, a large collection of documents obtained from a Freedom of Information Act request or a leak is both a blessing and a curse: such material may contain multiple newsworthy stories, but it can be difficult and time consuming to find relevant documents. Standard text search is useful, but even if the search target is known it may not be possible to formulate an effective query. In addition, summarization is an important non-search task. We present
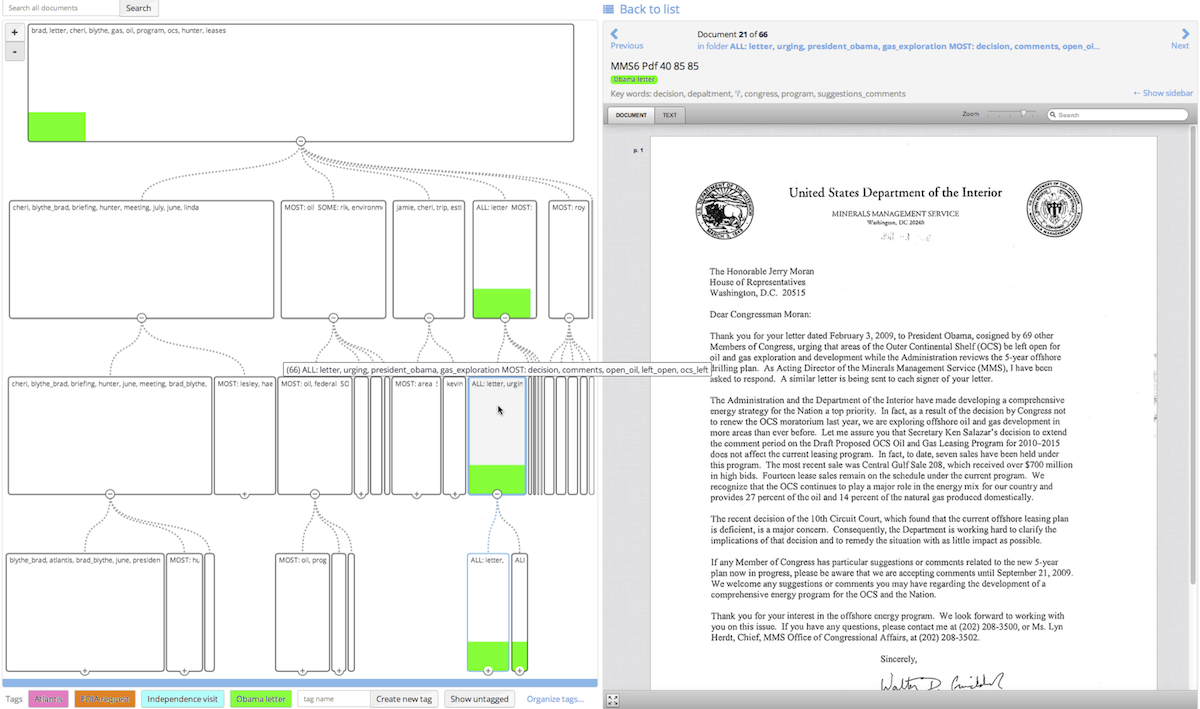
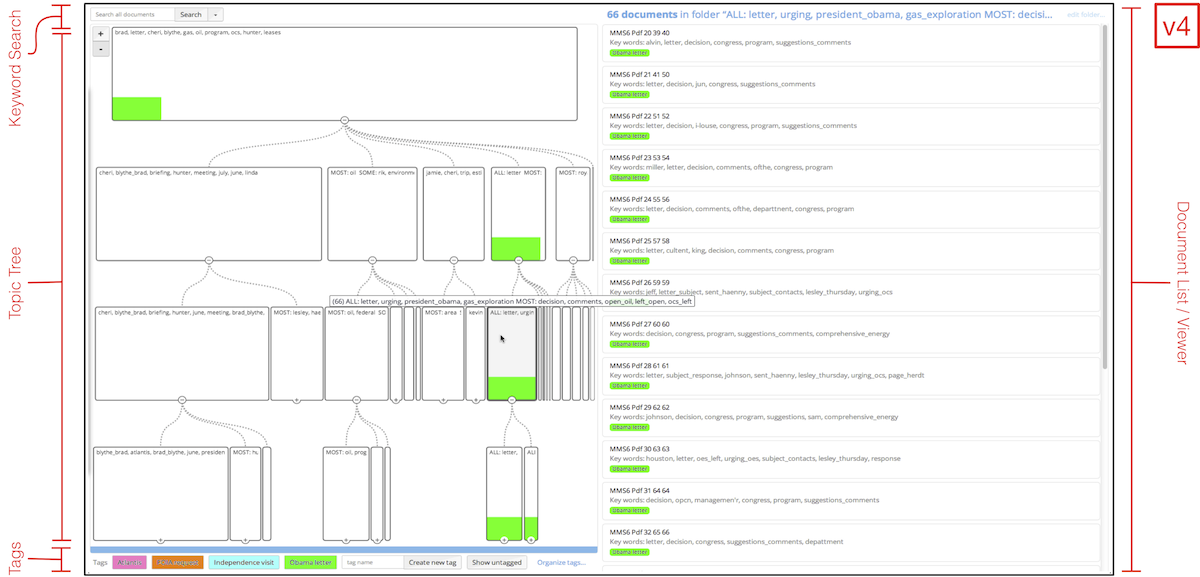
Overview, an application for the systematic analysis of large document collections based on document clustering, visualization, and tagging. This work contributes to the small set of design studies which evaluate a visualization system "in the wild", and we report on six case studies where
Overview was voluntarily used by self-initiated journalists to produce published stories. We find that the frequently-used language of "exploring" a document collection is both too vague and too narrow to capture how journalists actually used our application. Our iterative process, including multiple rounds of deployment and observations of real world usage, led to a much more specific characterization of tasks. We analyze and justify the visual encoding and interaction techniques used in
Overview's design with respect to our final task abstractions, and propose generalizable lessons for visualization design methodology.
Paper
Overview: The Design, Adoption, and Analysis of a Visual Document Mining Tool For Investigative Journalists
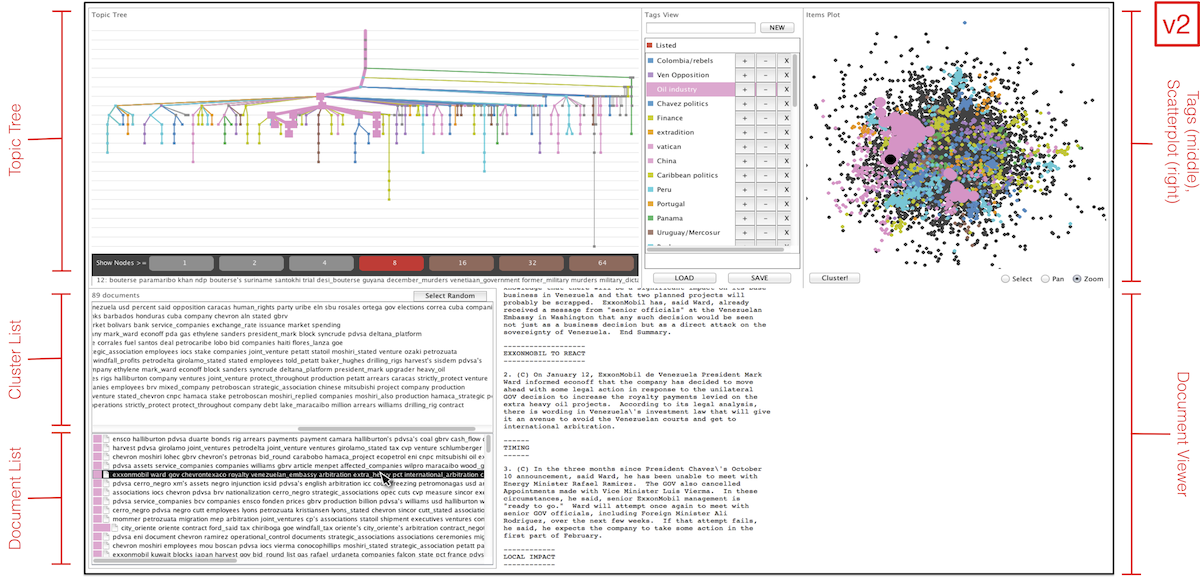
Overview: A Web-Based Visual Document Mining System
Stories
Stories completed with Overview:
- "A losing battle: How the Army denies veterans justice without anyone knowing" by Alissa Figueroa - Fusion, Nov. 6, 2014
- "Private memo reveals winding tale involving John McCain, the NRA and ... condors" by Nancy Watzman - Sunlight Foundation, Sept. 18, 2014
- "Missouri swore it wouldn't use a controversial execution drug. It did" by Chris McDaniel - St. Louis Public Radio, Sep. 2, 2014
- "The brilliance of Louis C.K.'s emails: He writes like a politician" by Adrienne Lafrance - The Atlantic, Jul. 16, 2014
- "Report backs truck driver in Skagit River Bridge collapse" by Mike Lindblom - Seattle Times, Jun. 11, 2014
- "Locally, veterans have mixed opinions" by Scott Donnelly - PostStar.com, 2014
- "Surprise! Many credit card agreements allow repossession" by Fred O. Williams - creditcards.com, Feb. 18, 2014
- "For their eyes only: Police misconduct hidden from public by secrecy law, weak oversight" by Sandra Peddie and Adam Playford - Newsday, Dec. 28, 2013 [Case Study #6: NEWYORK]. This story was a finalist for the 2014 Pulitzer Prize in Journalism (Public Service).
- "DHHS downplayed food stamp issues" by Tyler Dukes - WRAL, Dec. 9, 2013
- "Own a gun? Tell us why" by Michael Keller - The Daily Beast, Dec. 22, 2012 [Case Study #4: GUNS]
- "Ryan asked for federal help as he championed cuts" by Jack Gillum - Associated Press, Oct. 12, 2012 [Case Study #3: RYAN]
- "TPD working through flawed mobile system" by Jarrel Wade - Tulsa World, Jun. 3, 2012 [Case Study #2: TULSA]
- "What did private security contractors do in Iraq?" by Jonathan Stray - Associated Press, Feb. 21, 2012 [Case Study #1: IRAQ-SEC]
Talk
This paper was presented by
Matthew Brehmer on Friday, Nov. 14, in the
"Documents, Search, and Images" session of
InfoVis 2014.
→
Slides (35 MB PDF)
→
Slides (99 MB Keynote)
→
Video (31 MB MP4)
Video Preview
High-Resolution Figures
Click on a Figure to open in a new tab.
Supplemental Material
Further reading:
Matthew Brehmer
Last modified: Nov 25, 2014.

