Variant View: Visualizing Sequence Variants in their Gene Context
Talk
A talk will be given during the 10:30 EST InfoVis session on Thursday, October 17, at InfoVis 2013 in Atlanta, Georgia, USA.
Video
The video explains Variant View's interface components and provides usage examples:→ MP4 video (13.3 MB, with audio, tested on QuickTime 10.0)
Supplementary Materials
The supplementary materials contain additional figures referenced in the main paper.→ supplementary_materials.pdf
Software
Variant View is available as open source at the Variant View Software Page.Figures
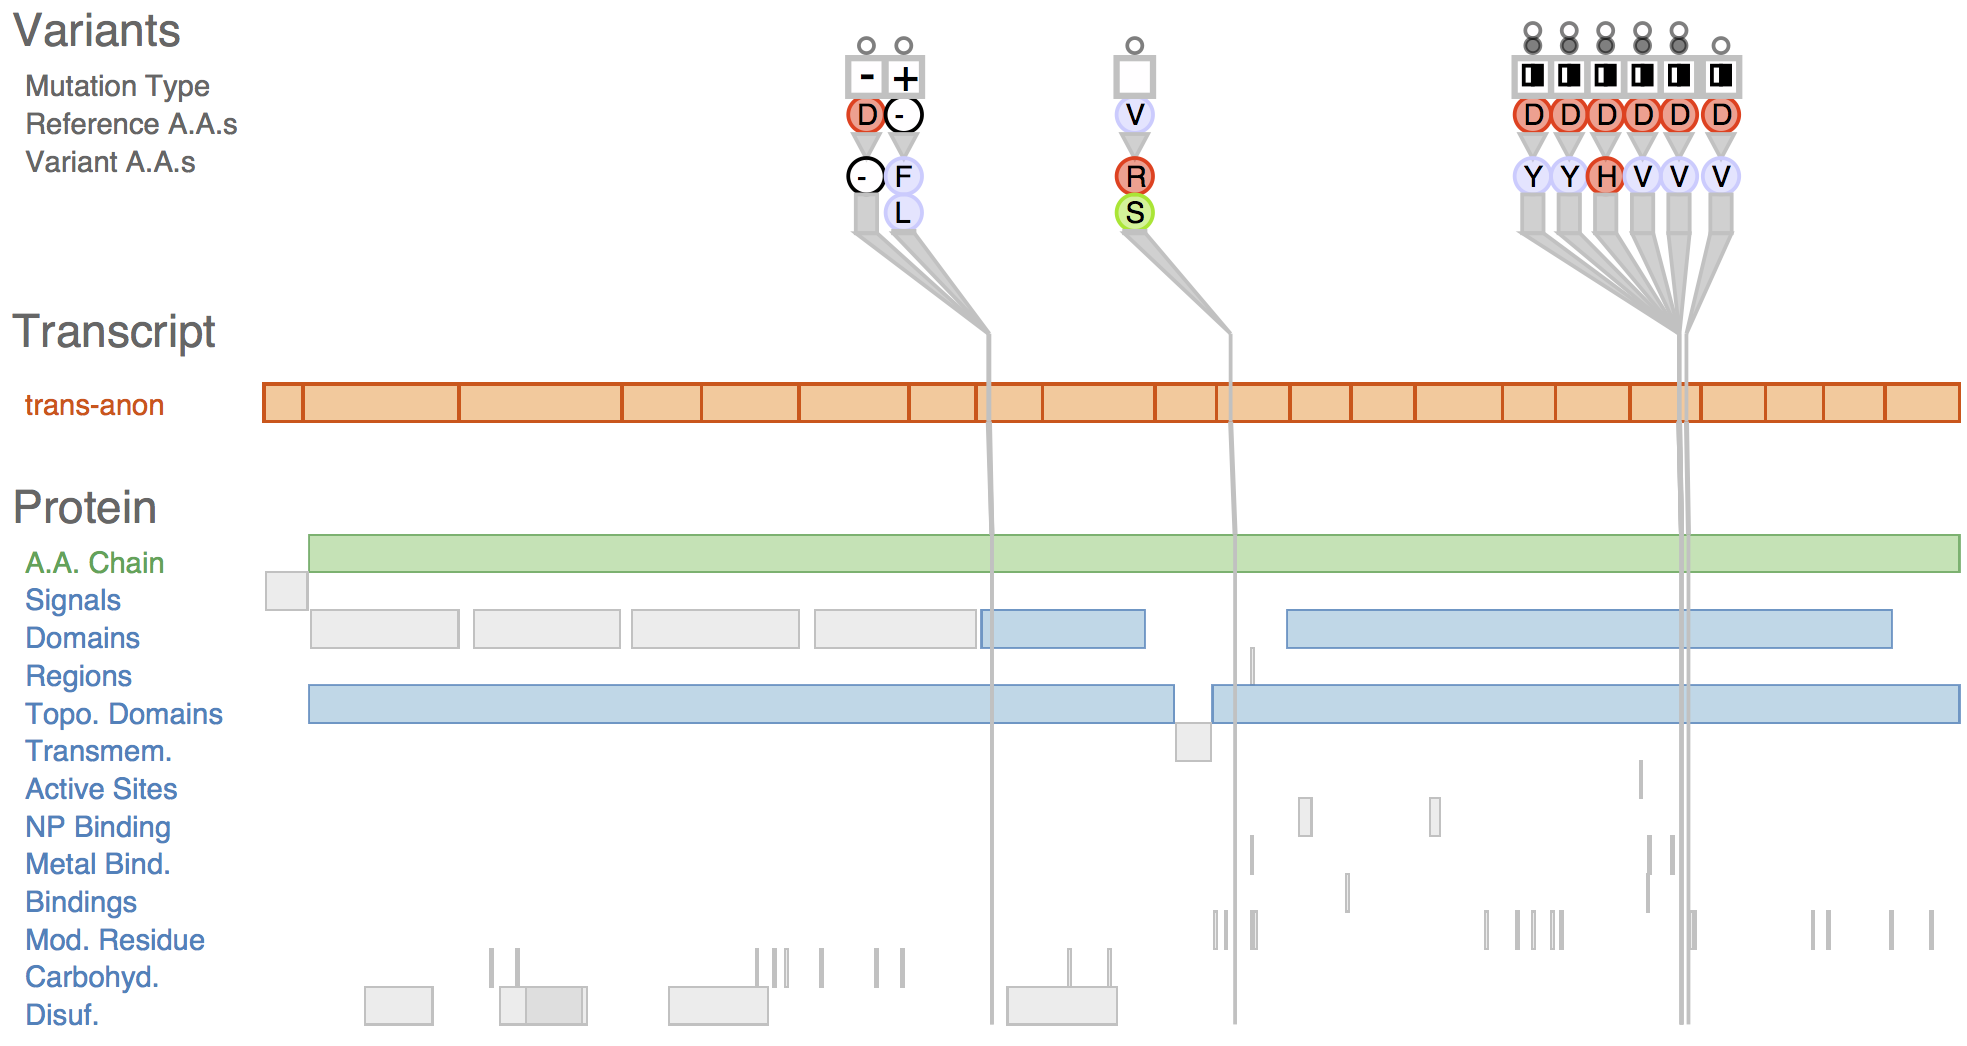
Fig. 1 Sequence variants and their attributes shown in Variant View with respect to biological context annotations at multiple scales. This gene, whose name is anonymized, was identified by analysts as a putative cancer candidate gene through using the tool.
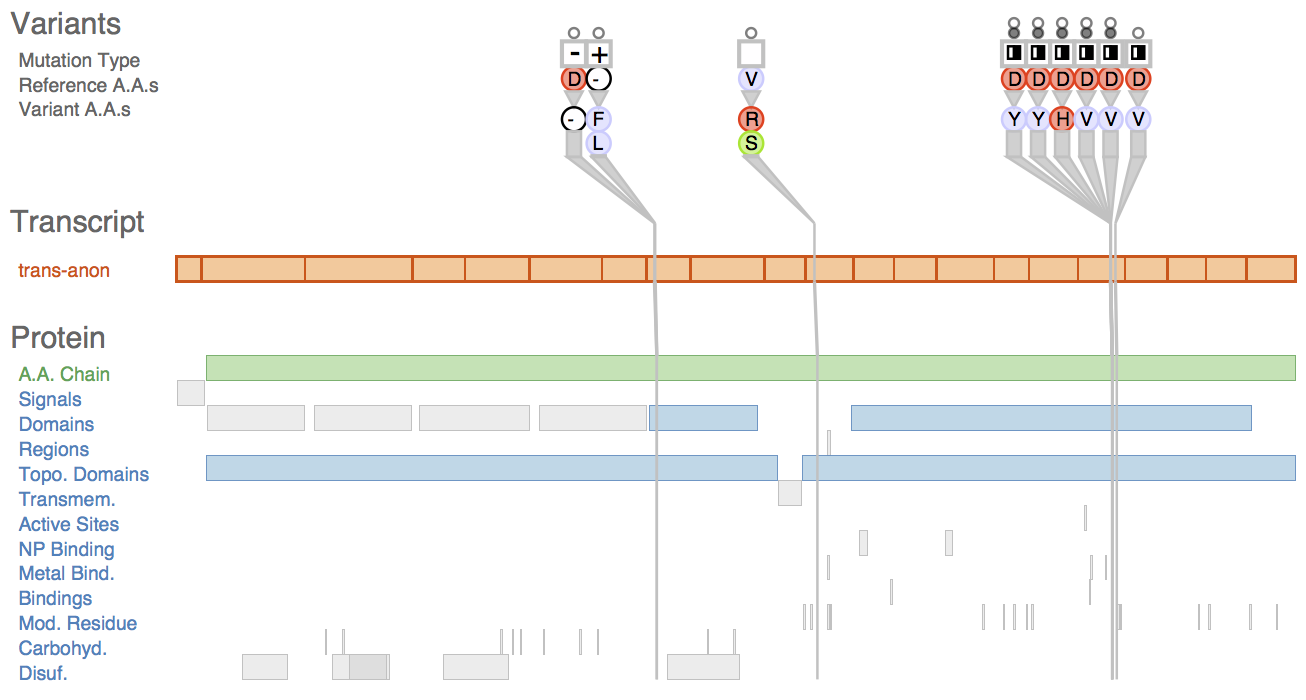
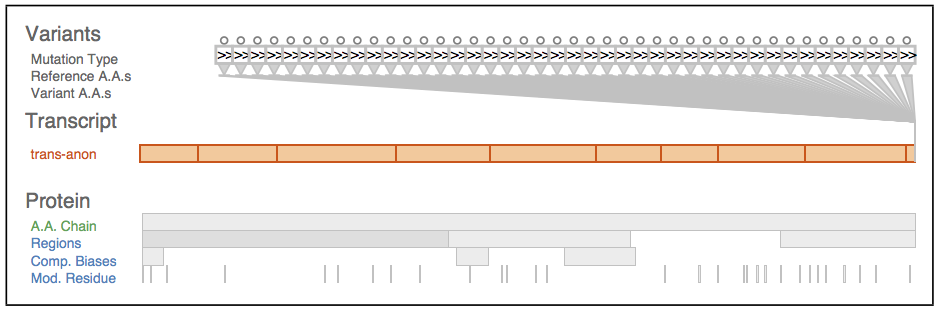
Fig. 2. Biological context in which variants occur. The gene level is specified by genomic coordinates, the exon-containing transcript level is specified by transcript coordinates, and the protein level is specified by protein coordinates.
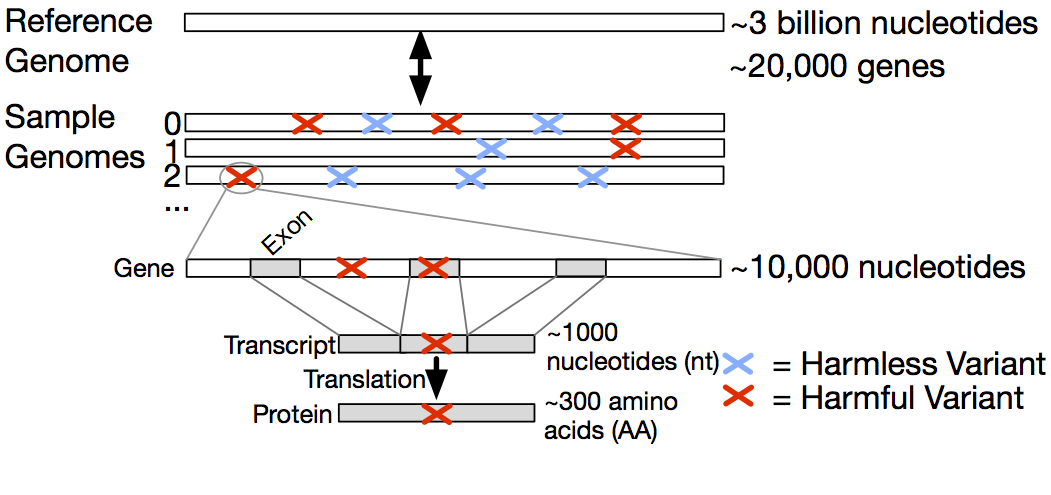
Fig. 3. The Variant View tool, annotated to indicate its three main views. The primary view (A) is the central overview for performing variant impact assessment; the reorderable gene list view (B) can sort genes alphabetically or by derived measures of variant importance; the secondary Variant Data table (C) contains peripheral information.
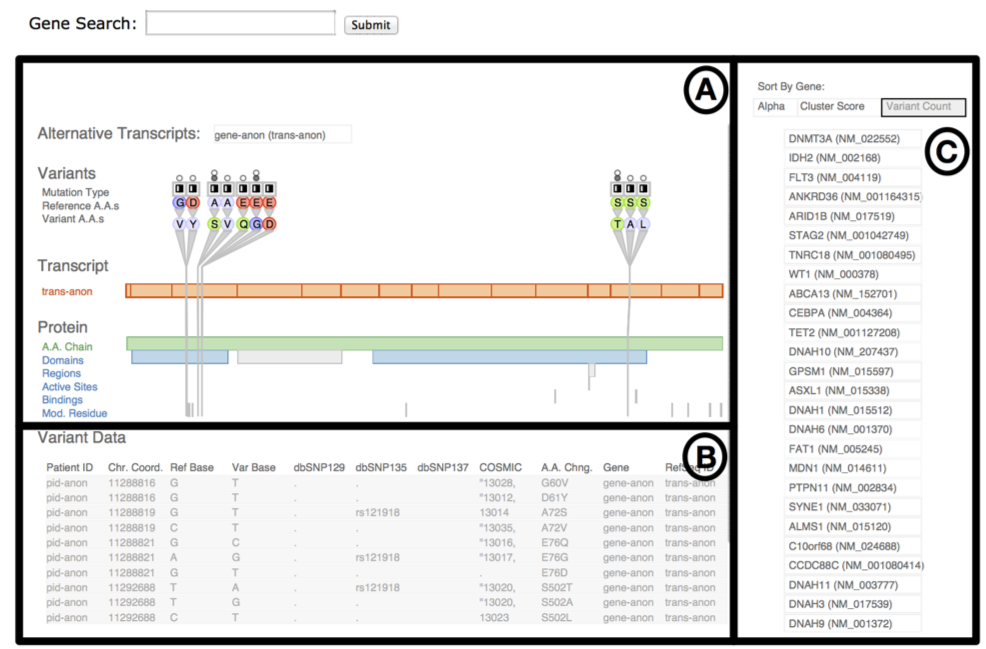
Fig. 4. Variant visual encoding.
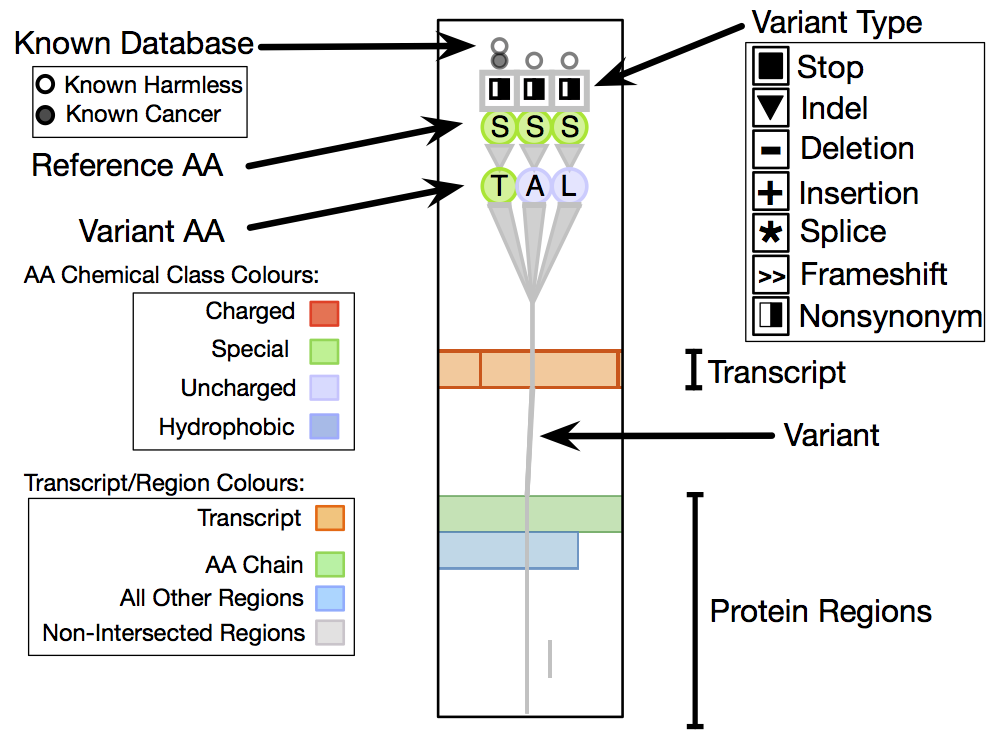
Fig. 5. Comparison of the same variant data between different visual encoding schemes.
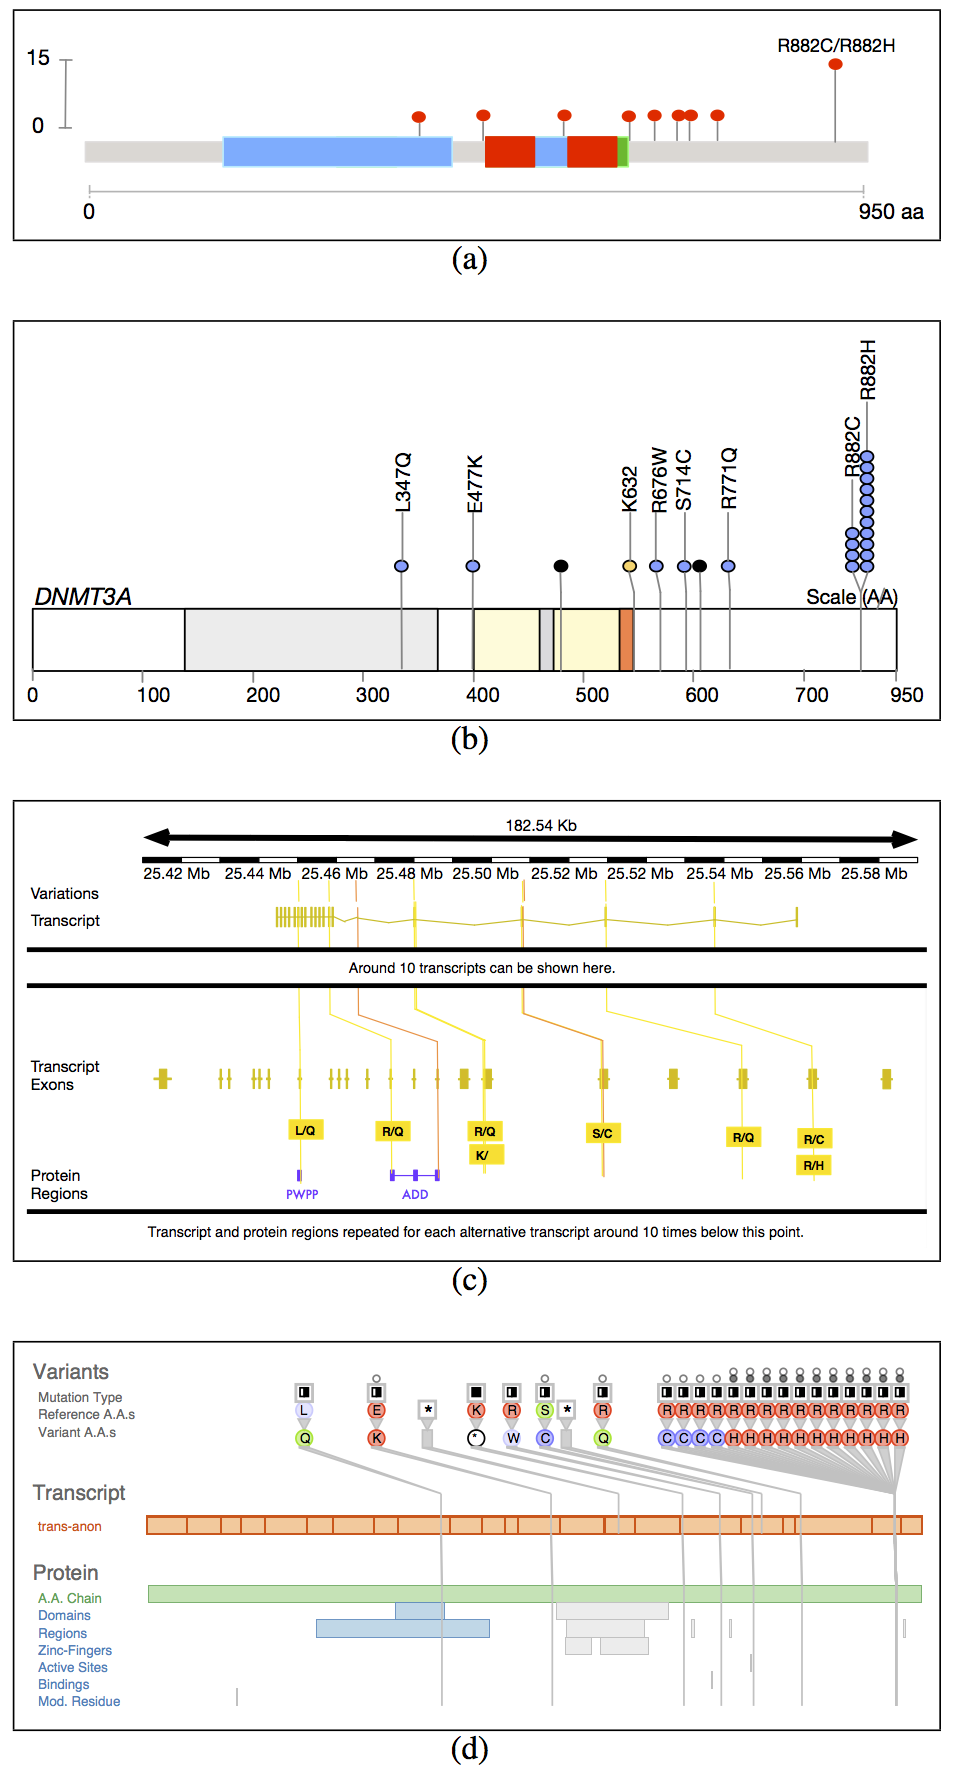
Fig. 6. Variant View allowed analysts to quickly confirm known results: known AML genes could be found near the top of the sorted lists, and the per-gene views clearly and immediately showed tell-tale structure. (a) IDH2. (b) FLT3. (c) Example gene without interesting structure near the list bottom.
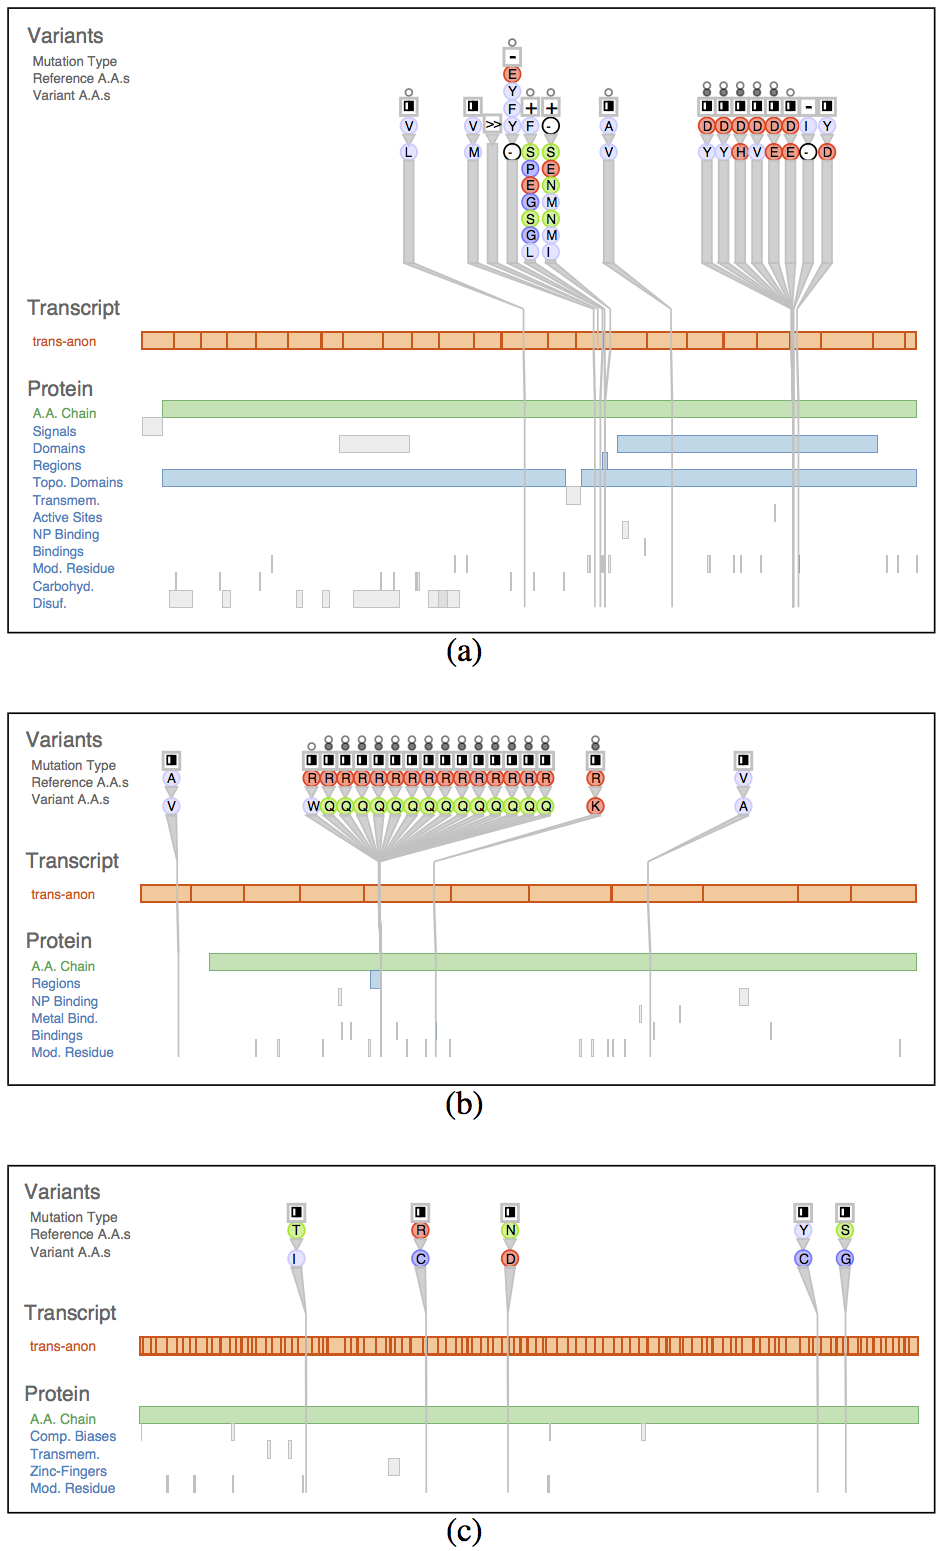
Fig. 7. Comparison of patient data to a known-AML variant database. The immediate neighbors for each variant are shown.
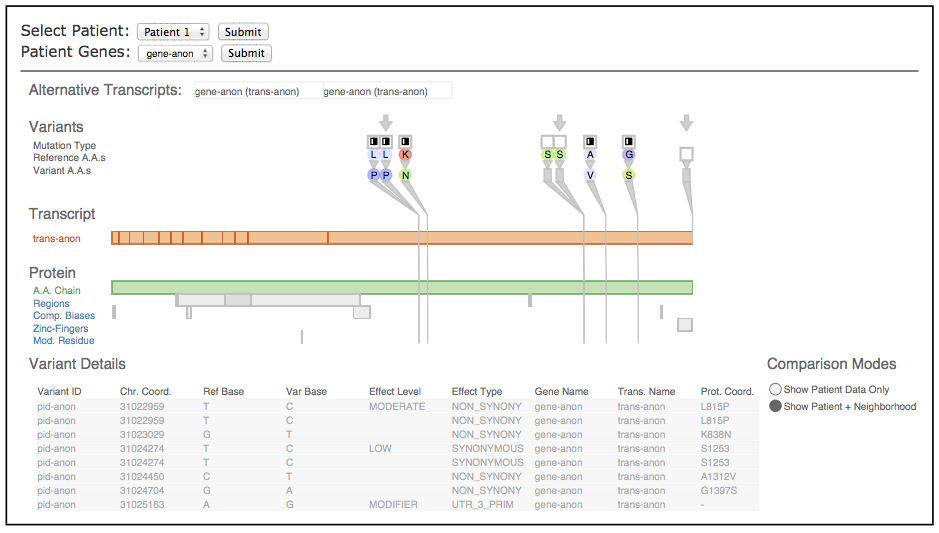
Fig. 8. Debugging the bioinformatics pipeline.
Joel Ferstay Last modified: August 1, 2013