CPSC
533C Project proposal
Memoplex Browser: Searching and Browsing in Semantic Networks
Yoel Lanir (yoel@cs.ubc.ca)
Introduction
Retrieving information in an
efficient way has been a major task of information management systems. Software companies like Google offer
retrieving solutions which are based on strong indexing algorithms. These solutions use an interface in which the
user enters the search query and gets a list of possible results. If the users do not find what they are looking
for (either because it is not in the results or because there are too many
results) they need to refine their query, resubmit it, and look over the
results again.
Browsing can be a useful addition to conventional search methods. The user could enter a search query, look at one of the result nodes, and then browse from one node to another according to some sort of association rule between the nodes. Going from one node to another, he can then find his target node similar to the simulated annealing idea. Browsing can also be useful to get a general idea of the available information space, or for searching for a target not yet defined in the searchers mind.
Traditionally, information on computer systems is
stored in hierarchal or relational structures.
Information is accessed by a fully specified path, by navigation, or by
searching certain properties. A
different way to store information is investigated by Mike Huggett's
Memoplex project in his Ph.D. thesis. The
main idea is to build an associative or semantic network from the corpus of
data. Each node in the information space
will be connected to other nodes according to some predefined classifier
function.
The main goal of this project is
to assist the user in searching and investigating a large database using a
browsing tool which navigates efficiently through this semantic network.
Domain and
task
The domain of this project is
information retrieval and browsing of text documents.
The documents are tied together in
a semantic network, indicating which documents are more related to other. In order to create the semantic links between
the documents Tfidf was used. Tfidf (Salton and McGill, 1983) is a simple classification
algorithm which extracts human readable identifying attributes for each
document in a corpus. We use this as a
classifier for the document domain, which assists us in building the semantic
network. Nodes sharing many attributes
will have strong semantic ties, while nodes sharing few attributes will have
weak semantic ties.
In addition, there is an
activation value for every node on any given time . This activation value shows the user possible
nodes which may interest him. Nodes
recently used will receive a high activation value, and this activation spreads
through the semantic links and activates the node's semantic neighbors in a
declining exponential way dependant on the semantic distance. The activation value of each node declines
exponentially through time. This
activation function can be seen as a way to keep the history of recently used
nodes, together with closely linked semantic nodes which might interest the
user as well. When a direct search is
made, the result nodes will be highly activated, so showing the highly
activated nodes will actually show the search results.
The task in this project is to help
the user search and navigate through this system. The user will be interested in browsing through
the semantic network, searching for nodes, or just exploring the information
space. In addition, the user should to be able to easily access highly activated
nodes.
Dataset
The dataset that will be used
consists of 2000 articles of different domains gathered from the NYT. The articles are in regular text file
format. Each article includes the title,
the author, date published, and the text.
Proposed solution
Semantic view
For the task of navigating through
the semantic network,
A radial view which puts a single node in the center of interest
will be used similar to Yee at el. (2001)
to show the semantic tree connected to the node of interest. Two levels of nodes will be shown from the
center node. This is both because after
three levels, there is almost no semantic similarity, and because in large
networks, there will be too many nodes to effectively navigate through. When the user selects a node, it will move to
the center, and will become the new center of interest.
The visualization challenges in
this view are:
·
Layout –The graph can be seen as a tree with its root in the center
node. The node's children are all the
nodes with semantic links to it. The
nodes will be placed in varying distances from the center node to show the
semantic distance from the father node.
In the second level, I will use a 180° view or less away from the
center, in order to avoid crossing of lines, and to put the emphasis on the
first level nodes. The major challenge
here is to build the layout in such a way that the space will be utilized best,
allowing as many nodes as possible to be clearly seen, without cluttering
specific areas too much, and keeping high aesthetics. The algorithm I will use
for the layout will be a modified algorithm of Grivet et al. (2004). The modification will have to do with the
distances from the center node, which vary in this
implementation, and the radial angles of the nodes in the second level which
will not total to 360°, and instead will be less then 180° according to the
number of nodes.
·
Scalability - The layout should be as scalable as possible. For very large graphs it is inevitable to use
some sort of threshold to reduce the number edges. Nevertheless, we wish to have our algorithm
as scalable as possible.
·
Labeling – In large networks with many nodes, this window can be pretty
cluttered. If there is, for example, an
average of 40 neighbors for each node, we will need to show 1600 nodes. This will not leave space for labels on each
node. To solve this problem, we will
use Excentric Labeling (Fekete and Plaisant, 1998) - a dynamic technique to label a
neighborhood of objects located around a cursor.
·
Animation – when choosing a new node, the chosen node will move to the
center of the view, moving the graph in a smooth way with him. If a first level node is chosen, then it will
move to the center with all his connecting nodes moving with it, changing
position and size.
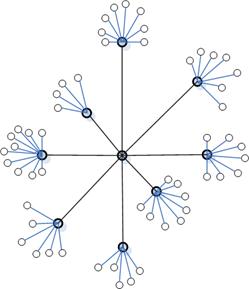
Figure 1 – example of a simple semantic view
Activation view
The second view will show the most
activated nodes. The best way showing
this, is using a simple list with the higher activated nodes on top.
The tools that will be used in
this window:
·
Brushing – the nodes in the activation view will be linked to the
corresponding nodes in the semantic window, if applicable.
·
Glyphs: I will use simple glyphs
to show the amount of activation level of the nodes in the activation window,
and the most recently used nodes to show the browsing history.
I am considering trying to
superimpose the two views one on top of the other. The problem with that is that the space in
the navigation window represents semantic distance. Adding to this space nodes according to some
another metric (activation values) is a difficult cognitive problem.
Data view
This view will show the detailed
data of the focused document. The data
will include the title, the author, date, and part of the text.
Sample
scenario
·
A user is interested in finding an article about the Iraqi war and it's
consequences on Bush's popularity. He
types: "war in
·
Our user then wishes to get a general idea of photographing with digital
cameras. He enters: "digital
camera" in the search window, and then chooses the first article which
talks about how to improve digital photos.
He then browses leisurely through the articles which interest him using
the semantic view.
·
Finally, the user remembers that while searching for the first query, he
browsed over an article that he wants to examine again. He types in "Iraqi war" in the
search window, and the pages he already visited are highly ranked in the
results because they are more highly activated.
Thus, he chooses one of the nodes which he remembers from his previous
browsing, and he follows the associative trail he followed the first time, as
our brain is used to remember associative links. He thus finds the article he was looking for.
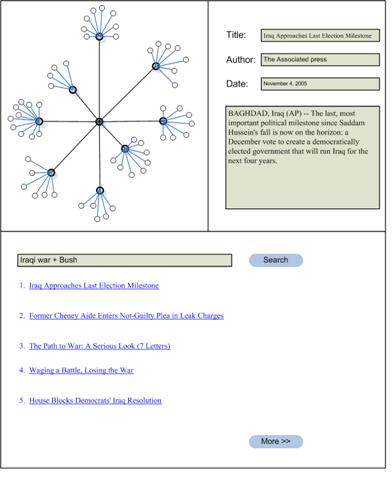
Figure
2 - Mockup interface
Proposed
implementation approach
·
The implementation will be done using Java Swing
·
I will examine the Prefuse tool for the graph
drawing, layout and animation.
·
The Memoplex server jar written by Mike Hugget will be used to access the semantic information
system.
Personal
expertise
I have no special expertise
regarding information retrieval, but I am highly interested in the area, and I
am thinking of doing my Ph.D. thesis in this area. I have no experience in Java or GUI
programming.
Milestones
The project milestones are as
follows:
·
November 4 – Proposal submitted
·
November 11 – final discussions with Prof. Rensink,
Prof. Hoos and Mike Huggett
about the system requirements. Re-design
of the system if needed. Learn the Prefuse tool.
·
November 16 – project update in class
·
November 25 – layout algorithm design finished.
·
December 2 – first version
ready. Start testing on dataset.
·
December 11 – final version ready
·
December 18 – final report finished
·
December 19 – final presentation
References
Fekete, J.D., Plaisant,
C. (1998) Excentric Labeling:
Dynamic Neighborhood Labeling
for Data Visualization, Proceedings of the Conference on Human factors in
Computer Systems (CHI'99), ACM ,
S. Grivet, D. Auber, J. Domenger, and G. Melancon. (2004) Bubble tree drawing algorithm. International Conference on Computer Vision and Graphics, pages 633.641,
Salton, G. and
McGill, M. (1983). An Introduction to Modern Information Retrieval.
Ka-Ping
Yee, Danyel Fisher, Rachna Dhamija, and Marti Hearst, (2001), Animated Exploration
of Graphs with Radial Layout, Proc InfoVis.