Participants
Kaitlin Duck Sherwood, ducky@cs.ubc.ca
Experience
- I did a project integrating maps, floorplans, and a virtual walkthrough about ten years ago at UIUC.
- I have been very interested in a related visualization of census
data for 20 years. I haven't ever gotten past the exploratory stages,
but this means I am highly motivated to learn how to unravel US Census
Bureau datasets.
- I have never written anything in Javascript before, nor any dynamic client-side code of any kind, but would like to learn.
- I am not a graphics whiz. I am not sure what algorithms to use to
select what data is likely to be visible. OTOH, I have Google and a
copy of Foley and Van Dam within easy reach.
- I am not a database whiz. I built a materials tracking system
eighteen years ago using an RDBMS, but have basically not used
databases since them.
- I have significant experience in a basket full of programming
languages, including Smalltalk, perl, C++, C, Java, and a whiff of
Python.
- I haven't ever written a Web server (that I can remember), but I
have done a ton of CGI work and am very familiar with the HTTP
protocol. I am very familiar with HTML, and have worked on a Web
client.
- Roughly eighteen years of industrial experience makes me anticipate and plan for unanticipated problems.
What does this thing do?
Domain, task, and dataset
This
project is designed to help people visualize US population data (from
the 2000 US Census) by providing them with interactive zooming/panning
controls and the context of a familiar map.
This project does not pretend to push the frontiers of research
adequately to eject a publication. This project is designed to do
something cool and useful.
Scenario
Billy Rubin, a
fifth-grade student at Rancho Cowabunga Middle School, is exploring
population density as part of his urban housing presentation. He goes
to Webfoot's Information Visualization site
and is presented with what looks basically like a standard Google map
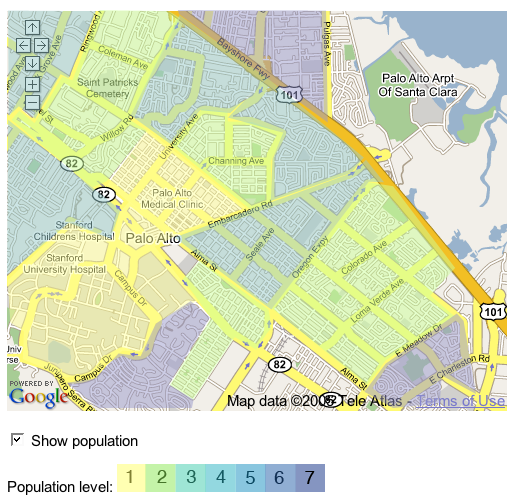
of Palo Alto, CA. Aside from explanatory text on the page, the only
differences are a checkbox labeled "Show Population" and a color scale
legend.
He clicks on the "Show population" checkbox below the map. The map
changes to show the population: areas with fewer people have more of a
yellow tinge; areas with more people have a bluer tinge. Areas with no
residents -- industrial parks, water, recreational preserves, etc. --
have no tinge.
What Billy sees is in the left panel of this table:
Welcome to Webfoot Maps
blah blah blah explanatory information
blah blah blah copyright and how-this-was-made information blah blah
|
(Note that the labels on the color scale legend will need to be adjusted once I figure out what reasonable values are.)
|
Palo Alto not being Rancho Cowabunga, Billy uses the standard Google
controls to zoom out. As he zooms out and individual polygons at one
level become too small to see, the polygons get aggregated into larger
polygons.
Billy pans to find Rancho Cowabunga using the standard Google controls:
click-to-recenter, pan by dragging, and pan by clicking on the
directional controls. The map continues to show areas colored by
population density.
Once Billy finds Rancho Cowabunga, he zooms in. When the
polygons at one zoom level become too large to be interesting, they
automatically deaggregate into smaller polygons.
At one point, he gets a little confused about what is on the map and
what is part of the population overlay, so he unchecks the "Show
population" box. The overlay vanishes, and his confusion is resolved.
How will I make it?
Proposed solution
I will show maps with the hue of polygons on the map representing
the number of people living in that polygon as counted by the 2000 US
Census. I will provide context to the users by making the polygons
translucent, leaving the underlying map data discernible.
I am more interested in providing (and more worried about)
snappy performance than I am in broad geographical coverage. There are
numerous opportunities for the performance to be inadequate.
Determining the right data to display for a given clipping region,
retrieving the information, aggregating information (when zoomed out),
rendering the PNG image, and serving the image all take time (in
addition to the time Google takes, which I won't be able to control).
I expect that I will need to trade disk space for speed, pre-processing
information and caching some information on disk. As my last name isn't
Google, I expect that I will not have enough disk space to handle all
of the United States. I am willing to restrict the geographic range in
order to ensure adequate performance. If I need to restrict the area of
interest, my final paper will discuss what resources would be needed
for the entire US.
Implementation approach
I plan to use Javascript and the Google Maps API to serve maps, capture pan/zoom events, and to overlay area data on top of the Google Maps.
I plan to use the gd library, probably in C or C++, to generate a transparent PNG image to overlay on top of the maps.
I plan to use C or C++ with the Shapefile C library to parse a variant of the TIGER/Line data -- the ESRI shapefile data -- which includes population demographic information.
If I need to use a database, I will use MySQL.
Milestones
-
4 November: Proposal finished 
- 13 November: One PNG file generated with one polygon extracted from dataset, requiring:
- extracting polygons with the Shapefile C library
- extracting the appropriate demographic data from the dataset with the Shapefile C library and the data files
- associating polygon <->demographic data
- understanding the gd library well enough to generate a PNG with a transparent polygon
- 20 November: Functional panning, perhaps limited to one US state and perhaps slow, requiring:
- determining which polygons will be visible given lat/long bounds
- iterating through visible polygons, drawing each
- plugging overlays into the Google Maps API
- 4 December: Functional zooming
- determining which polygons will be visible given lat/long bounds and zoom level
- aggregating lower-level data (note that I do not think this is trivial)
- killing small code gremlins
- 11 December: Performance tuning and bug fixes done, probably requiring finishing:
- pre-processing census bureau data into a form that is easier to extract quickly
- prefetching of neighboring overlays
- caching previously-used overlays
- killing large code gremlins
- 16 December: Status update due, requiring
- bibliography done
- writing done
- 19 December: Final due date, requiring
- learning LaTeX
- coercing text into journal format
- killing LaTeX gremlins
Future work
There are all kinds of interesting and useful things that could be done on top of the base project.
- I believe that once I am able to display total population density,
then it is relatively easy to extend the code to allow displaying one
of many different flavors of demographic data, e.g. the non-white population. I would like to do that, think I can probably do it, but hesitate to promise it.
- Allowing the user to select information from one of several
different censuses is also clearly within the realm of imagination. I
believe that this is slightly too ambitious (in part due to disk space
limitations) for the scope of the class.
- Use a hierarchical database to allow faster aggregation of the census tracts.
- To improve performance, make the code memory resident with an HTTP server on it, instead of being connection-oriented.