Exploring alternative futures
Overview
QUEST is a collection of models that explores the future of the Georgia Basin region. It is part of the larger Georgia Basin Futures Project by the Sustainable Development Research Inititiative at UBC. A user can explore a future for the region by choosing 11 mulitple choice policies. The models then generate a set of 300 metrics that predict conditions in the region in the year 2040. Users will explore different scenarios to gain an understanding of how current policy choices affect the future. QUEST is successful if the user makes any real world decision based on the insights gained in a QUEST session. I have personally been involved in the QUEST project for 2 months.
Design Goals
This software will typically be used for exactly one session. This has a great impact on the InfoVis techniques that will be used. The software must be simple, engaging, and attractive. The software will be usable simply by looking at the screen and interacting with the widgets. Widgets will show clear affordances [1] and there will be no hidden features buried in menus or alt-keys. Aside from the author, it is unlikely that this software will ever have expert users. Thus any features must be instantly usable.
The main goal of the software is to link input choices to output effects. As such the inputs and outputs must be simultaneously visible onscreen. As the user is evaluating the consequences of input choices, the output choices must be easily compared. As the user explores alternatives, some will be preferable to the user than others. It must be easy for the user to go back to his/her favourite scenario and see which input choices created it.
InfoVis solution
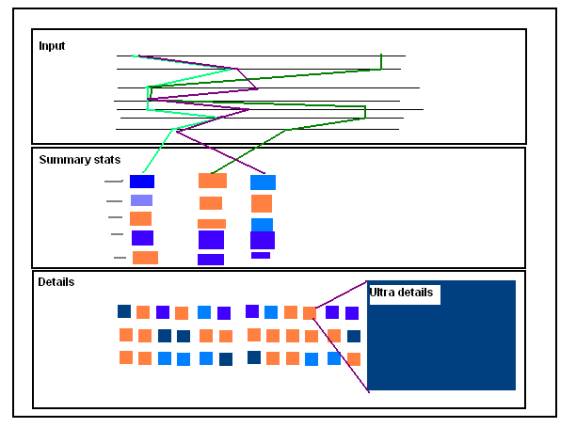
The user needs to make 11 multiple choice inputs. Each input choice will be represented by one axis of a parallel coordinates display. Choices are connected by lines providing a visual history of explored alternatives. The line links to the output summary chart. The outputs may scroll off screen or be discarded by the user, but the input choices remain permanently visible. As certain choices are decided upon and repeatedly made, the lines in that region will thicken.
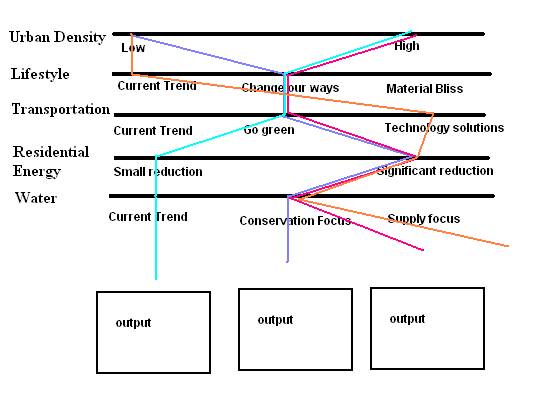
This interface was largely inspired by [2]
The first level of output will use stacked divergent coloured boxes to provide high level summary data. These will be displayed side by side for easy comparison. The user will be able to reorganize the order as neighbouring boxes are easiest to compare. A user can assign a name to a scenario to aid later recall.
The user can then click on a row of interest to zoom in to the next detail level. All visible scenarios will have their corresponding row expanded in the details window. The user then has the opportunity for one final detailed zoom which will provide charts, stories, or videos to explain the model figures.
Usage Scenario
Moira, a city planner in the GVRD hears about a QUEST workshop to explore policy choices in the region. She attends a morning workshop and learns about how the models have been developed. In the afternoon she uses this software for an hour to explore some policy choices. She has sophisticated knowledge of statistics and models. Her computer knowledge is limited to the Windows office suite, e-mail, and web browsing.
She begins a
session by creating a scenario. Buttons
appear on the axes in sequence guiding the input process. As a planner she is particularly interested
in cities and immediately drills into the urban growth section. She reads
the metrics with interest but cynically wonders if her choices made any
difference at all. She creates a second
scenario with radically different policies.
The overviews tell her that her choices are indeed changing the
models. Not being particularly
interested in her "test the model" model, she returns to exploring
neighbours of her original
choices. The visible trail of her first
input makes it trivial to see her original choices and alter them
accordingly. She notices that several
of her scenarios don't have any growth in Richmond. Zooming into the deepest detail level she discovers that water availability
is limiting the growth rate for that region.
Moira is used to thinking about pipes and city water infrastructure but she
previously ignored North Shore reservoir issues. A few more scenario
explorations reveal that water policies have great impact on the future. She ends the session determined to talk to
someone in North Vancouver about subdivision development in watershed areas.
Implementation
Previous work on QUEST projects has provided
a MySQL database of input to output mappings along with a java interface to
retrieve them. It also provides a basic
representation of summary details.
The project will be implemented in java with
the Graphics2D libraries of the AWT as the primary graphics primitives. Other infovis toolkits were considered but
rejected as i) the parallel coordinates display is rather simple ii) the
parallel coordinates display will be customized to have input buttons and to
correctly aggregate and thicken the input lines iii) a uniform appearance is
desired to make the software attractive for one time users
Milestones
Nov 11th - Basic input parallel coordinates widget
completed. Clicking buttons on each
axis creates history line
Nov 18th - Inputs
create output summary graphs. Summary
rows can be clicked to show detail rows
Nov 25th - Excess
scenarios scroll off the screen. Input
lines aggregate nicely into beautiful thick lines. Scenarios can be reordered
Dec 2nd - Everything
looks better. Colours have been selected with care, highlighting
guides user actions, widgets have action handles. Animated transitions guide focus.
Dec 9th -
Victory! Code is complete, bug free,
and beautiful. Time to start writing
the summary.
[1] Norman, Donald
A.: The Design of Everyday Things
[2] Melanie Tory, Simeon Potts, and Torsten Möller, "A
Parallel Coordinates Style Interface for Exploratory Volume Visualization",
IEEE Transactions on Visualization and Computer Graphics, vol. 11, no.
1, Jan/Feb 2005, pp.71-80.