Peiqun (Anthony) Yu
pqyu@cs.ubc.ca
Project Domain
Peer-to-peer computing is becoming more and more popular nowadays, because of its special features, such as self-organization, load-balancing, availability, fault tolerance, and anonymity. However, locating content in an efficient and scalable way is one of the most challenging problems in P2P research. In Juan Liz's master thesis, she proposes a novel Efficient Clustered Super-peer (ECSP) P2P model. In this model, Peers are grouped into clusters according to their topological proximity. Peers that have more resource capabilities in a cluster are selected from regular peers to act as cluster leaders. Each cluster has one super-peer. These super-peers are responsible for locating content and maintaining the network structure for client peers. Super-peers are connected among each other, to construct a backbone overlay network.
To scale the routing on overlay networks connecting super-peer nodes, the thesis designed an application-level broadcasting protocol, Efficient Flooding Algorithm (EFA), to perform routing on the super-peer backbone network. EFA is much more efficient than flooding.
However, it's not an easy task to understand the structure of the topology and the behavior of the EFA content search algorithm.
Task
This project is an interactive visualization tool. It intends to allow people to visualize the super-peer network structure and verify the behavior of the EFA protocol. In this project, I plan to fulfill the following tasks:
The tasks of the tool are not limited to these, other tasks such as demonstrating the joining procedures of peer or super-peer will be the future work.
Dataset
In Juan Li's thesis, she implemented a program for generating several different topologies such as grid, random, and Barabasi-Albert topologies. I use the program to generate super-peer networks.
Personal expertise
I don't have background about visualization and graphics before taking this course. I have taken 1 network course in undergraduate, and I am taking another two network courses in this term. Juan Li's thesis on Super-peer P2P network is my major source of the domain knowledge. I have also intensively read the papers on visualization through taking this course.
Proposed infovis solution
Following is the infovis solution to the target tasks, and I will apply server al visualization techniques that I learned through this course:
Task #1 solution:
Task #2 solution:
Task #3 solution:
Scenario of use
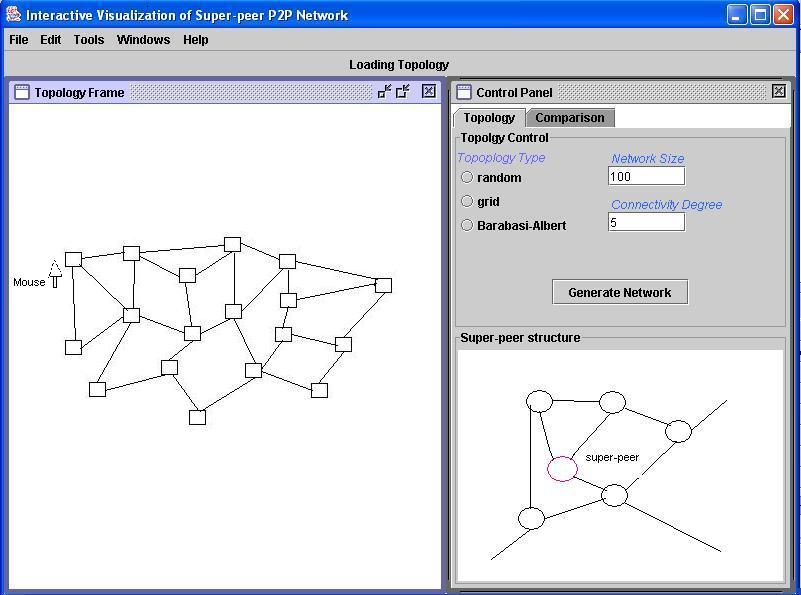
When a user starts the program, the user will first see the topology view. In this view a user can generate and see a super-peer network in different topologies.
If the user moves the mouse over a super-peer, the topology structure of this cluster is show on the smaller window sitting on the right-bottom of the window. At the same time, the neighbors of the node are highlighted, and the neighbors' neighbors are also highlighted, but the two groups of neighbors are highlighted in different color.
The user then initializes a content search from a super-peer. The searching message is then flooded out to find the content.
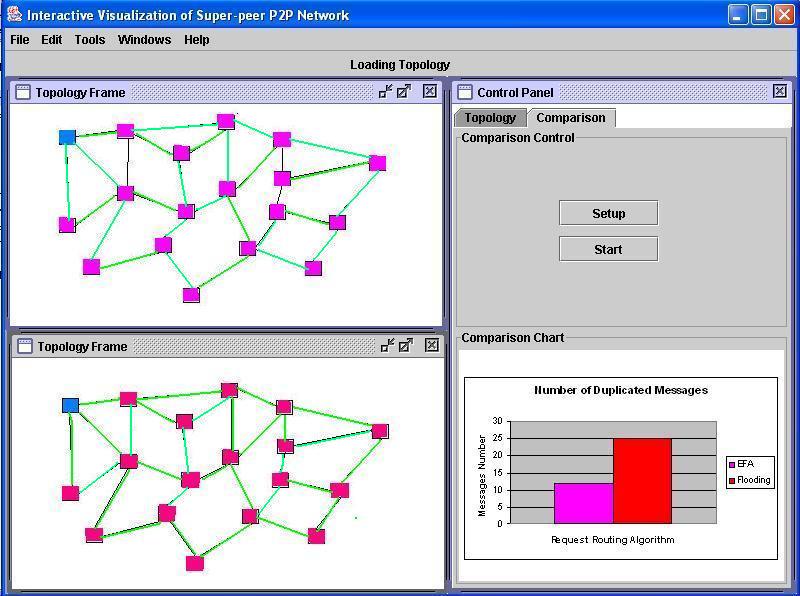
Finally, the user can compare the efficiency of EFA and flooding algorithm. In this view, two flooding algorithms are compared side by side. people can observe that the two networks are in different colors after the algorithms are terminated. It indicates that the simple flooding algorithm tends to receive more duplicated messages. Meanwhile, the bar chart is created to show the actual duplicated messages from running the two algorithms.
Interface
1. Topology view
2. Running EFA algorithm, or comparing EFA and flooding Algorithm.
Implementation approach
I will implement the tool using Java2D and Swing. The toolkit I may use is "InfoVis ToolKit".
Milestones
The milestones are the same as the tasks. I will implement them in the sequence of the tasks' order.
March 25th: complete task #1
April 5th: complete task #2
April 15th: complete task #3