SkyScope
An Aviation Weather Visualization System
CPSC 533C Project Proposal
March 1, 2004
Project Team:
Wesley Coelho coelho@cs.ubc.ca
Bertrand Low low@cs.ubc.ca
Domain, Task and Data Set
The SkyScope System addresses the problem of deciphering and comprehending aviation weather data for the purpose of flight planning. The system is intended for use by pilots flying cross-country flights in light aircraft operating under Visual Flight Rules (VFR). Aircraft operating under VFR cannot enter clouds and must maintain visual reference to the ground at all times. Flights in this category are often further restricted by the aircraft and pilot’s ability to handle other weather conditions such as high winds. Therefore, VFR pilots are required to plan cross-country flights carefully to ensure that weather conditions are suitable for this type of flight.
To help pilots with flight planning, aviation weather reports and forecasts are available for airports along the proposed route. Unfortunately, this information is only provided in a cryptic and difficult to interpret text format. The following weather report is an example of the data set that a pilot must understand in order to plan a flight. This data is the weather report and forecast for just three airports. Pilots will often require information from several more airports for a cross-country flight.
|
|
|
ABBOTSFORD/BC |
|
METAR CYXX 260100Z 00000KT 25SM -RA FEW025 BKN040 OVC060 07/04 A2945 |
|
RMK SF1SC6SC2 SLP973= |
|
METAR CYXX 260200Z 36002KT 30SM SCT040 BKN070 OVC100 07/03 A2941 RMK |
|
SC3AC2AC2 OCNL LGT RA SLP962= |
|
METAR CYXX 260300Z 02003KT 15SM -RA BKN040 OVC070 07/03 A2941 RMK |
|
SC6AC2 SLP959= |
|
|
|
TAF CYXX 252343Z 260024 03010KT P6SM -RA SCT030 BKN050 OVC070 TEMPO |
|
0007 5SM -RA BR BKN025 |
|
FM0700Z 03005KT P6SM SCT030 BKN050 TEMPO 0724 P6SM -SHRA BKN030 |
|
BECMG 1416 07010KT |
|
RMK NXT FCST BY 06Z= |
|
|
|
VANCOUVER/VANCOUVER INTL/BC |
|
METAR CYVR 260100Z 09014G19KT 12SM -SHRA SCT025 OVC040 07/04 A2944 |
|
RMK SF3SC5 SLP969= |
|
METAR CYVR 260200Z 08011G16KT 15SM -SHRA SCT025 OVC040 07/04 A2942 |
|
RMK SC3SC5 SLP963= |
|
METAR CYVR 260300Z 06005KT 15SM -SHRA FEW025 BKN040 OVC055 07/04 |
|
A2941 RMK SF2SC5SC2 PCPN VRY LGT SLP959= |
|
SPECI CYVR 260312Z 05007KT 15SM FEW025 BKN040 OVC055 RMK SF2SC5SC2= |
|
|
|
TAF CYVR 260250Z 260324 09012G22KT P6SM -RA SCT020 BKN040 OVC070 |
|
TEMPO 0306 5SM -RA BR BKN020 OVC040 |
|
FM0600Z 09012G22KT P6SM SCT025 BKN040 |
|
TEMPO 0612 6SM -SHRA BR BKN025 |
|
FM1200Z 09010KT P6SM SCT020 BKN040 OVC060 |
|
TEMPO 1220 4SM -SHRA BR BKN020 OVC040 |
|
FM2000Z VRB03KT P6SM BKN040 TEMPO 2024 P6SM -SHRA |
|
BECMG 2123 31008KT |
|
RMK NXT FCST BY 06Z= |
|
|
|
NANAIMO/BC |
|
METAR CYCD 260100Z 00000KT 8SM -RA FEW008 BKN028 OVC050 06/05 A2944 |
|
RMK SF1SC6SC1 SLP970= |
|
METAR CYCD 260200Z 00000KT 10SM -RA MIFG FEW006 BKN028 OVC050 05/05 |
|
A2941 RMK SF1SC5SC2 SLP961= |
|
METAR CYCD 260300Z 00000KT 6SM -RA BR FEW006 SCT010 BKN014 OVC040 |
|
05/05 A2942 RMK SF2ST2SC3SC1 SLP962= |
|
|
|
TAF CYCD 260135Z 260205 16005KT P6SM -SHRA SCT010 BKN025 OVC050 TEMPO |
|
0205 4SM -SHRA BR SCT010 BKN020 |
|
RMK NXT FCST WILL BE ISSUED AT 261545Z= |
The pilot’s task is to decode and synthesize this information to generate a mental picture of the weather conditions. The mental weather picture should include not only the weather for several airports, but also for each airport at multiple times in the future. This task is time consuming and imposes a high cognitive load. In the event that a flight plan is altered or weather information has been forgotten, the attention required for piloting the aircraft can often preclude mental weather data processing en route.
Personal Expertise
Team member Wesley Coelho has held a private pilot license for 9 years. As is typical of pilots with this category of license, Wesley does not fly often enough to have developed the ability to decode and synthesize weather data at a glance. However, 130 hours of flight under Visual Flight Rules (VFR) have given him a strong understanding of the weather issues involved in planning flights under these rules.
Wesley is also a member of the Pacific Flying Club and UBC Aviation Club. We believe that other members of these clubs will provide additional expertise and guidance to this project.
Proposed Solution
The proposed information visualization solution is to present weather information as “weather glyphs” on a timeline stack. In this visualization, a horizontal timeline is used to anchor weather information at the time it was observed in the past or forecasted for the future. A timeline for each airport is arranged in a vertical stack so that the time on each airport’s timeline will correspond. Weather glyphs representing past or future weather for each airport are presented at the appropriate position on the timeline.
Weather glyphs are designed to convey several dimensions of weather information in an intuitive and rapidly accessible way. The following parts of a weather report are presented by each weather glyph:
Cloud Layers
The nature and altitude of cloud layers is perhaps the most crucial information required for safe VFR flight. The weather glyph displays cloud layers as horizontal rows of cloud icons. The cloud icons are positioned at the reported altitude, which is read from a vertical absolute scale. The number of cloud icons corresponds to the proportion of the sky that is covered by that layer. For example, a “scattered” layer occupies 4/8 of the sky by definition. Therefore, scattered layers are represented by four cloud icons.
Wind Speed & Direction
Wind direction is displayed using an arrow overlaid on a circular representation of a compass. Wind speed is displayed using a number placed below the compass. An additional horizontal bar may also be used to represent wind speed. This bar would mimic the appearance of a windsock. Alternatively, a vertical bar may be desirable for comparing wind speeds over time.
Visibility
Visibility is indicated with a right-pointing triangle. Longer triangles represent higher visibility while shorter bars indicate low visibility. The visibility is also displayed as a number beside the visibility triangle.
Precipitation
Simple icons are used to indicate the presence of various forms of precipitation.
Temperature & Dew Point
A vertical bar is used to indicate the temperature, although the actual value is also displayed as a number. The dew point is the temperature at which the air will become saturated with moisture and most likely lead to the formation of clouds or fog. The spread between the current temperature and dew point is therefore a critical measure of safety for VFR flights. The dew point is shown on the same vertical bar as the temperature so that the size of the temperature – dew point spread is clearly visible.
The SkyScope system also provides sliders that allow pilots to specify the minimum weather conditions suitable for their aircraft, flight path and piloting skill. Sliders are provided for the following criteria:
- Minimum lowest cloud layer altitude
- Minimum ceiling altitude
- Minimum visibility
- Maximum wind speed
Once these parameters are specified, each weather glyph will display a Minimum Condition Indicator. This indicator appears in red if any weather condition is outside the specified limit or in green if the weather is suitable given the slider positions.
This visualization allows pilots to observe weather conditions across airports at different times at a glance. Improving or deteriorating weather trends are clearly visible. Furthermore, it is possible to draw a diagonal line through the timelines that indicates the estimated time at which the aircraft will pass each airport. This line draws attention to the weather around the estimated arrival time at each airport.
Usage Scenario
John A. Viator is planning a flight from Abbotsford to Nanaimo. Since the weather conditions are marginal, John downloads weather reports and forecasts for the airports along his route: Abbotsford, Vancouver and Nanaimo. John then pastes the weather information into the SkyScope applet. The applet asks John to specify the order in which he will fly over each airport and then constructs the stacked timeline display with the first airport at the top and the last airport at the bottom.
John analyzes the weather information and finds that the current weather is unsuitable for the flight, but conditions are improving. He then specifies his minimum safe weather conditions for this flight using the provided slider controls. The minimum condition indicators appear on the weather glyphs. Although the glyphs for the current time are red, indicating poor conditions, the indicators for weather glyphs later in the day appear in green. John considers delaying his flight until the weather is expected to improve at the departure airport. He then specifies the proposed arrival times at each airport. The system displays diagonal lines from the estimated departure time at one airport to the estimated arrival time at the next airport on the timeline below. The weather glyphs around each intersection of route line and timeline indicate that the weather will be suitable when he arrives at each airport.
Later in the day, the weather improves as forecast and John departs Abbotsford. En route, he considers a detour for sightseeing over the Vancouver harbour. Before changing his flight plan, John consults the weather visualization briefly while flying. It is immediately clear that the good weather is expected to hold for long enough to delay the arrival time long enough for the planned detour. John continues his flight to his destination with weather information readily accessible when required.
Sketch of Proposed Visualization
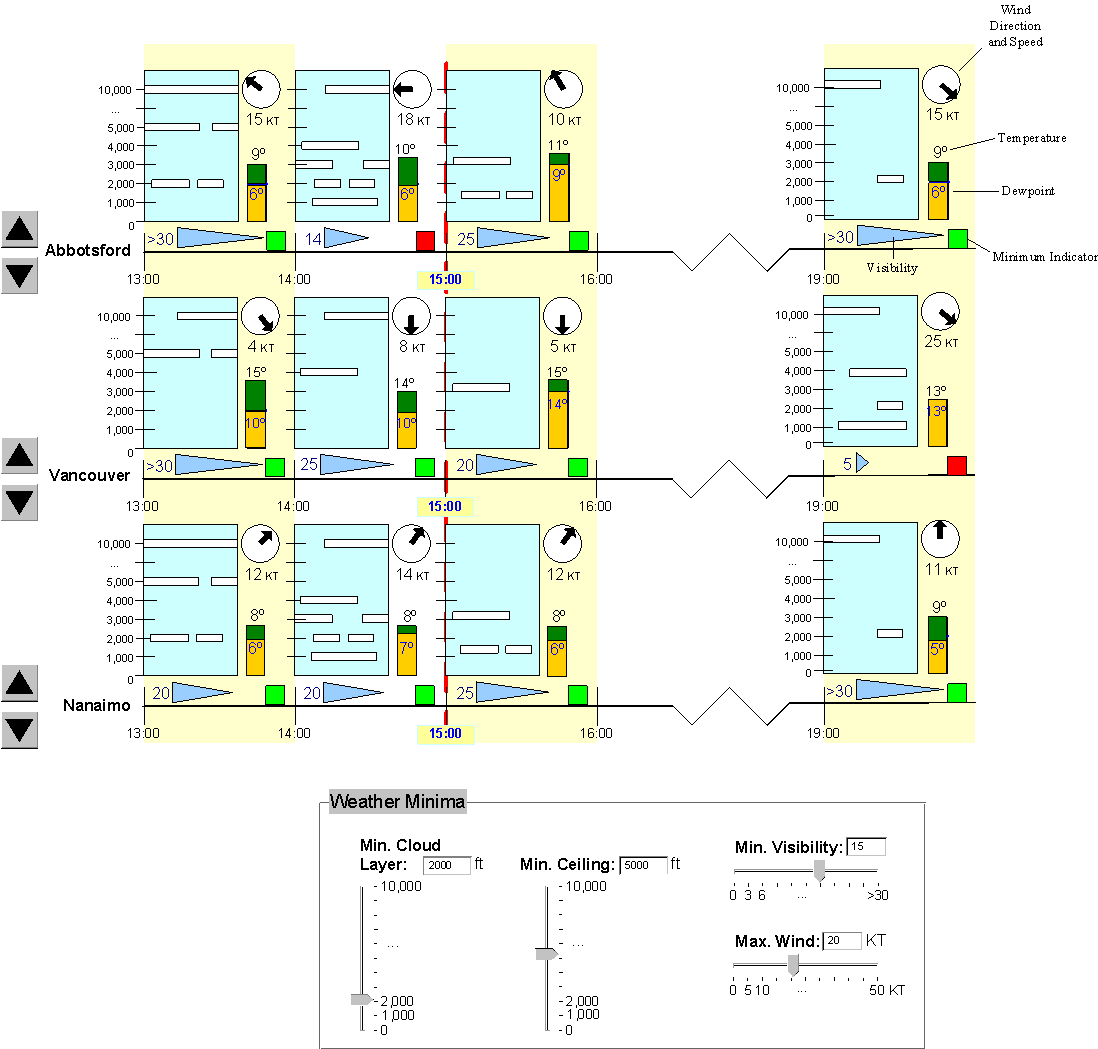
Click image to view full size.
Implementation Approach
We propose to build the SkyScope system using Java. The window and widgets will be implemented using the Swing framework while the actual graphical visualization will be created using the Java 2D library.
To allow users to experiment with prototypes of the system, it will be accessible via a web page through a Java applet.
The implementation will consist of three main components:
- Weather data parser
- Java 2D visualization drawing engine
- Java Swing graphical user interface
Milestones
The project development milestones are as follows:
- March 1 - Proposal Submitted.
- March 5 – Paper sketch walkthrough with user completed. Feedback collected for re-design.
- March 15 – Weather data parser complete.
- March 15/17 – Project Update Presentation.
- April 7 – Early display functionality complete (timelines, clouds, min condition indicator).
- April 15 – High fidelity prototype complete (first iteration).
- April 21 – User evaluation and revised design complete. Final presentation.