CSPC 533c
Assignment 1
Micheline Manske
|
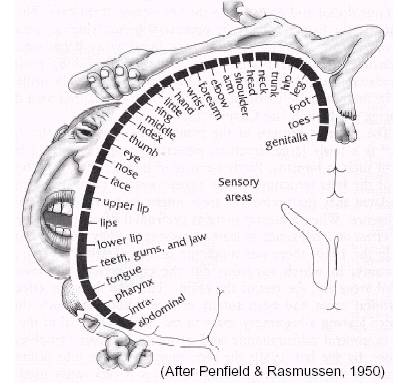
A Good Visualization: Homunculus What parts of your body are the most sensitive to
touch? What areas of the brain are
used in sensing touch? This image
entitled Homunculus (meaning “little man”) answer these questions and provide
additional information about the mapping from skin sensitivity to brain
function. Touch sensation is
processed on the thin surface of the cerebrum called the somatosensory
cortex. Each point on the cortex
contains cells that correspond to the sensory receptors on different parts of
the body. Areas that are quite
sensitive, like the lips, contain more touch receptors and hence account for
more of the area of the brain. In
contrast, the upper arms are less sensitive, have less sense receptors and
are given less representation in the brain.
This visualization depicts these relative densities by way of a
distorted “body” drawn along the outside of the cortex. We can see which
parts of the brain correspond to which body parts and the relative density of
touch receptors. The result is a map
of the body as “sensed” by the cortex. This is an excellent visualization because it makes use of a medium we’re all fond of – pictures. Both the human body and the brain are easily identified by most people in pictorial form, and this is exploited to display information about their connectivity as far as the sense of touch is concerned. We can also obtain from the data the densities of touch receptors on different parts of the body. This additional information is displayed using size which allows for quick visual comparisons of densities on different parts of the body. With few words, no numbers and requiring only a brief introduction, both density and location of touch receptors are clearly portrayed. Overall this makes for a pleasing display that invites further investigation. |
Penfield, W.
& Rasmussen, T., The cerebral cortex of man: a clinical study of
localization of function, Macmillan, New York, 1950. |
|
A Bad Visualization: The Weather If you want to know
whether to bring a warm jacket on your trip to Indianapolis this week, this
is not the visualization for you. A
simple temperature lookup requires a search to see if the city is listed. If
it’s not, you must conjure up a mental map of the United States in your mind
and scan through the entire list looking for the city that’s the closest to Indianapolis. How accurately you can judge temperature
depends on how well you remember your geography. This depiction makes even
a simple data set – temperature predictions for different cities in the U.S.
– unclear. Too many numbers are
cluttered on one page with no obvious way of comparing them. The user must be familiar with the abbreviations
for weather conditions and the meaning of the eight numbers beside each city. The information cannot be obtained by a
first-time user without some explanation.
Additionally, using alphabetical listings, no further insight has been
offered into how the cities are related.
This leaves us with a cluttered representation of an obvious comprehensible
data set. |
The Globe and Mail, Saturday,
January 10, 2004 |