A Good Visualization Example
The following image was taken from pages 38-39 of Time Magazine Canadian Edition, December 8, 2003.
The article was entitled "Why So Many Are Getting Diabetes" by Christine Gorman
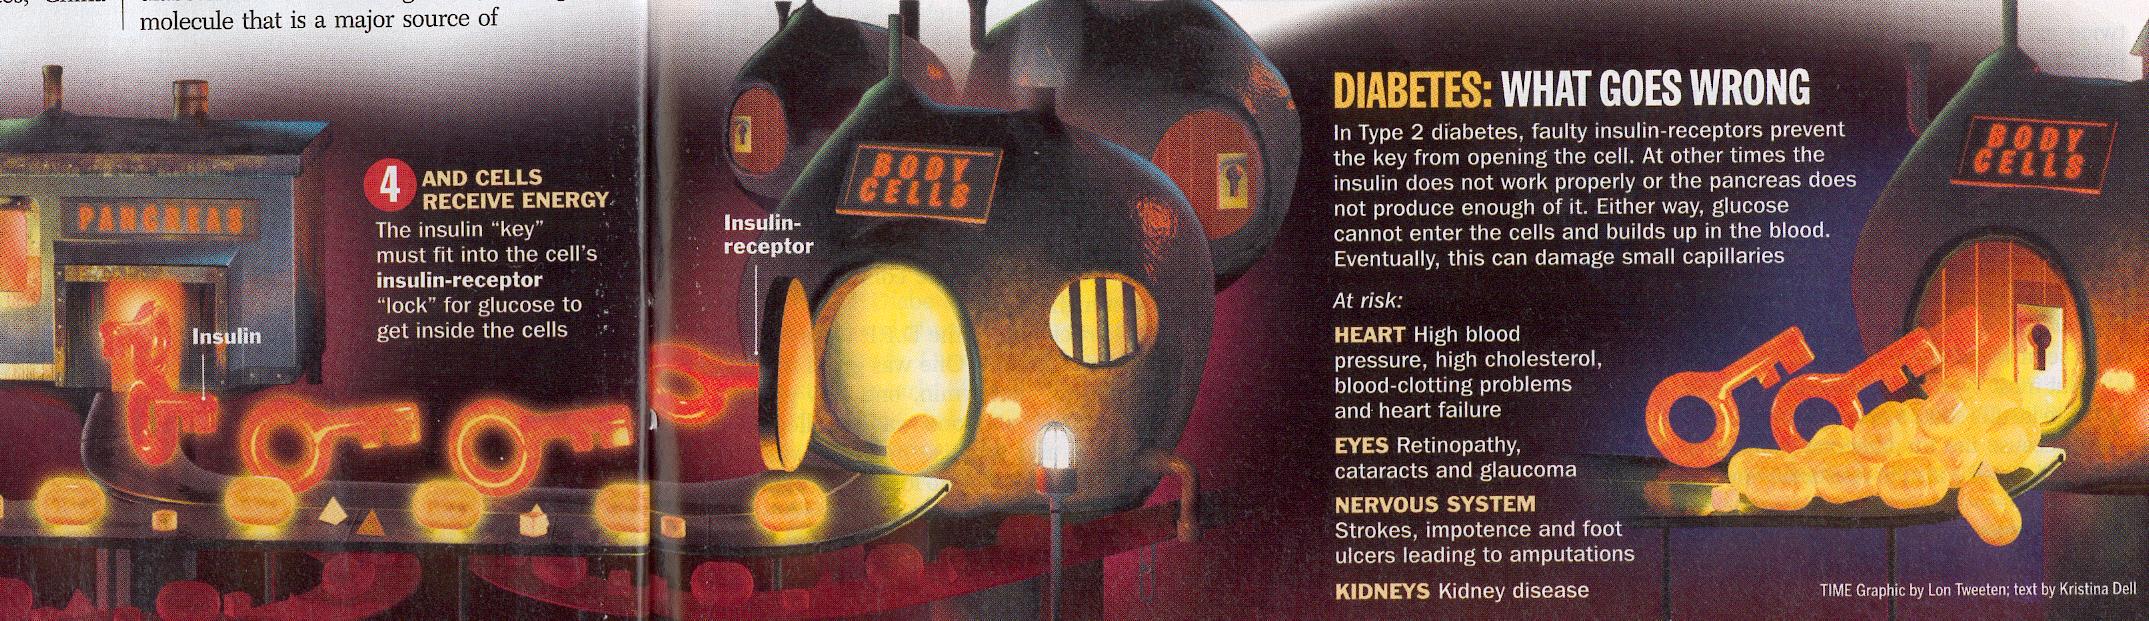 The picture above is an explanatory diagram that illustrates to the user what goes wrong in the body
of someone suffering from Type 2 diabetes. The picture (which is unfortunately incomplete due
to scanning limitations) shows that glucose in the circulatory system are allowed into body cells
by an insulin "key", that in turn must fit into the cell's insulin-receptor. In Type 2 diabetes patients,
the insulin-receptor of the cell is faulty and thus glucose cannot enter the cell and begins to accumulate
in the blood. The accumulated glucose can cause damage to small capillaries.
Glucose is broken down from carbohydrates and is used as energy for the cells.
This diagram clearly illustrates the condition that affects Type 2 diabetes patients. The labelling on the
diagram is clear and the colours used do not distract from the intended purpose of the diagram. Also,
the diagram makes use of the very familiar analogy of "lock" and "key" to describe the relationship
between insulin and insulin-receptor and how it is necessary for them to be functioning properly.
From looking at the diagram, one can get a good understanding of Type 2 diabetes, even without
reading the rest of the article.
The picture above is an explanatory diagram that illustrates to the user what goes wrong in the body
of someone suffering from Type 2 diabetes. The picture (which is unfortunately incomplete due
to scanning limitations) shows that glucose in the circulatory system are allowed into body cells
by an insulin "key", that in turn must fit into the cell's insulin-receptor. In Type 2 diabetes patients,
the insulin-receptor of the cell is faulty and thus glucose cannot enter the cell and begins to accumulate
in the blood. The accumulated glucose can cause damage to small capillaries.
Glucose is broken down from carbohydrates and is used as energy for the cells.
This diagram clearly illustrates the condition that affects Type 2 diabetes patients. The labelling on the
diagram is clear and the colours used do not distract from the intended purpose of the diagram. Also,
the diagram makes use of the very familiar analogy of "lock" and "key" to describe the relationship
between insulin and insulin-receptor and how it is necessary for them to be functioning properly.
From looking at the diagram, one can get a good understanding of Type 2 diabetes, even without
reading the rest of the article.
A Bad Visualization Example
The following image was taken from page 39 of the Chemistry 205 textbook, "The Elements of Physical
Chemistry with Applications in Biology" Third Edition by Peter Atkins.
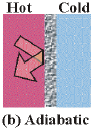 The picture above is an explanatory diagram that attempts to illustrate the meaning of a Thermodynamics
term known as Adiabatic. A system (i.e. the subject under study) is described as adiabatic
when the system changes by a process with constant heat q.
Unfortunately, this diagram is misleading and inaccurate. The diagram seems to imply that the system
has two separate thermal entities (a hot side and a cold side) and that none of the hot air can
enter the cold area of the system due to an impermeable membrane. However, it is wrong to think
of the system as having two opposite thermal regions. The temperature of a system is some mixture
of hot and cold air and there is no "movement" of either hot -> cold or cold -> hot because there
is no separation of hot and cold air. There is also no component in the system that separates opposite
thermic regions. The diagram does not show this and the meaning of adiabatic is unclear from just
looking at the diagram.
The picture above is an explanatory diagram that attempts to illustrate the meaning of a Thermodynamics
term known as Adiabatic. A system (i.e. the subject under study) is described as adiabatic
when the system changes by a process with constant heat q.
Unfortunately, this diagram is misleading and inaccurate. The diagram seems to imply that the system
has two separate thermal entities (a hot side and a cold side) and that none of the hot air can
enter the cold area of the system due to an impermeable membrane. However, it is wrong to think
of the system as having two opposite thermal regions. The temperature of a system is some mixture
of hot and cold air and there is no "movement" of either hot -> cold or cold -> hot because there
is no separation of hot and cold air. There is also no component in the system that separates opposite
thermic regions. The diagram does not show this and the meaning of adiabatic is unclear from just
looking at the diagram.
More Good Visualization Examples
The following image was taken from page 45 of Time Magazine Canadian Edition, November 10, 2003.
The article was entitled "A State in Flames" by J. Madeleine Nash
 The above image illustrates how the fire during California's 2003 wild fire disaster had spread from the
time of Oct. 24, 2003 or earlier to Oct. 31, 2003.
The above image illustrates how the fire during California's 2003 wild fire disaster had spread from the
time of Oct. 24, 2003 or earlier to Oct. 31, 2003.
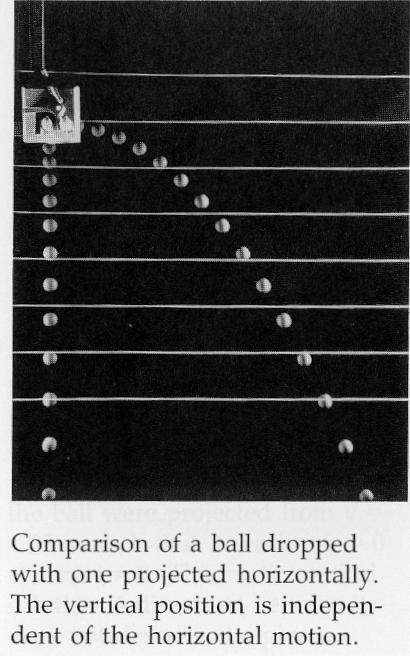
The following image was taken from page 64 of the "Physics for Scientists and Engineers: Volume 1"
Third Edition textbook by Paul A. Tipler.