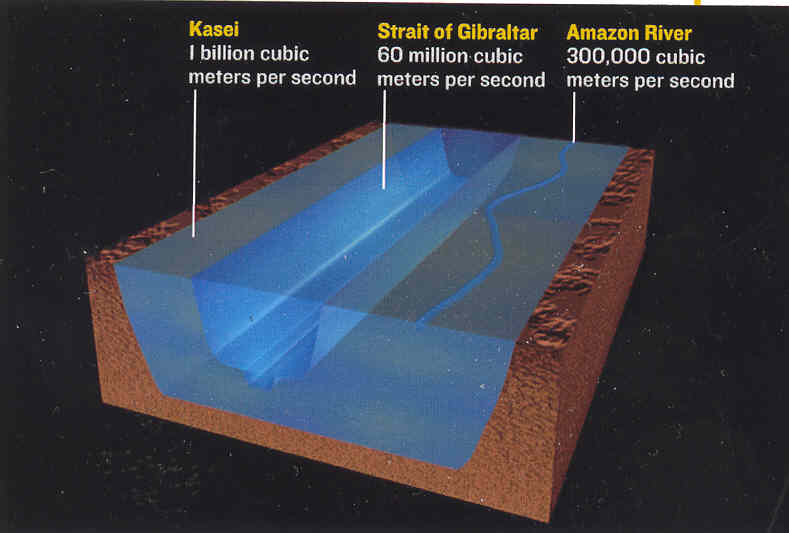
This illustration is from a National Geographic article about the possibility of water and life on the planet Mars. This graphic allows the reader to visualize the size of a Martian canyon, Kasei, that water could have flowed through at a rate of 1 billion cubic meters per second. This flow rate is compared with that of the Strait of Gibraltar and the Amazon River.
I believe this is a good visualization because it allows the reader to quickly and intuitively appreciate the magnitude of "One billion cubic meters per second." This is achieved by visual comparison with the size of familiar waterways, making the information easily accessible to all readers. The image uses the colours brown and blue to symbolize earth and water and place the waterway in the context of the surrounding earth. Shading is used to allow the waterways to be drawn overlapping one another, which saves space and allows them to be more easily compared. Although the visualization itself does not allow accurate comparisons between the waterways, this is not the intent. Instead, image achieves the goal of providing the layperson with a frame of reference for the flow rate at a glance.
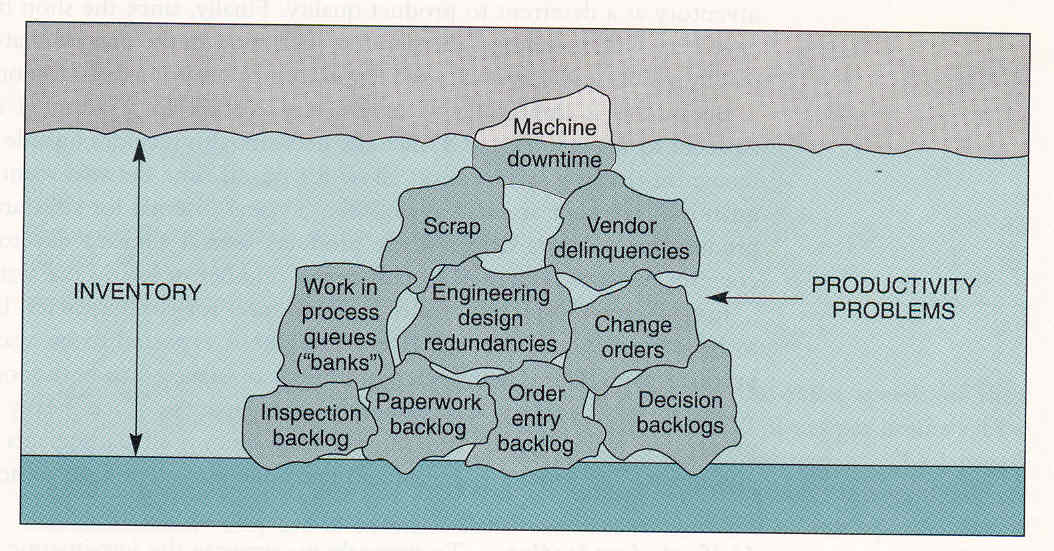
This diagram is from an industrial operations textbook. The diagram provides a visualization of how excess inventory in a business can hide productivity problems. The diagram illustrates a "pond" metaphor where the water level is the level of inventory and productivity problems are represented by rocks. Therefore, it can be seen that higher inventory levels obscure productivity problems.
I believe this illustration provides little information and could be replaced with a bulleted list of productivity problems that could be obscured by high inventory levels. A large portion of the information provided by the graphic is either meaningless or left to the reader's interpretation. For example: