ggplot2 & Shiny (R)
ggplot2 is an R package for creating visualizations based on The Grammar of Graphics (Wilkinson, 2005). Similar to Vega-lite, you can declaratively specify how data values map to properties of graphical primitives. ggplot2 is included in a popular collection of data science packages called tidyverse.
Shiny is an R package for creating interactive web applications with R. By combining ggplot2 and Shiny, you can implement powerful interactive visualizations and dashboards.
Pros
- R is one of the most popular languages for statistical programming and ggplot2 became one of the go-to methods for creating R visualizations.
- Quick option for exploratory data analysis.
Cons
- ggplot2 is a high-level visualization grammar and lacks the expressiveness of D3 (i.e., less fine-grained control of how data values map to graphical marks).
- Customizing ggplot2 charts can be cumbersome and may not be intuitive at first.
Resources
Example
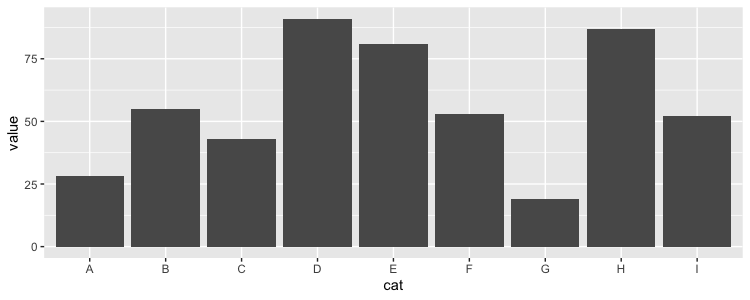
The following ggplot2 code generates the bar chart below.library(ggplot2)
data <- data.frame(
cat = c("A", "B", "C", "D", "E", "F", "G", "H", "I"),
value = c(28, 55, 43, 91, 81, 53, 19, 87, 52)
)
ggplot(data, aes(x=cat, y=value)) +
geom_bar(stat="identity")