Cluster MNIST Digits and Visualize the Cluster Centers
Contents
Setup Data
setSeed(1);
lookfor = 2:4;
nexamples = 2000;
[X,j,y,j] = setupMnist(true,nexamples,0);
clear j;
ndx = ismember(y,lookfor);
X = double(X(ndx,:));
clear y;
Fit
m = fit(DiscreteMixDist('nmixtures',numel(lookfor)),'data',X,'nrestarts',1);
RR: 1, negloglik: 138360
RR: 1, negloglik: 130196
RR: 1, negloglik: 125594
RR: 1, negloglik: 123654
RR: 1, negloglik: 123117
RR: 1, negloglik: 122869
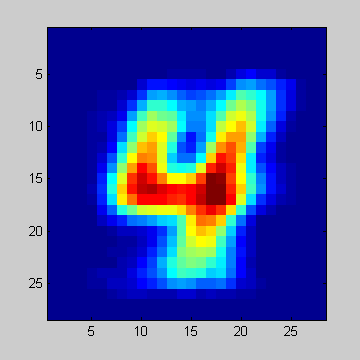
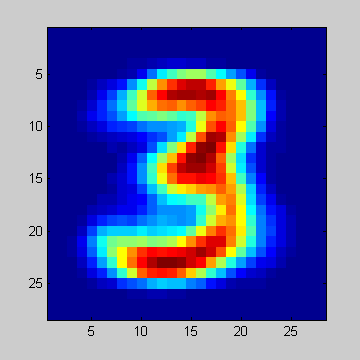
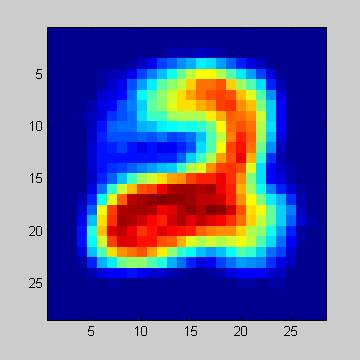
Visualize
for i=1:numel(lookfor)
    figure;
    imagesc(reshape(m.distributions{i}.mu(2,:),28,28));
end
placeFigures('Square',true)
ans =
     1     3
     2     4

Display Samples
if(0)
    for i=1:numel(lookfor)
        figure;
        imagesc(reshape(mean(sample(m.distributions{i},500),1),28,28))
    end
    placeFigures;
end