
Assignment 4: RANSAC and Panorama Stiching
Due: At the end of the day (11:59pm), Friday, November 6, 2020.
The purpose of this assignment is to implement image matching using local invariant features and to create panoramas using the matching routine. The panorama part of the assignment is developed based on here and here.
The zip file containing sample images and code is hw4.zip. This assignment consists of several Python script files (also provided as a single Colab notebook). main_match.py is the main script for the matching part of the assignment; main_pano.py is the main script for the panorama part of the assignment. To make the assignment more tangible, we've implemented some boilerplate code in hw_utils.py, which you SHOULD NOT modify. Your function implementations for the entire assignment should be stored in solution.py. You are free to use main_match.py, main_proj.py and main_pano.py to get started.
The assignment
Q1: SIFT Keypoint Matching
-
This assignment will make use of the SIFT features that are described in the paper Distinctive Image Features from Scale-Invariant Keypoints, by David Lowe. You don't need to read the whole paper, but you may wish to refer to parts of it to understand the approach.
-
The unzipped directory contains a skeleton Python program main_match.py (which you can run by typing
python main_match.pyat the command prompt).
-
(11 points)The sample program, main_match.py, loads two images and their invariant keypoints and then draws 5 lines between randomly selected keypoints to show how matches can be displayed. Your task is to improve this program so that it identifies and displays correct matches by comparing the keypoint descriptor vectors. Note: Your program should find all possible matches, not just 5 as shown in this sample.
The function FindBestMatches in the file solution.py takes the invariant descriptor vectors stored in the numpy arrays descriptors1 for the first image and descriptors2 for the second, and returns a list of index pairs of the matches. Each row corresponds to a descriptor vector. To select the best match for a vector from the first image, you should measure its angle to each vector from the second matrix. As the descriptor vectors are already normalized to have unit length, the angle between them is the inverse cosine (math.acos(x) function in Python) of the dot product of the vectors. The vector with the smallest angle is the nearest neighbor (i.e., the best match).
However, many keypoints from one image will have no good match to the second image. To eliminate false matches, the most effective method is to compare the smallest (best) match angle to the second-best angle. A match should be selected only if this ratio is below a threshold. Hints: The Python function sorted can be used to find the two smallest values in a list. The list method index can then be used to determine the (original) indices of these sorted elements.
Select a threshold that gives mostly good matches for the images ``scene'' and ``book.'' Try different thresholds so that only a small number of outliers are found (less than about 10). You can judge this by eye, as the outliers will usually produce matching lines at clearly different angles from the others. Print the box image showing the set of matches to the scene image for your suggested threshold value. Write a short description of the particular threshold value used, why you chose it and how important it was to get the value correct.
-
(14 points)Now given two images, you could obtain keypoint matches. Unfortunately, there are often lots of erroneous matches in this list. This part of the assignment is designed to take the matches from the previous part and to reduce the number of false matches using RANSAC.
Implement the RANSAC routine to filter out false matches in the function RANSACFilter. In details, for each RANSAC iteration you will select just one match at random, and then check all the other matches for consistency with it. Repeat the random selection 10 times and then select the largest consistent subset that was found. Assume that we are sampling with replacement and that the final consensus set should include the initial match, i.e., the size of consistency set is at minimum 1.
To check other matches for consistency with the first match, you need to use the keypoints1 and keypoints2 arrays that are provided for each image. Each row provides 4 numbers for a keypoint specifying its location, scale, and orientation in the original image (see the function ReadKeys in the file hw_utils.py for details).
To check that one match is consistent with another, you should check that the change of orientation between the two keypoints of each match agrees within, say, 30 degrees. In other words, if the two keypoints for one match have a difference in orientation of 130 degrees, the second match should have an orientation difference between 100 and 160 degrees. It is best to consider an example here. Suppose we want to compare 2 matches for consistency in orientation. The keypoint orientations from the first match are 45 degrees and -45 degrees. The orientation from the second match are 0 and 90 degrees. You should start by computing the difference in orientation for the two matches: d1 = -45 - 45 = -90 and d2 = 90 - 0 = 90. The difference between the two matches in this case is 180 degrees and would be outside the 30 degree tolerance, hence the second match is not part of the consensus set. Note that orientation is measured in radians, and that orientations are equal modulo 2 pi. Also, check that the change of scale agrees within plus or minus, say, 50%. Assuming two keypoints have scales s1 and s2, the change in scale is defined as s2/s1 (see slides). As an example, if the change of scale for our first match is 3, then to be within a consensus set, the second match must have change in scale within the range of 1.5 to 4.5 (assuming scale agreement of plus or minus 50%). For this assignment, we won't check consistency of location, as that is more difficult.
Try different values for the orientation and scale agreement (instead of using 30 degrees and 50% as mentioned above), and raise the matching threshold to get as many correct matches as possible while having only a few false matches. Try getting the best possible results on matching the difficult UBC ``library'' images.
Include resulting library images showing your best set of matches in a PDF. Aslo include in a PDF a paragraph summarizing the effects of consistency checking and the degree to which it allowed you to raise the matching threshold.
Q2: Panorama
-
In this question, you are writing a program to create panoramas. To perform a sanity check on your Python environment, you could run:
python test_pano.py Overview: Given a list of images from the same scene, we can create a panorama by the following process. To simplify things, we pick one image in the image list as the reference image, and all other images are the source images. The ultimate goal is to find a homography matrix for each source image to project it to the reference image frame. A homography matrix is determined by at least 4 matches using direct linear transform (DLT). Since DLT is beyond the scope of this couse, you can compute a homography matrix using the function cv2.findHomography in OpenCV. The matches can be obtained through your FindBestMatches implementation (without using RANSACFilter in Question 1).
Since there will be false matches from FindBestMatches, using those matches would yield an inaccurate homography matrix. Instead, we use RANSAC to obtain a subset of the matches that have very similar homography matrices (a.k.a the consensus set). A match `(p_src, p_ref)` is treated as an inlier if the projection (call it `p_proj`) of the point `p_src` is at most `tol` away from `p_ref` in the reference frame in Euclidean distance. Mathematically, dist(p_proj - p_ref) <= tol and p_proj := ProjToRefFrame(p_src).
At each RANSAC iteration, you randomly select 4 matches to compute the homography matrix. Use the homography matrix to project all keypoints of the source image to the reference frame. Count the number of inliers under this projection, and keep track of the largest consensus set. At the end of the loop, you compute the final homography matrix using the largest consensus set. Then, with the boilerplate code, each source image is warpped to the reference image frame using the final homography matrix. In case of overlapping region between images, a naive weighted average is used so it is normal to see some artifacts on the boundaries of images. Note: you can actually use Laplacian pyramid blending from Assignment 2 to obtain better results here, but this is not required and beyond the scope of the assignment.
HINT: We strongly recommend you to study the file test_pano.py to understand how each component of the boilerplate code interacts with one and another. The file also shows how to make use of some of the OpenCV functions.
The Match function and the MatchRANSAC function in the hw_utils.py file, and the FindBestMatchesRANSAC function in solution.py are the main functions to understand how each component interacts with each other. The Match function does matching without using RANSAC while the MatchRANSAC function does RANSAC.
The FindBestMatchesRANSAC performs the matching and the RANSAC steps. In details, the matching step is done by the FindBestMatches function, which computes matches between two images using acos distance of descriptors and outputs a list of match pairs in the format [(i, j)]. An example for the [(i, j)] format: suppose that descriptors1 and descriptors2 are arrays of descriptors for image 1 and 2, then [(1, 2), (3, 4)] indicates that descriptors1[1] is matched with descriptors2[2] and descriptors1[3] is matched with descriptors2[4]. The RANSACFilter function simply computes a subset of this list by returning the largest consensus set of match pairs.
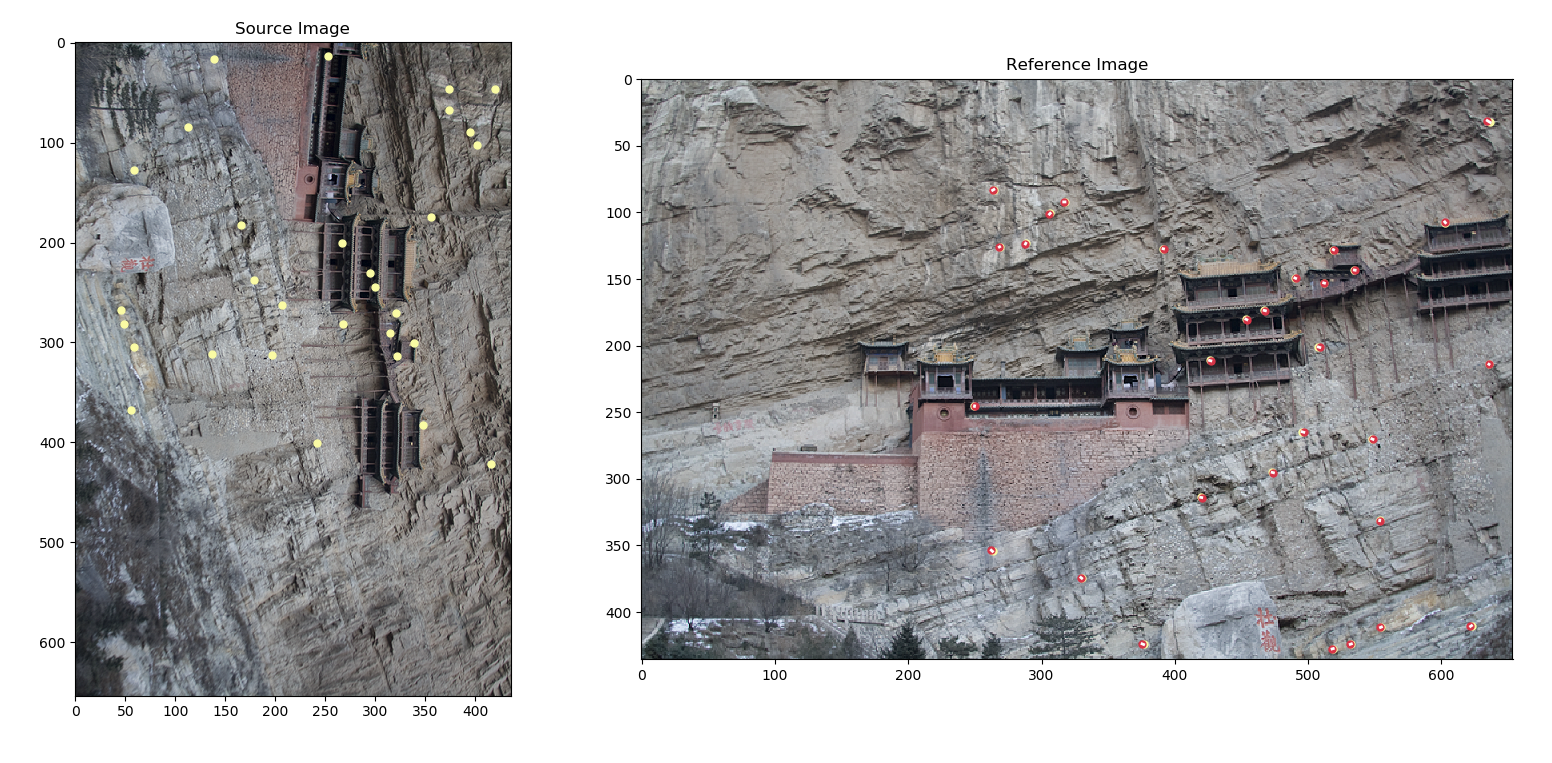
(9 points)Keypoint Projections: To check if a match is an inlier, we have to know how to project 2d points from source image frame to the reference frame using a homography matrix. Your task is to implement the function KeypointProjection(xy_points, h). This function takes in an array of 2d points `xy_points` (in xy format) and project the point using the homography matrix `h`. The code documentation and assertions should give you a sense of input and output formats you need to follow. Hint: You first convert the 2d points to homogeneous coordinate, perform the projection by a matrix multiplication, and convert back the projected points in homogeneous coordinate to the regular coordinate by dividing through the extra dimension. If the extra dimension is zero, you should replace it with `1e-10` to avoid dividing by zero. You can dopython main_proj.pyto visualize your results of projection. The script will project (randomly sampled) keypoints from a source image using the homography matrix we've provided in `test.pkl` into the reference frame. The bright-yellow dots are the points in the source figure. Their projections are plotted in the reference image with the same color. The red dots are the corresponding reference points (remember, we have matches). If your implementation is reasonable, you should obtain a figure similar to this one, where the red and yellow dots overlap a lot. Note that the source image is rotated, but the homography projection captures the rotation.
(13 points)RANSAC Homography: Now that you can project 2d points from the source images to the reference image using a homography matrix. The next step is to use RANSAC to find the biggest consensus set of matches to compute the final homography matrix. In the function RANSACHomography(xy_src, xy_ref, num_iter, tol), the parameters `xy_src` and `xy_ref` store the xy coordinates of matches between a source image and a reference image. The matches are from FindBestMatches.Specifically, you run RANSAC for `num_iter` times. At each iteration, you randomly pick 4 matches of points to compute a homography matrix. Then you project all keypoints in the source image to the reference image using the computed homography matrix. You compute the Euclidean distance between each projected point to its correspondance in the reference frame. If, for a match, the projected point gives a distance no more than `tol`, the match is considered an inlier. The consensus set of this iteration is the set of inliers. Across iterations, you will keep track of the largest consensus set, and at the end of the loop, you compute and return the final homography matrix using the largest consensus set.
Like other questions, we've prepared a script for you to visualize the results. You can run
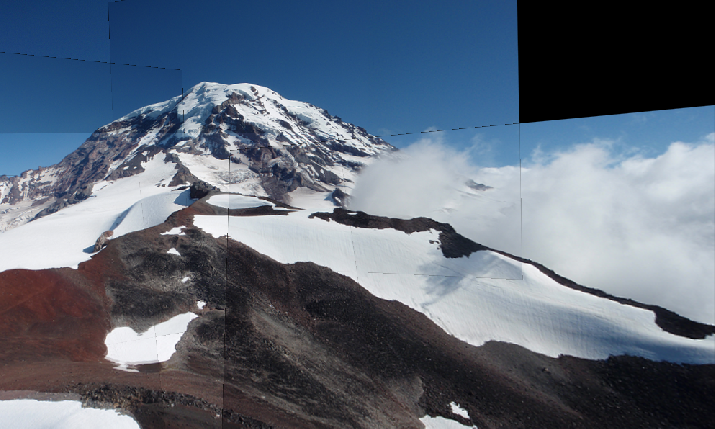
python main_pano.pyYou can change various parameters such as `num_iter`, `tol`, `ratio_thres` in the main_pano.py. Experiment with different combination of `num_iter` and `tol`. How does each of the two parameters contributes to the final panorama result? Include the discussion and the created panoramas in your report. Hint: if you implemented RANSACHomography correctly, and selected the right parameters, you can get a panorama that looks like this. Don't worry about the artifacts on the boundaries. They are from a naive blending implementation.
-
(3 points)Asumming that you've implemented the panorama program correctly, lets apply it to some UBC images! We've collected photos of some landmarks of UBC taken from the fountain, the rose garden (both lower level and upper level), and our Irving library. You can find the images and features under the data folder.Please produce the three panorama named fountain40.png, garden034.png, and irving_out365.png. The order of digits on each photo indicates the order in your panorama program. For example, irving_out_365.png denotes that your reference image is irving_out3.png, and you project irving_out6.png and irving_out5.png into the reference frame. Include these results into your report.
Deliverables
Hand in your functions (i.e., *.py files) or a Colab Notebook and PDF file showing results and answering questions. These must have sufficient comments for others to easily understand the code. Note you will have to hand in,
- the book image showing the set of matches to the scene image for your suggested threshold value
- the library images showing your best set of matches
- panoramas from three different combinations of `num_iter` and `tol`
- discussions or comments if specified
as part of the PDF. Both Python files and PDF should be submitted through Canvas.