
Assignment 2: Scaled Representations, Face Detection and Image Blending
Due: At the end of the day 11:59pm, Tuesday, Februrary 11, 2020.
The purpose of this assignment is to implement and understand the use of normalized cross correlation for object detection in a scaled representations. As well as to experiment with other applications of scaled representations, such as image blending.
Again, there are different ways to import libraries/modules into Python. Styles and practices vary. For consistency (and to make life easier for the markers) you are required to import modules for this assignment exactly as follows:
        from PIL import Image, ImageDraw
        import numpy as np
        import math
        from scipy import signal
        import ncc
The assignment
Part 1: Face Detection
-
The zip file containing ncc.py, sample images and a face template is hw2part1.zip. Download this file to your directory and unzip with the command
unzip hw2.zipThe face template we will use is in the file face_detection_template.jpg and is shown below.

-
(2 points)The first task is to build a scaled representation of the input image. Create a routine pyramid = MakeGaussianPyramid(image, scale, minsize) that creates a pyramid for an image. It returns a list including the original PIL image followed by all the PIL of images of reduced size, using a scale factor of 0.75 from one level to the next. The pyramid should stop when any further reduction in size will make a dimension of the image smaller than minsize. If image is a PIL image, you can use the Python function im.resize((int(x*scale),int(y*scale)), Image.BICUBIC) to reduce the image size at each step. Note: You should also filter the image with a Gussian whos sigma is 1/(2*scale) to avoid antialising artifacts. You can use the code from previous assignment to do this filtering or use scipy.ndimage.gaussian_filter.
-
(3 points)In order to check your pyramid, write a routine ShowGaussianPyramid(pyramid) that will join all the images in the pyramid into one horizontal image and display this result with imshow.
You can combine multiple images into a single image by first creating a blank image of the right size image = Image.new("L", (width, height)) and then pasting existing images into it image.paste(im,(offset_x,offset_y)). Since you will be handing in a PDF version of your pyramids, feel free to initialize unused space with white (rather than black). This will make it look cleaner in the PDF. Note that while for this part it is sufficent to deal with greyscale images, in Part 2 of the assignment will require you to deal with color images, so it maybe worwhile making sure that this function works for color images as well as greyscale.
-
(10 points)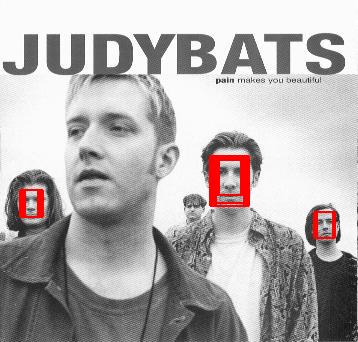 To match a template to a pyramid, write a function FindTemplate(pyramid, template, threshold) that will find and mark all locations in the pyramid at which the normalized cross correlation (NCC) of the template with the image is above the threshold. The goal is to achieve results similar to those on the right, although they will differ depending on the threshold you choose.
Since NCC is an expensive operation and since its cost depends heavily on the size of the template, you should use the minimum possible template size. Try reducing the width to 15 pixels using imresize with bicubic interpolation. Define a constant for template width so that it is easy to experiment with other sizes.
As you saw in Assignment 2, the Scipy Signal Processing toolbox has a function signal.correlate2d. But, this is not normalized cross-correlation. NCC needs to normalize its two inputs correctly: the template (once, since it doesn't change), and each window in the image at which the template is positioned (which, of course, changes with each position). Normalization adjusts the template and each window to have zero mean and unit magnitude.
You can compute the NCC using the function normxcorr2D provided. If image is a PIL image and template is the PIL template, then ncc.normxcorr2D(image, template) returns the array of cross-correlation coefficients, in the range -1.0 to 1.0. The returned array is the same size as image. The function, normxcorr2D, makes use of signal.correlate2d. It is not a particularly efficient implementation, but it is sufficient for our purposes. ASIDE: For an efficient implementation of NCC, one would generally link to external (non-Python) libraries, like OpenCV. For a general discussion of NCC implementation issues, see J.P. Lewis, Fast Normalized Cross-Correlation.
For each pixel at which the normalized correlation result is above the threshold, draw lines (forming a rectangle) to mark the boundary of the template at that location. All lines should be shown overlayed on the original image (the first image in the pyramid), which means that template matches at other scales will need to be adjusted by the right scale factor (i.e., by the right power of 0.75).
To draw lines in a PIL image, use the routine draw.line in the ImageDraw module. For example, if im is a PIL image,
draw = ImageDraw.Draw(im) draw.line((x1,y1,x2,y2),fill="red",width=2) del drawSince the face template was extracted from one of the faces in the judybats image, it will have a strong correlation with that location, which should help to make debugging the location output easier.
-
(5 points)Once your code is working, adjust the threshold to achieve close to an equal error rate on the six given images (judybats, students, tree, family, fans, sports) considered together. An equal error rate is where the number of non-faces seen as faces (false positives) equals the number of missed faces (false negatives). You can do this by just trying different thresholds and counting the number of non-faces seen as faces and the number of missed faces.
-
(5 points)For question 5, what is the recall rate of the program on each image? The recall rate is defined here: Precision and recall. Explain why the NCC method has a very low recall rate on some images.
Part 2: Image Blending
In this part of the assignment you will implement and experiment with pyramid-based image blending. Pyramid-based image blending was introduced by Burt & Adelson in their paper in 1983 and is an effective way to seamlessly compose images. You may want to read Section 3.2 of the paper that describes the original algorithm. This technique is also often used to build image mosaics or to stich image panoramas (which will come handy for us later). Pyramid image blending works by blending the Laplacian pyramids of two input photos using a Gaussian pyramid mask.
-
The zip file containing pairs of images for blending and corresponding masks is hw2part.zip. All data is curtecy of Fernando Flores-Mangas. Download this file to your directory and unzip with the command:
unzip hw2part2.zip -
(3 points)The first task is to build a Laplacian scaled representation of the two input PIL images loaded from orchard.jpg and violet.jpg shown below. Note that these are taken with differet focal length setting on the camera, so while the scene is identical only one of the plants is in focus (either the one in front or the one in the back).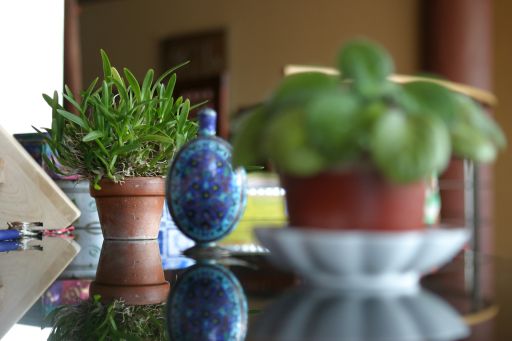
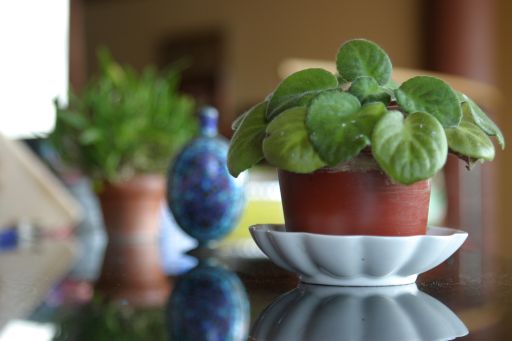
Create a routine pyramid = MakeLaplacianPyramid(image, scale, minsize) that creates a Laplacian pyramid for a PIL image. It should return a list of ``images'' including the Laplacian at a resolution of the original PIL image, followed by all the Laplacian ``images'' of reduced size, using a scale factor of 0.75 from one level to the next. The pyramid should stop when any further reduction in size will make a dimension of the image smaller than minsize. The easiest way to construct a Laplacian pyramid is by first constructing a Gaussian one (re-use MakeGaussianPyramid function from Part 1 ensuring that it works for RGB image inputs) and then taking differences of Gaussian pyramid levels and their smoothed variants. Note: The highest level (lowest resolution) of both Gaussian and Laplacian pyramid is the same and both pyramids should have the same numeber of levels.
-
(2 points)In order to check your pyramid, write a routine ShowLaplacianPyramid(pyramid) that will join all the images in the pyramid into one image and display this result with imshow. The arrangement of layers and most of the code should reamble Gaussian pyramid in Part 1; unlike Part 1, however, you will need to deal with RGB images. Further, you should be careful when displaying Laplacyan pyramids as all but the last level will contain values in the range -128 to 128 if you are working with image pixels in 0 to 255 range (or between -0.5 and 0.5 if you normalized the range to 0 to 1). Hence you will need offset (and possibly scale) the levels before displaying, similar to what you did for a high-pass filtered images in Assignment 1. Since you will be handing in a PDF version of your pyramids, feel free to initialize unused space with white (rather than black). This will make it look cleaner in the PDF. Visualize Laplacian pyramid for both orchard.jpg and violet.jpg images. -
(5 points)Buld a function that takes a Laplacian pyramid and reconstructs Gaussian pyramid of that image from a Laplacian one, gPyramid = ReconstructGaussianFromLaplacianPyramid(lPyramid). The procedure is recursive. You start from the highest level of the Laplacian pyramid (smallest resolution) upsample it to match the resolution of the next level and add that level to the upsampled version to obtain a corresponding Gaussian level. You can use im.resize((width,height), Image.BICUBIC) to carry out upsampling. Note: The last level of the Laplacian pyramid is a small resolution image, same as in Gaussian pyramid, so that level can be just coppied over. Use ShowGaussianPyramid(pyramid) function from Part 1 to visualize the two reconstructed Gaussian pyramids to ensure the function is working. -
(2 points)Now construct a Gaussian pyramid of the orchard_mask.bmp image using MakeGaussianPyramid function from Part 1. Visualize the pyramid using ShowGaussianPyramid(pyramid) function from Part 1. -
(5 points)In the final step you need to compose the two Laplacian pyramids, level by level, using Gaussian pyramid levels as masks. You can use PIL.Image.composite(image1, image2, mask) to do this. You should end up with a Laplacian pyramid that contains the output of the blend. Now use the ReconstructGaussianFromLaplacianPyramid function to construct an output Gaussian pyramid and display the highest resolution level, which should correspond exactly to the size of the two input images. Your result should look something like this: -
(3 points)Experimnt with additional pairs provided in the zip file. This includes blue_cup.jpg and green_cup.jpg, as well as apple.jpg and tomato.jpg. Feel free to create your own blends as well.
Deliverables
You will hand in your assignment ellectronically through Canvas. You should hand in two files, a file containig your code (i.e.,copies of your functions in a single *.py file). These must have sufficient comments for others to easily use and understand the code. You will lose marks for insufficient or unclear comments or poorly designed code. In addition, hand in a single PDF document showing:
- Part 1
- scripts (i.e., records of your interactions with the Python shell) showing the specified tests of your functions
- an image showing the result of ShowGaussianPryramid (for one of the test images)
- your final selected threshold
- images with the face detections for your final selected threshold for all six images
- Part 2
- output of the ShowLaplacianPyramid for orchard.jpg
- output of the ShowLaplacianPyramid for violet.jpg
- output of the Gaussian pyramid reconstruction obtained using ShowGaussianPyramid after calling ReconstructGaussianFromLaplacianPyramid on orchard.jpg
- output of the Gaussian pyramid reconstruction obtained using ShowGaussianPyramid after calling ReconstructGaussianFromLaplacianPyramid on violet.jpg
- output of the ShowGussianPyramid for the mask
- image showing final blended output for orchard-violet as well as blue_cup-green_cup and apple-tomato pairs
The PDF file has to be organized and easily readible / accessible.