Cerebral: Visualizing Multiple
Experimental Conditions on a Graph
with Biological Context
Aaron Barsky
Abstract
Systems biologists use interaction graphs to model the behaviour
of biological systems at the molecular level. In an iterative
process, such biologists observe the reactions of living cells
under various experimental conditions, view the results in the context
of the interaction graph, and then propose changes to the graph model.
These graphs represent dynamic knowledge of
the biological system being studied and evolve as new insight is gained
from the experimental data. While numerous graph layout and drawing packages
are available, these tools did not fully meet the needs of our immunologist
collaborators. In this thesis, we describe the data display
needs of these immunologists and translate these needs into
visual encoding decisions.
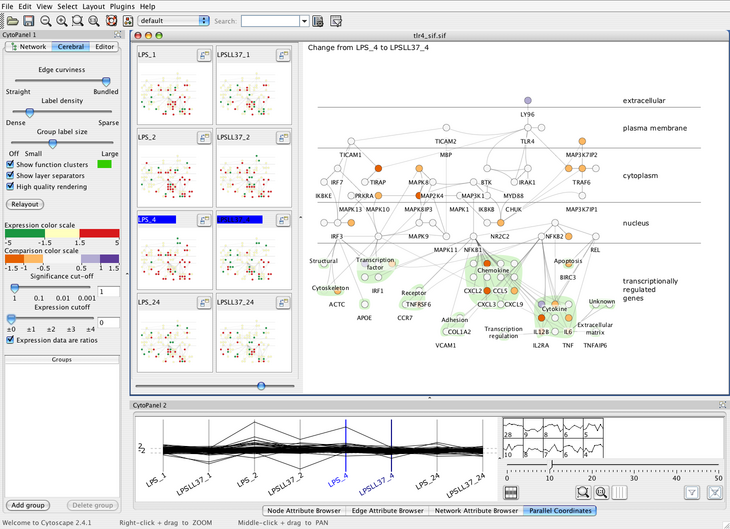
These decisions led us to create Cerebral, a system that uses a biologically
guided graph layout and incorporates experimental data directly into the
graph display. Our graph layout algorithm uses simulated annealing with
constraints, optimized with a uniform grid to have an expected runtime
of O(E√V).
Small multiple views of different experimental conditions
and a measurement-driven parallel coordinates view enable correlations
between experimental conditions to be analysed at the same time
that the measurements are viewed in the graph context. This combination of
coordinated views allows the biologist to view the data from many
different perspectives simultaneously. To illustrate the typical
analysis tasks performed, we analyse two datasets using Cerebral.
Based on feedback from our collaborators, we conclude that Cerebral
is a valuable tool for analysing experimental data in the context
of an interaction graph model.
Video
Software
Talk