Insight:
In all of our other examples we described our actions at a relatively
high level. In this case, we will give the full details of the
interaction that the user would do in order to replicate these
pictures.
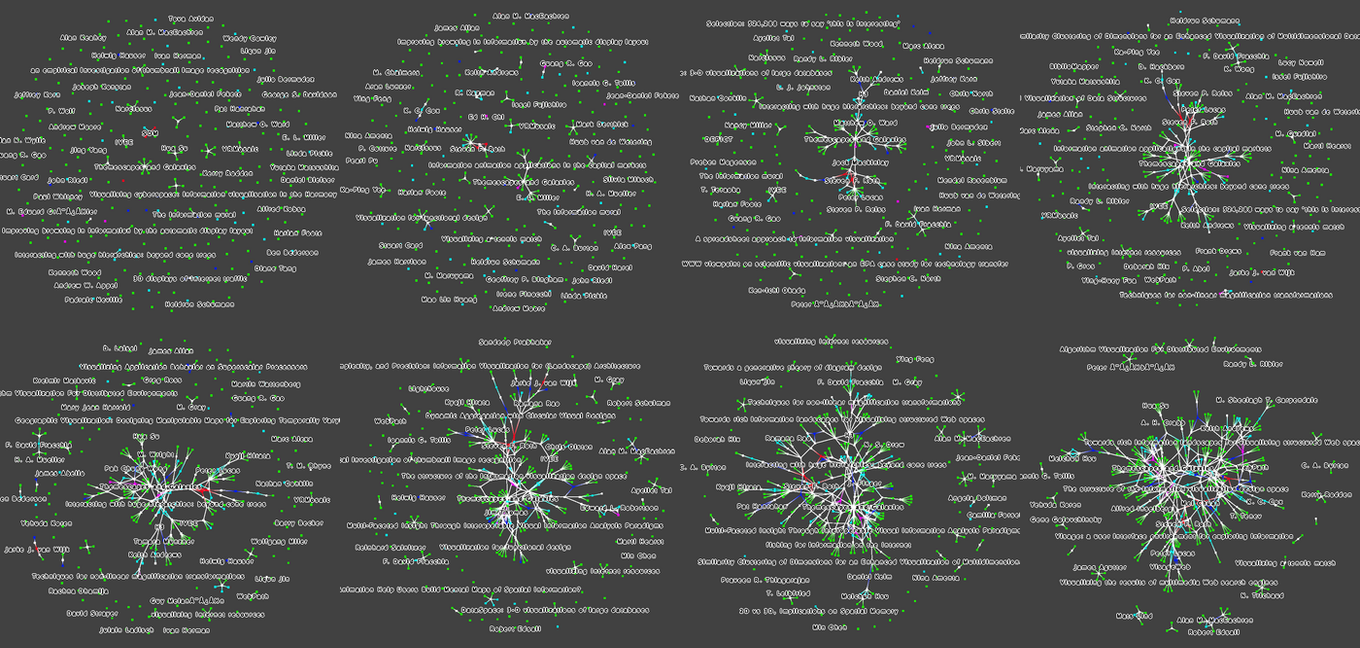
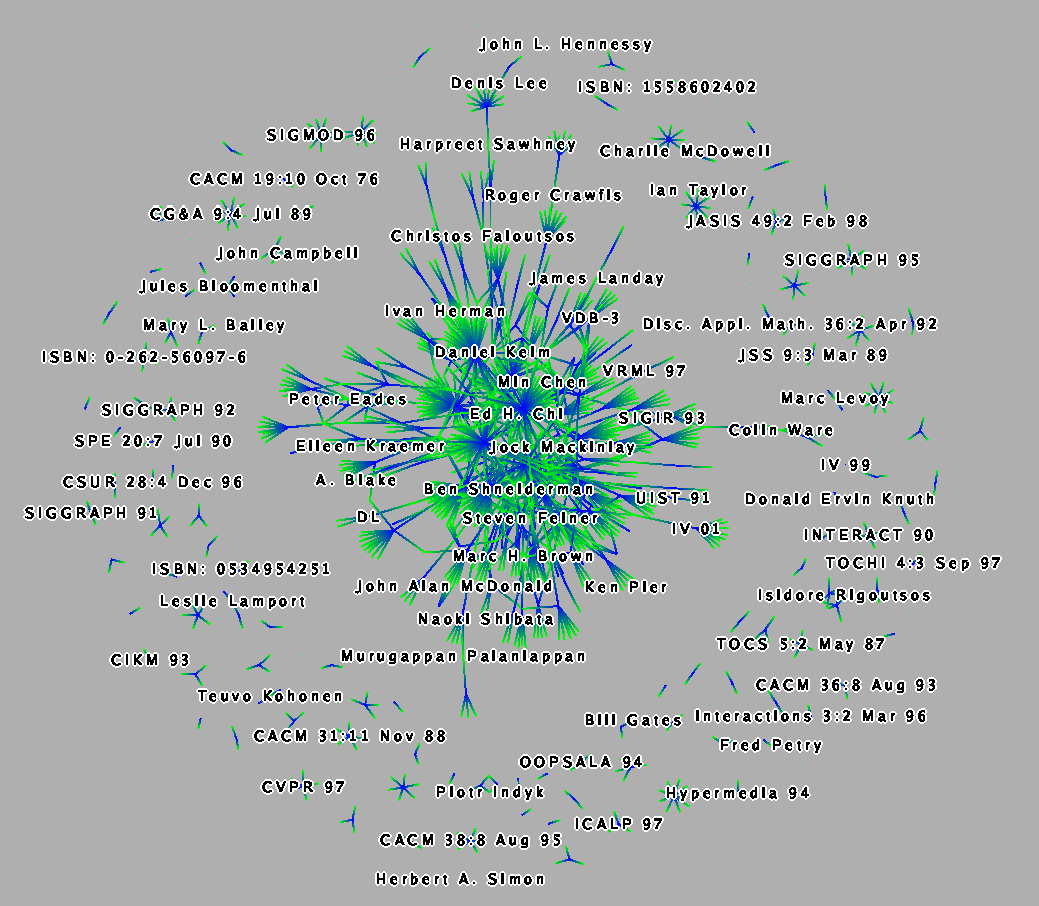
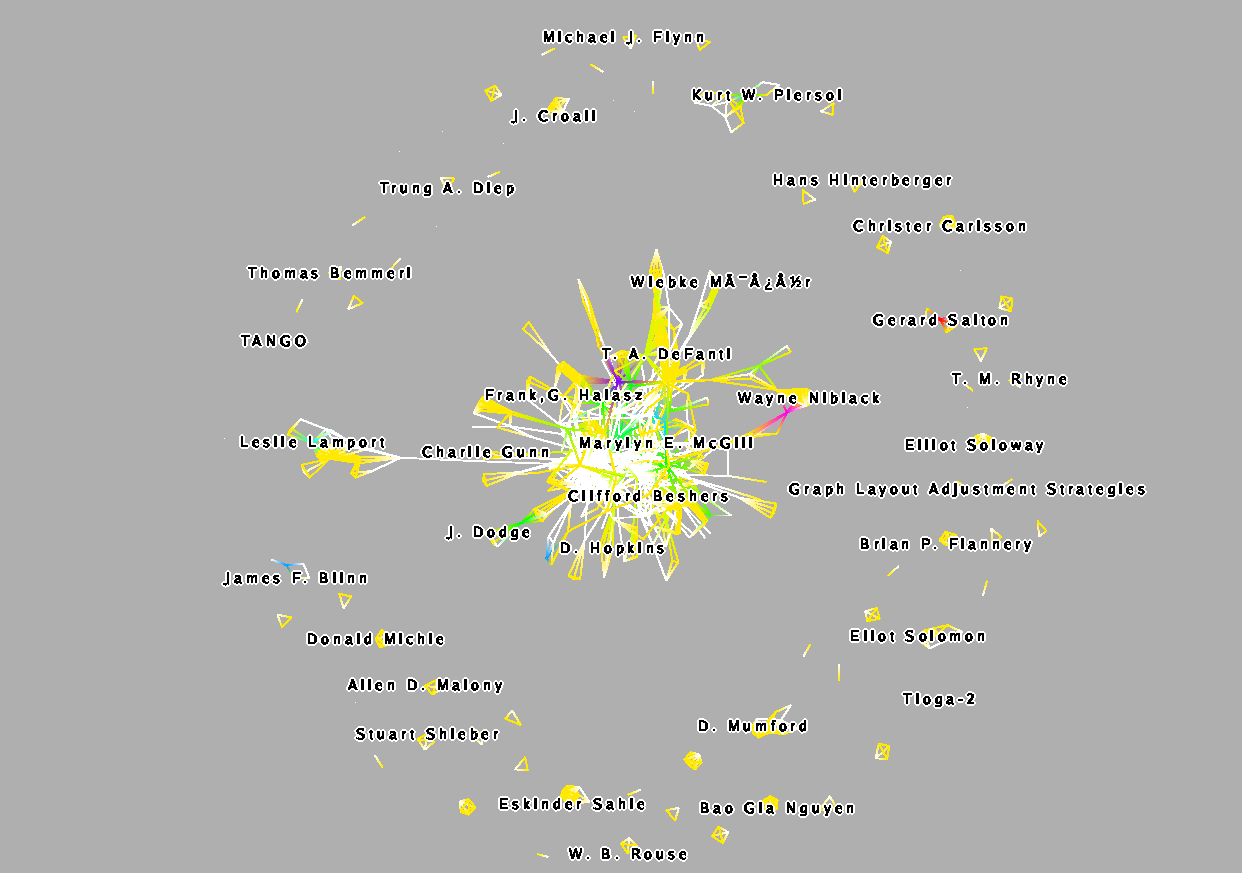
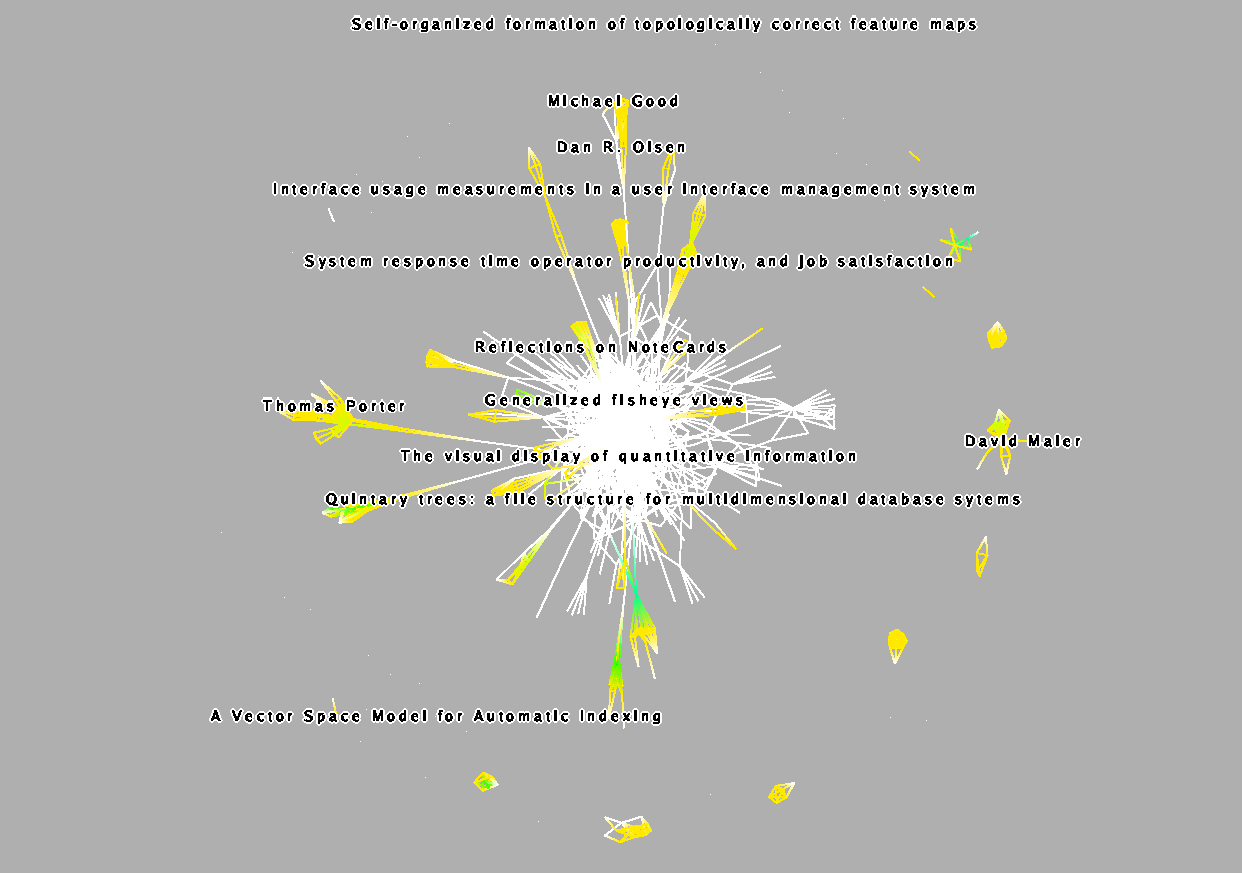
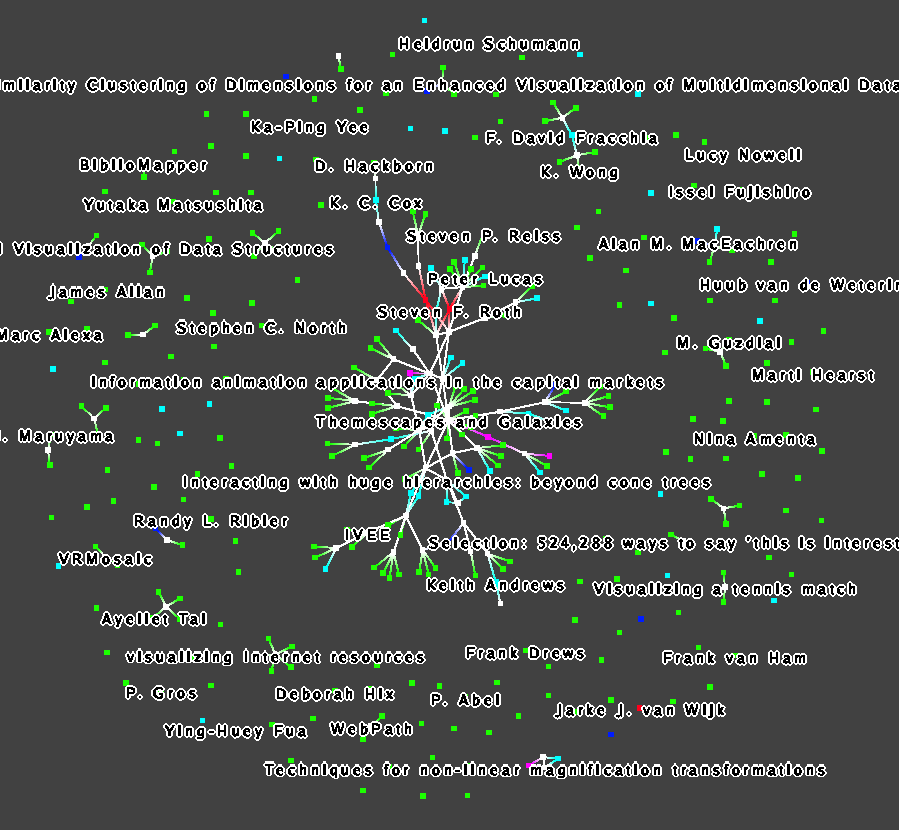
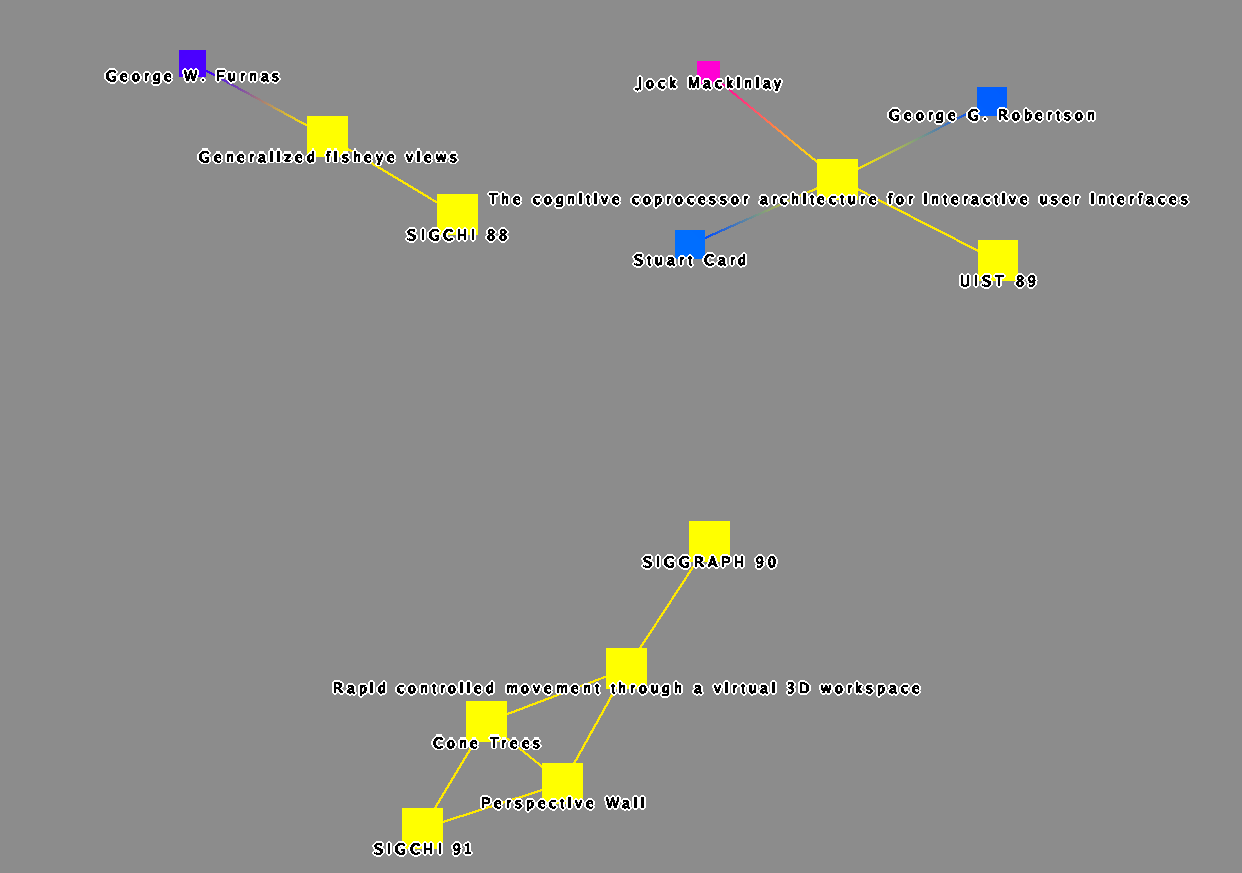
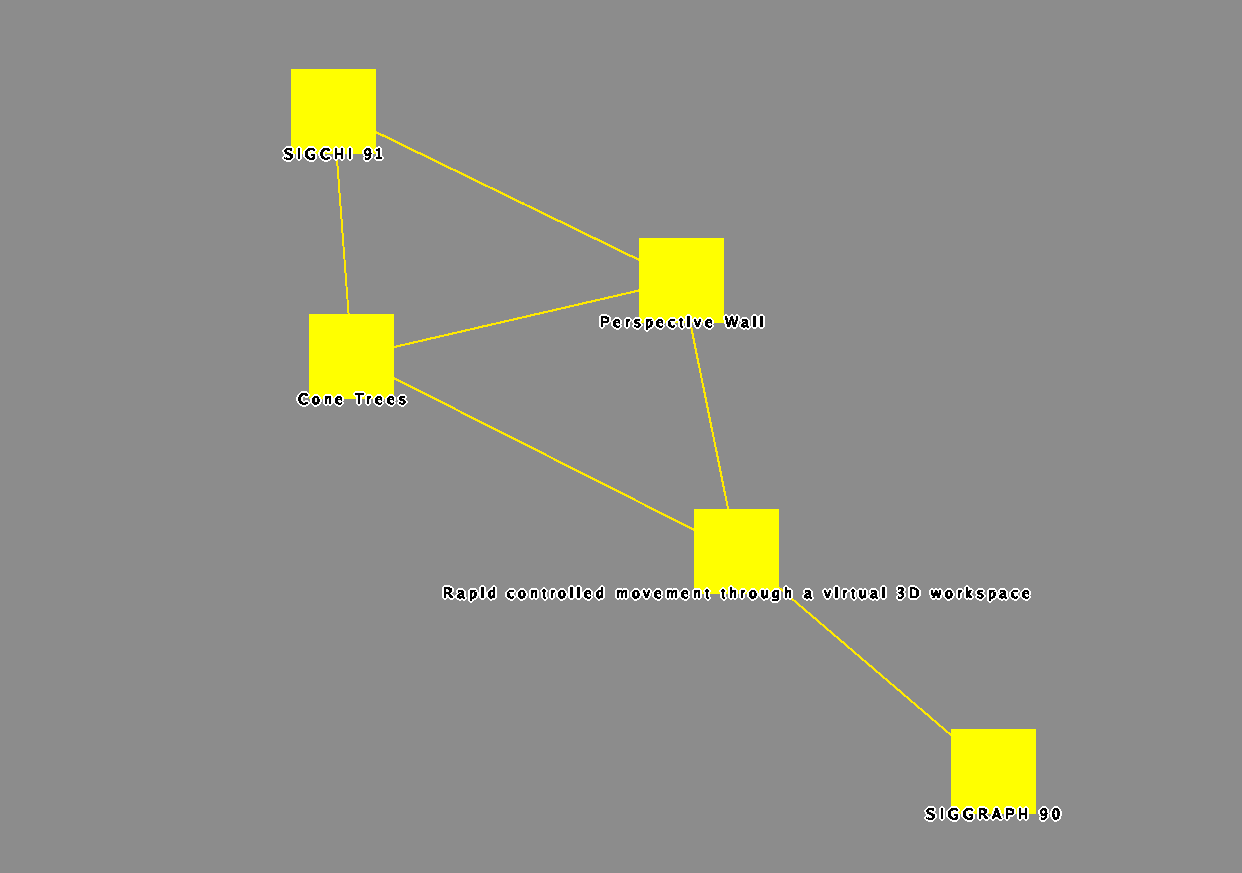
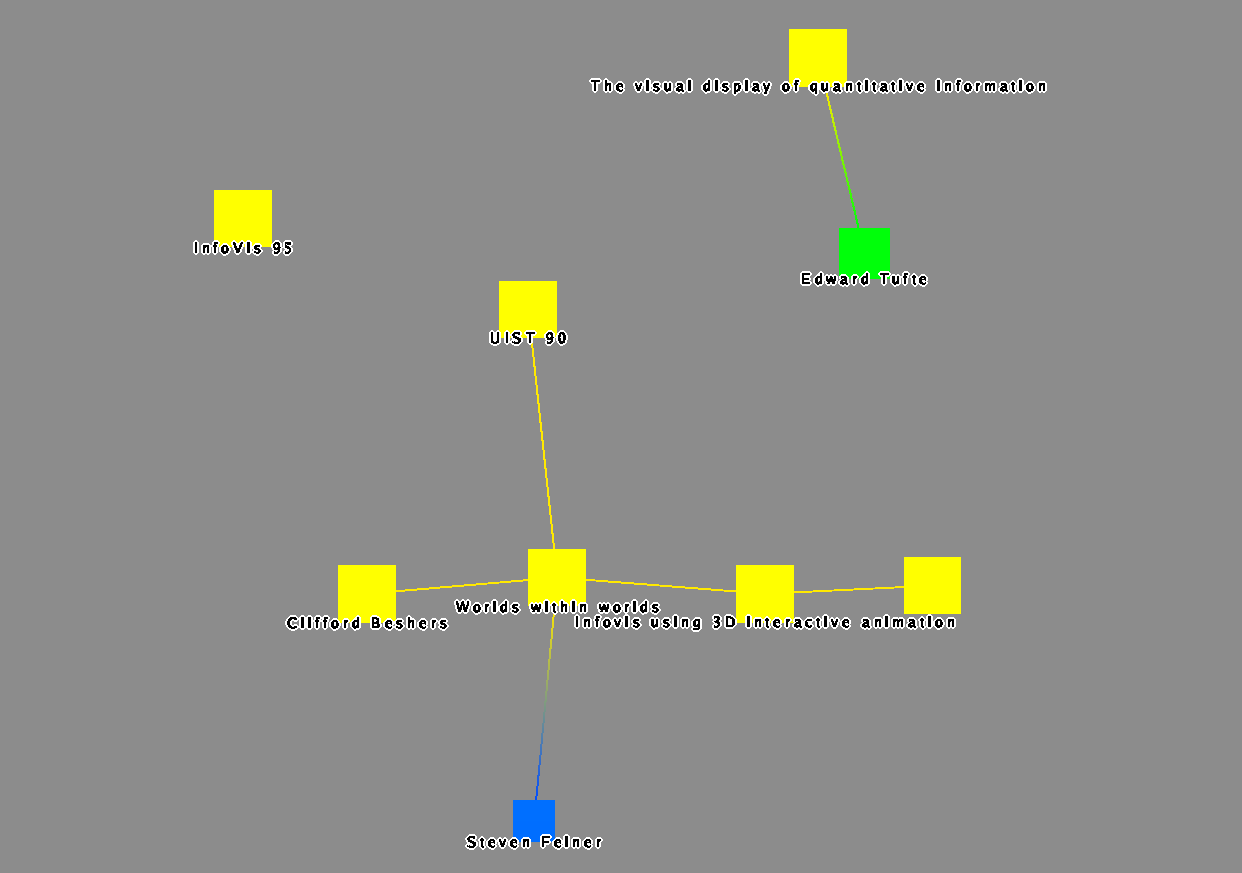
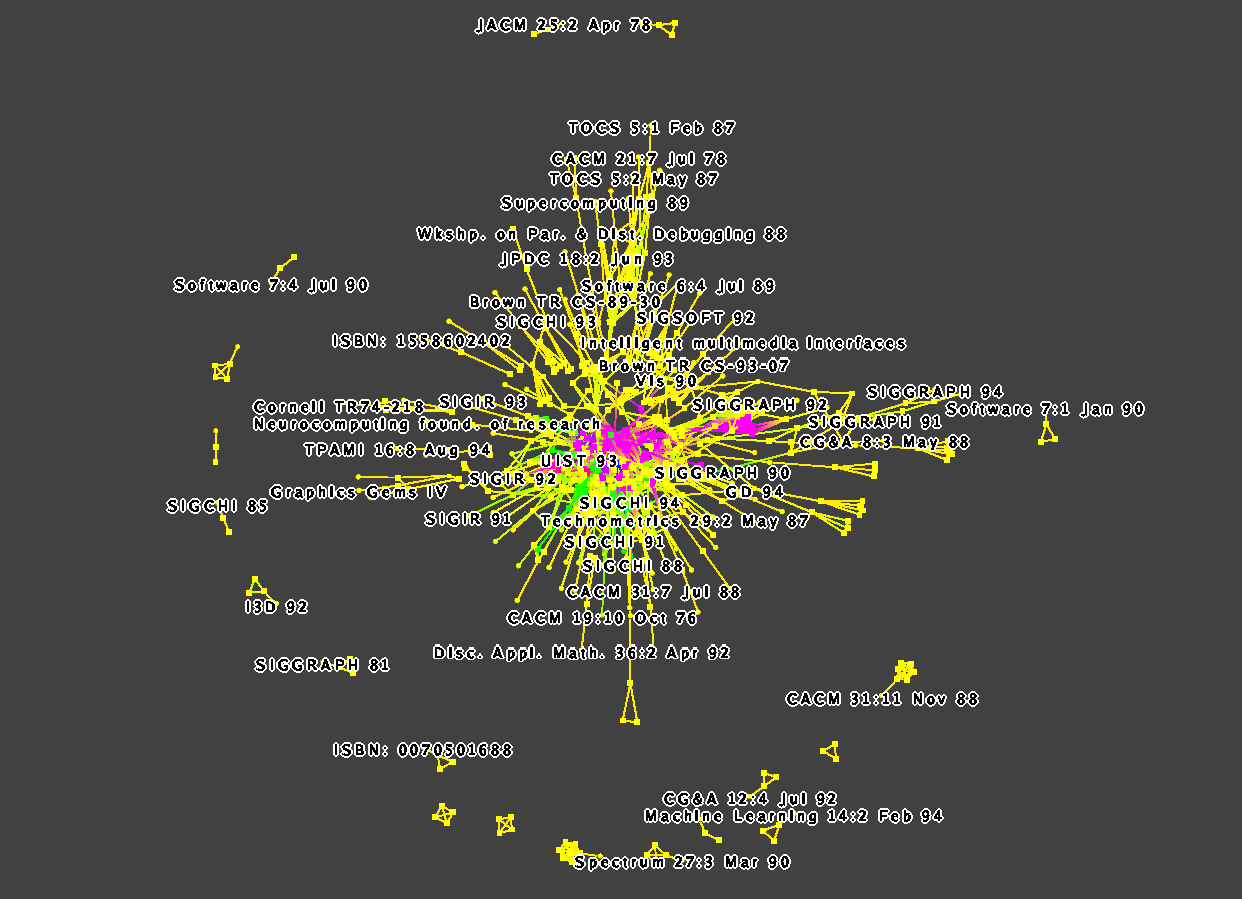
We pick a single author to investigate, in this case George Robertson.
First, we interactively select that node by hitting Control-F for the
find panel, choosing the {\it titleshort} property, the {\it =}
filter, and the regular expression {\it G.*Rob.*}. We then quickly
check to see how he is connected to the entire graph by temporarily
moving that node away from the others to see roughly how many edges
are attached to it, in the first picture.
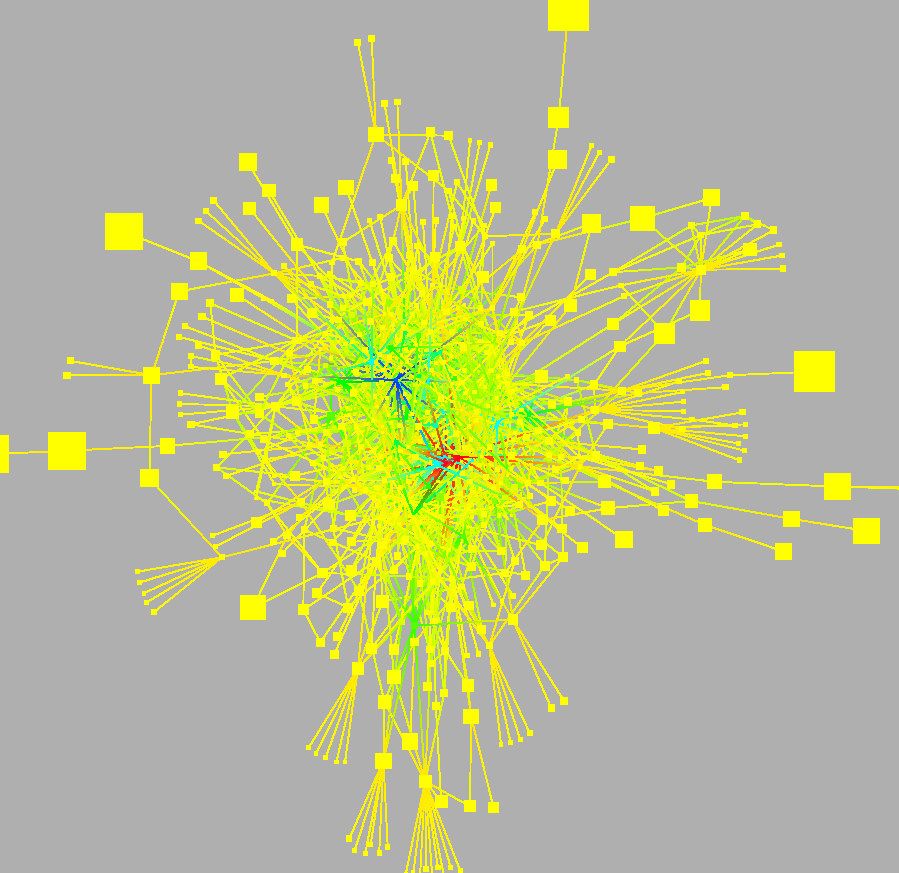
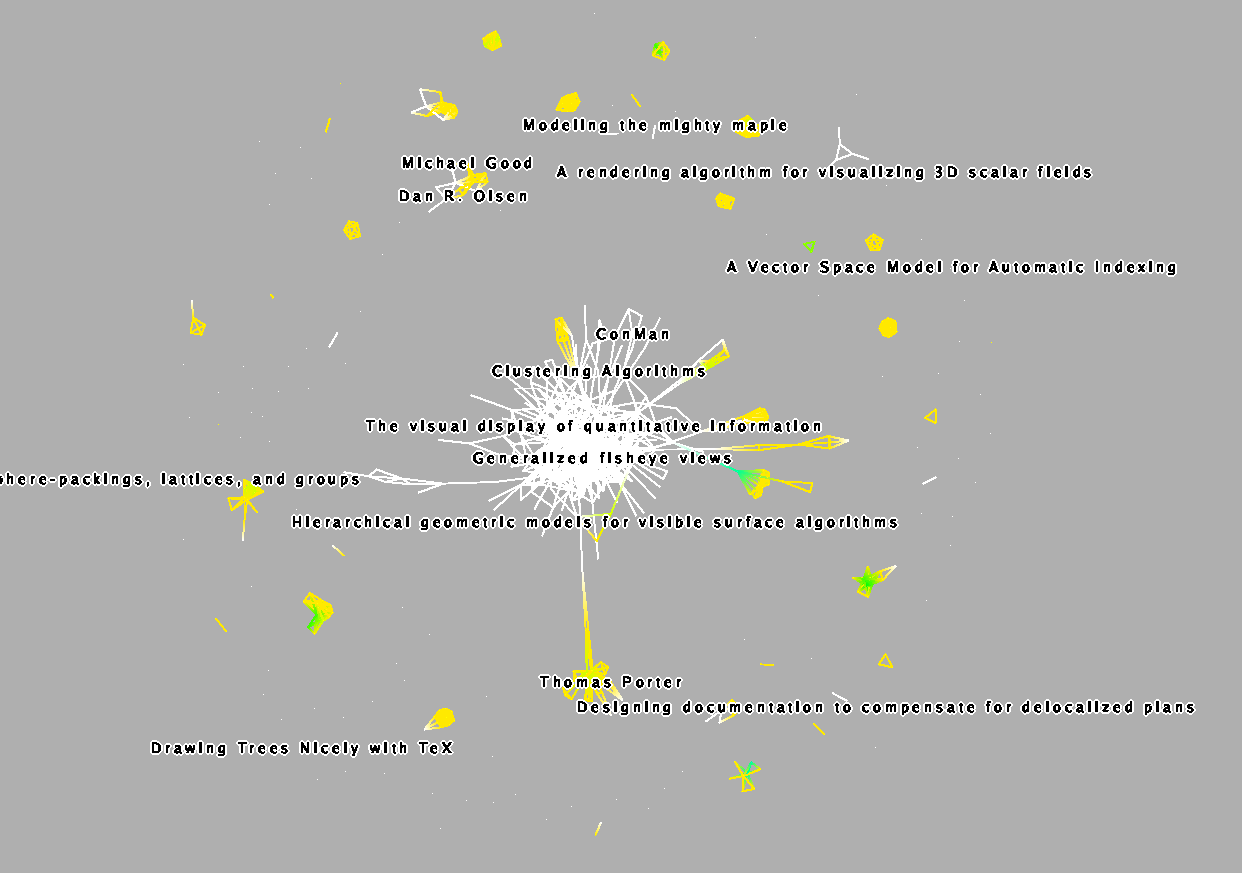
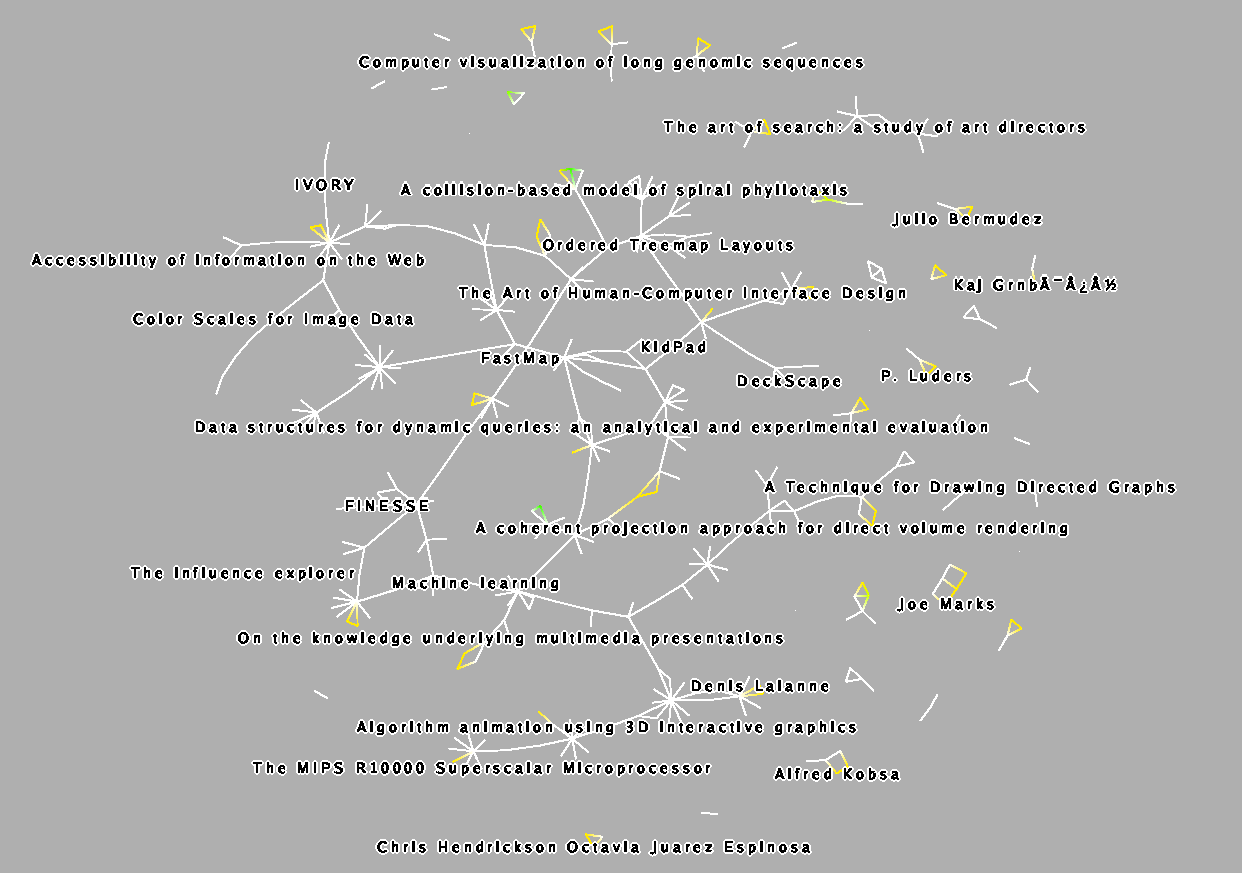
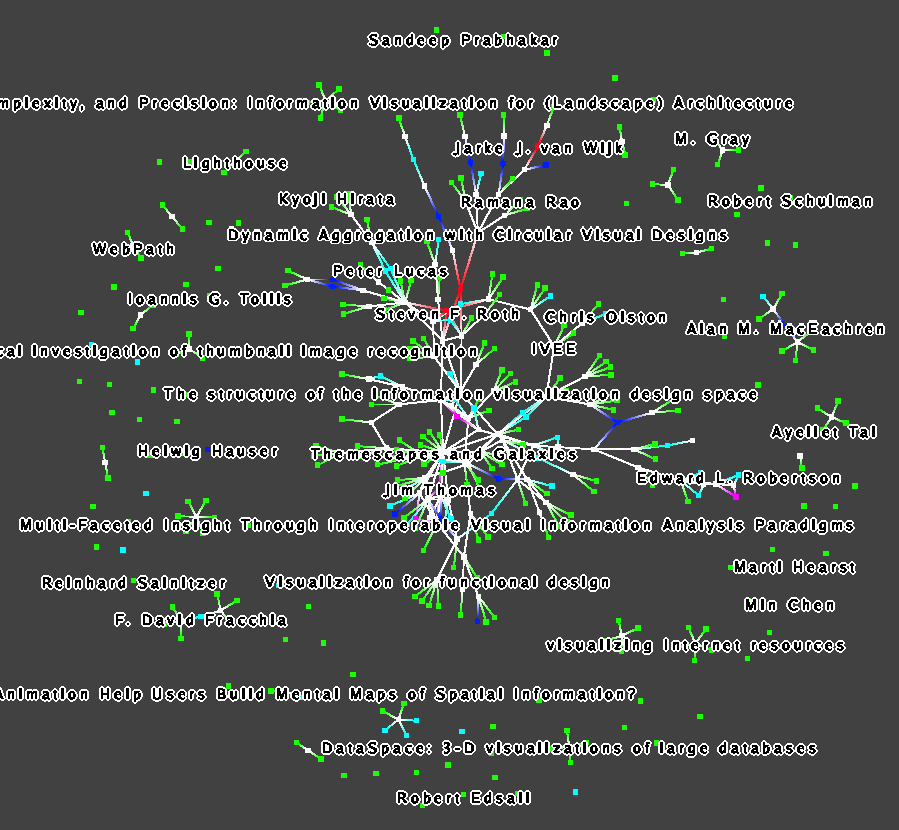
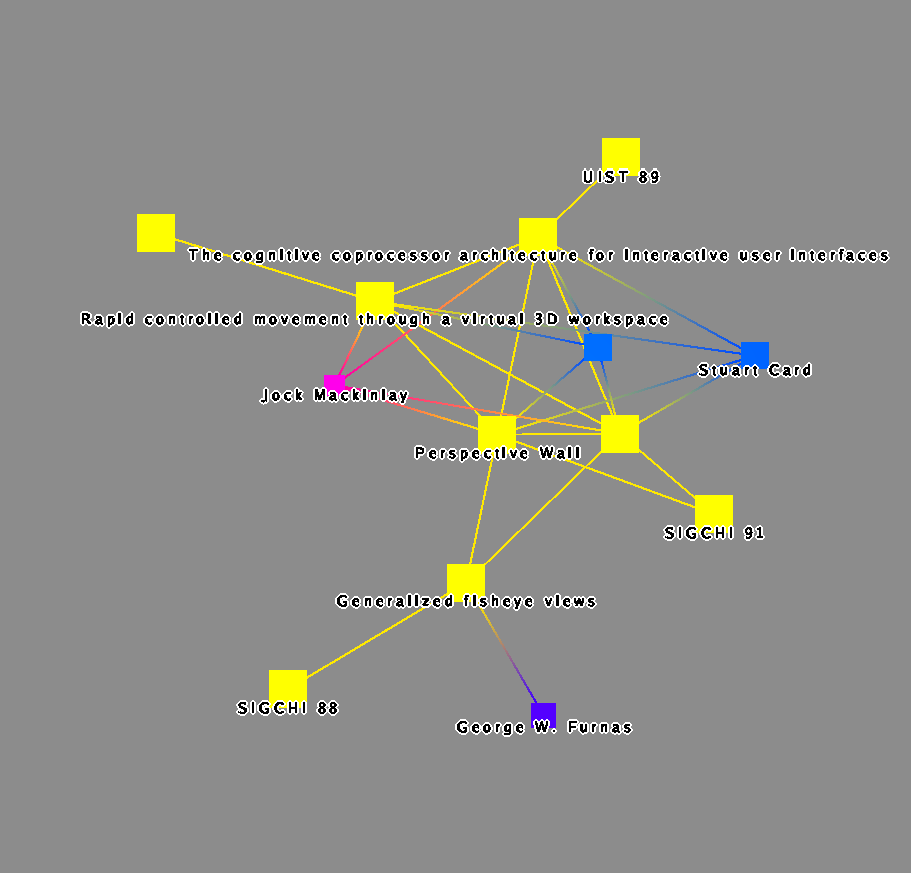
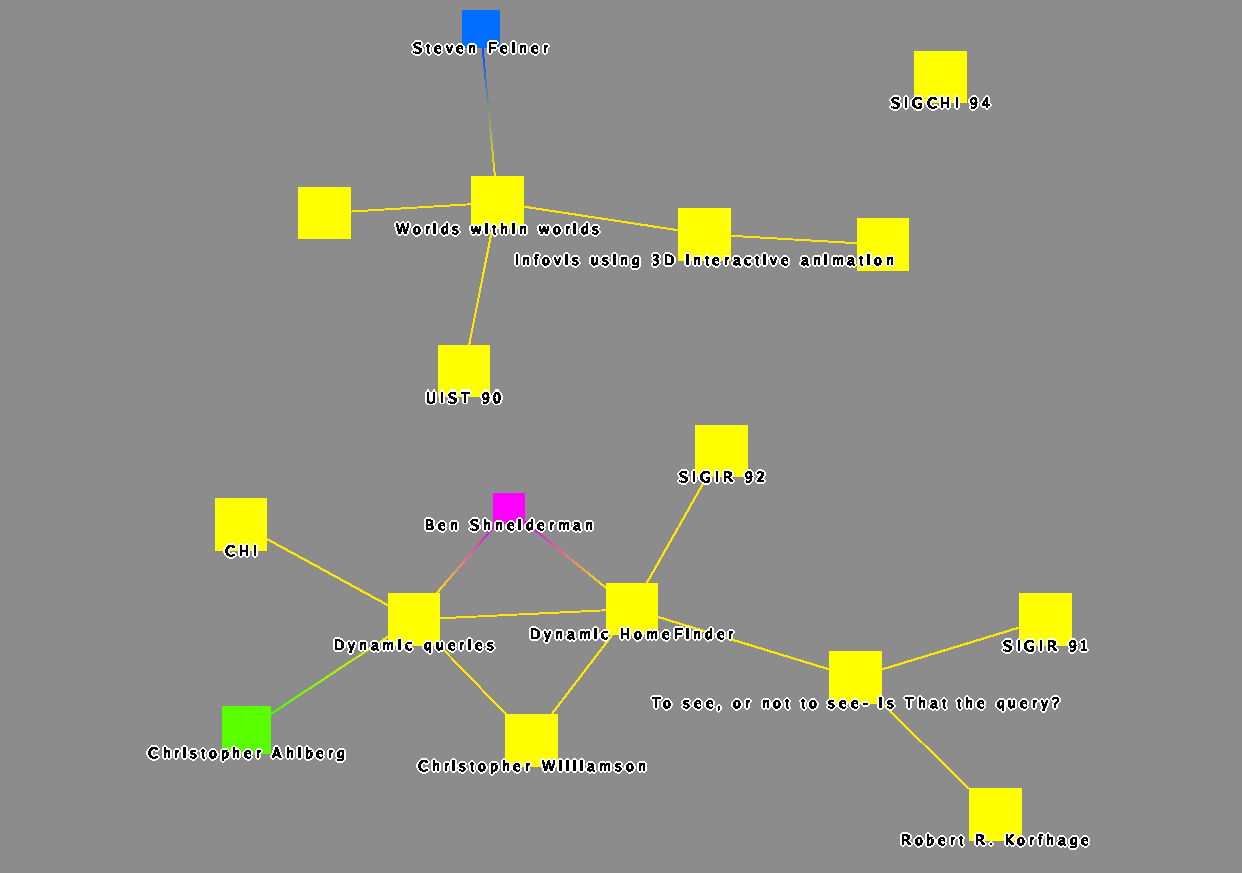
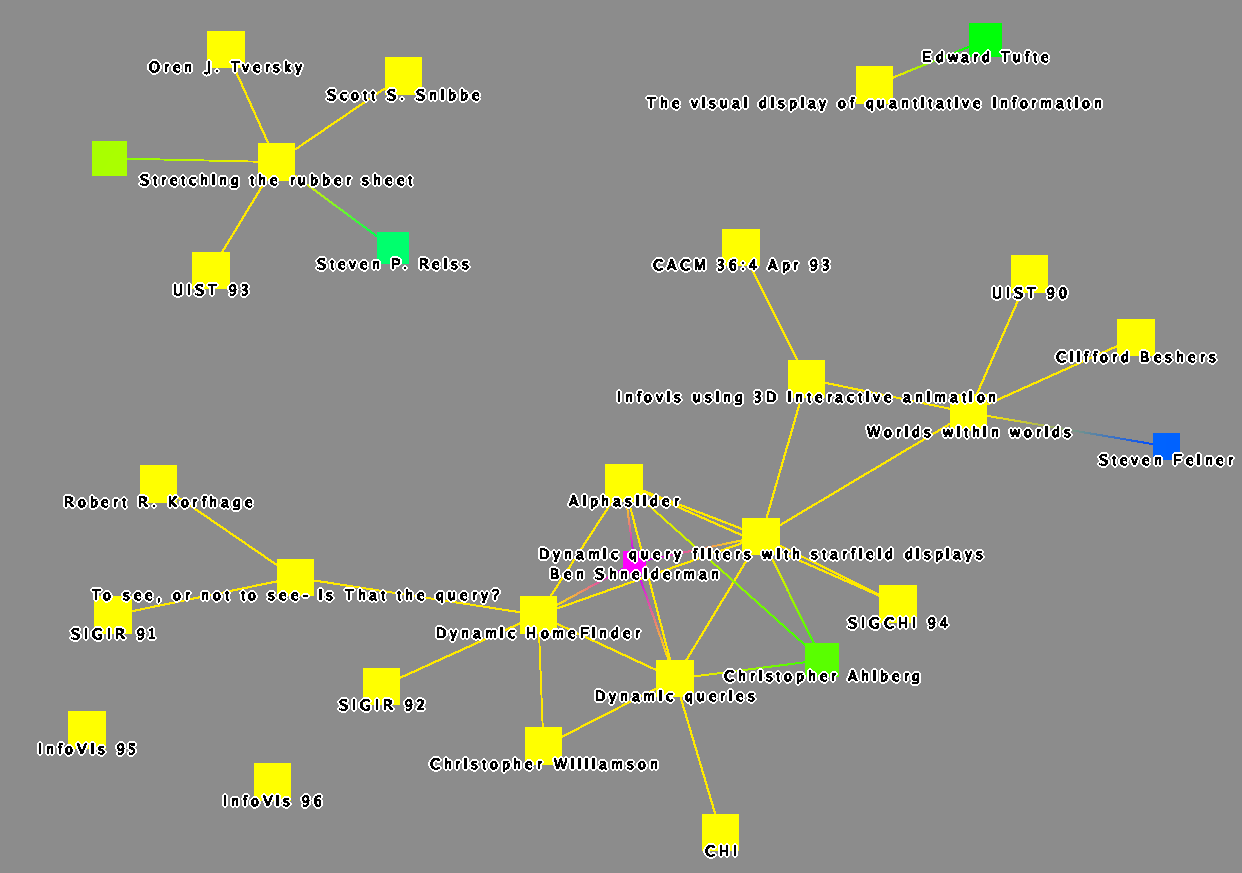
We then select the menu item Property->Selection->ReachableSubGraph,
type 1 for the depth into the popup panel and 0 for the direction of
the edges (outgoing). We then select the menu item Edit->New subgraph
to save this selection for further manipulation, naming it
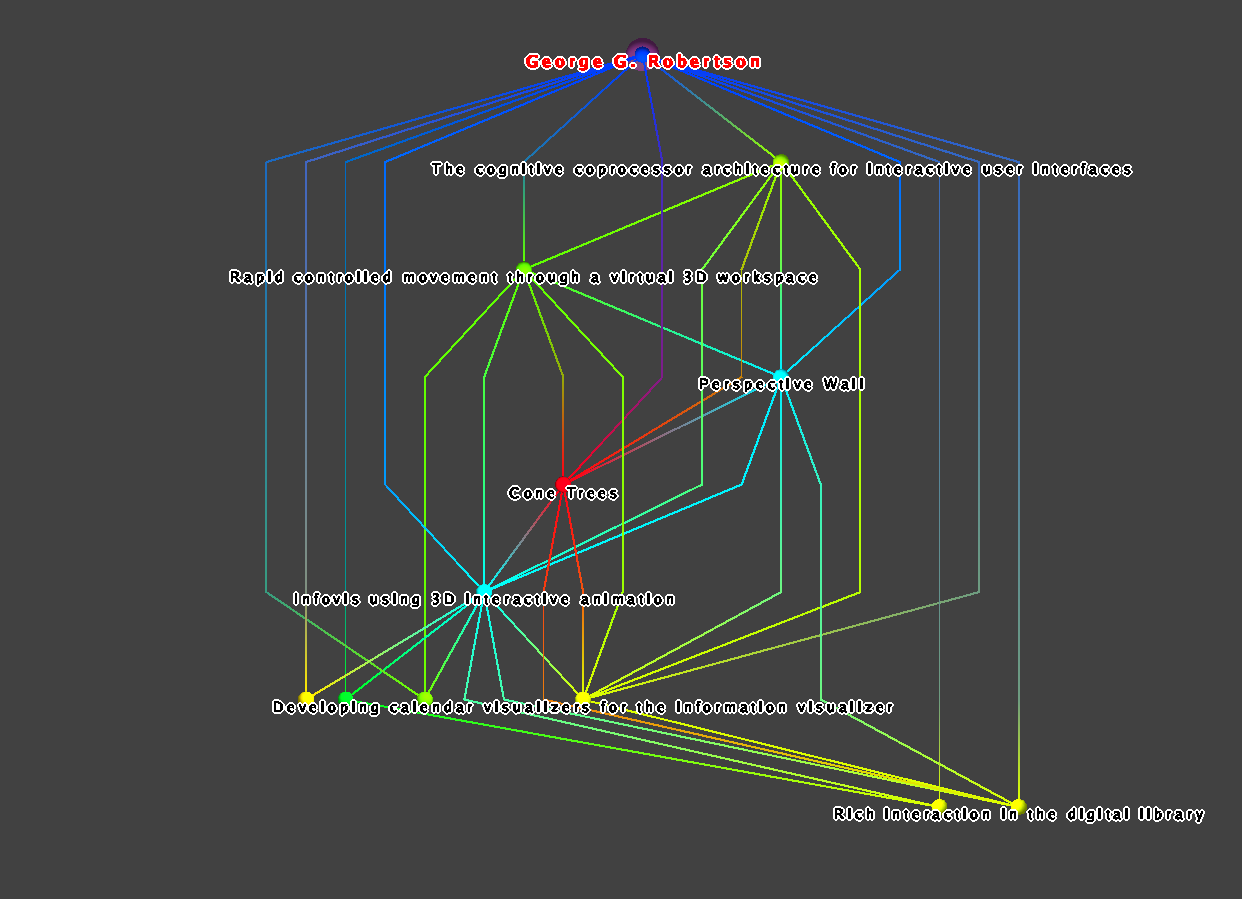
GR.1hop.outgoing. We then select this new subgraph in the hierarchy
window, and lay out this subgraph using using a hierarchical drawing
algorithm. We can see simply from the drawing which papers were
published first, as they are cited by the later ones. The result is
shown in the second picture: Robertson has published 11 papers in this
database. The coloring by the number of citations shows that Cone
Trees is his most influential work. When we consider how Robertson
fits into the topics described above in Task
2.4 above, it is clear that he is one of the most central
contributors to the Focus+Context topics.
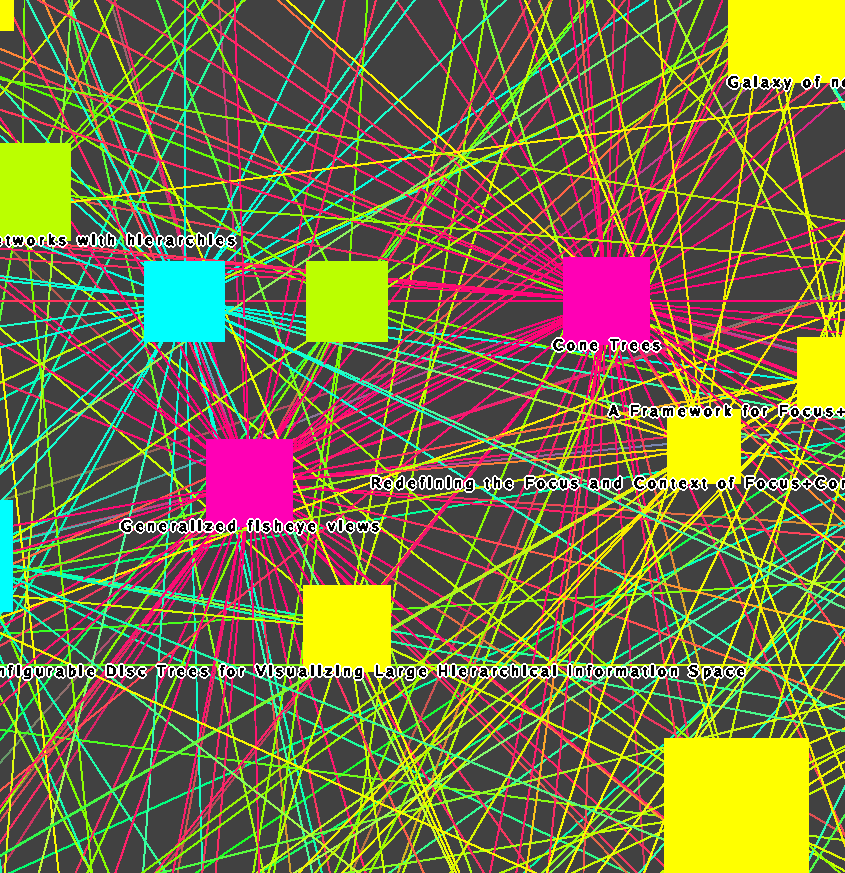
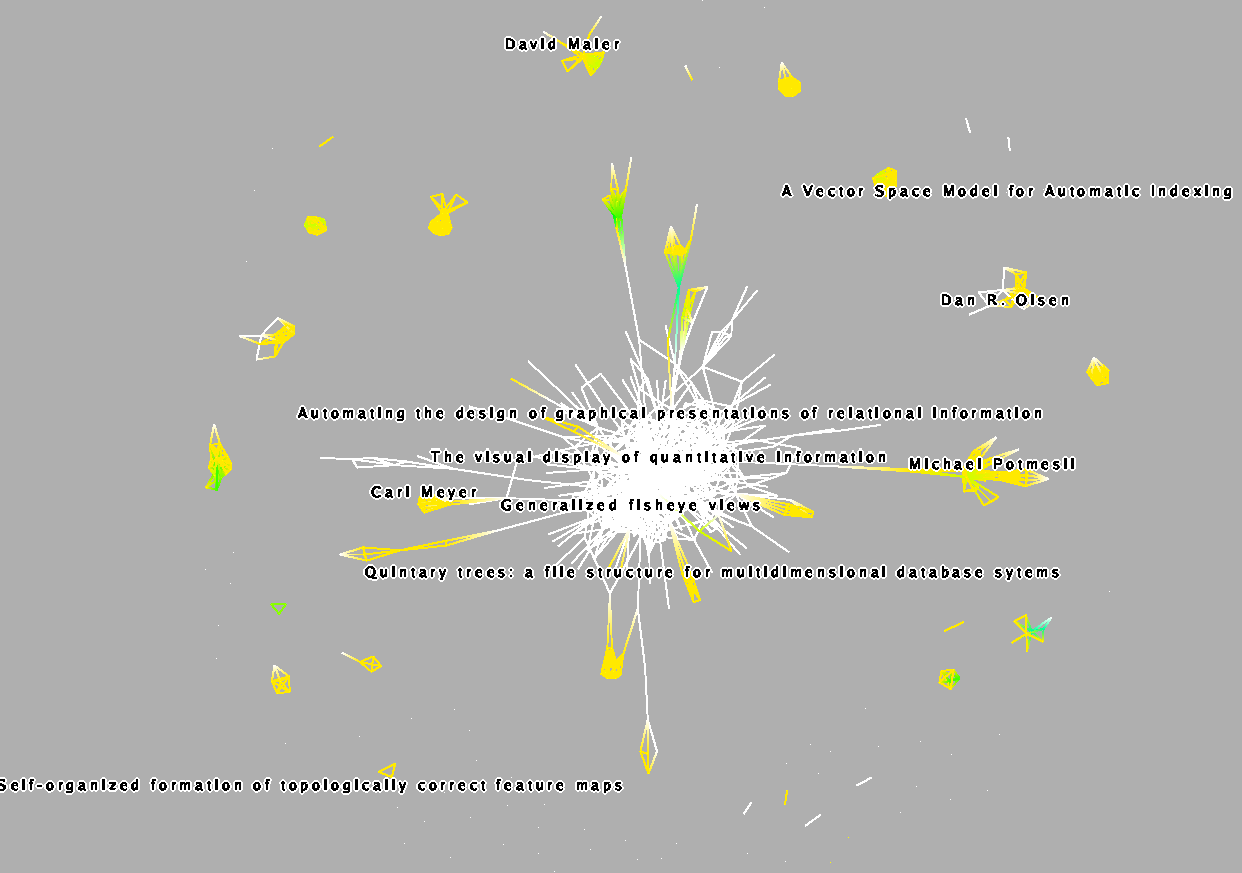
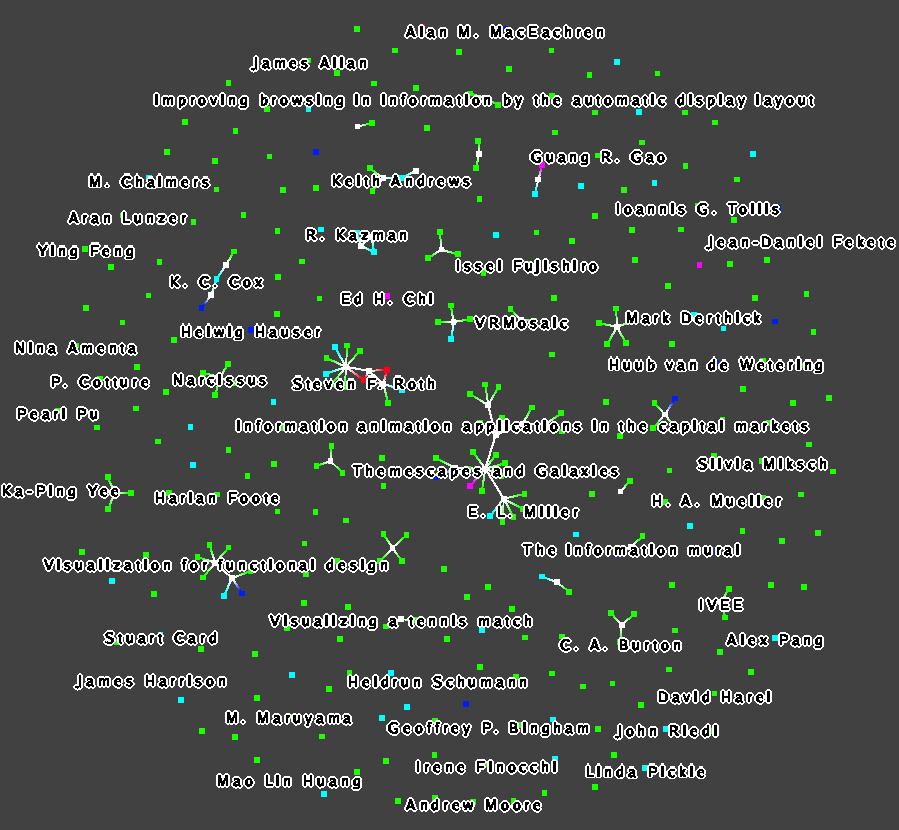
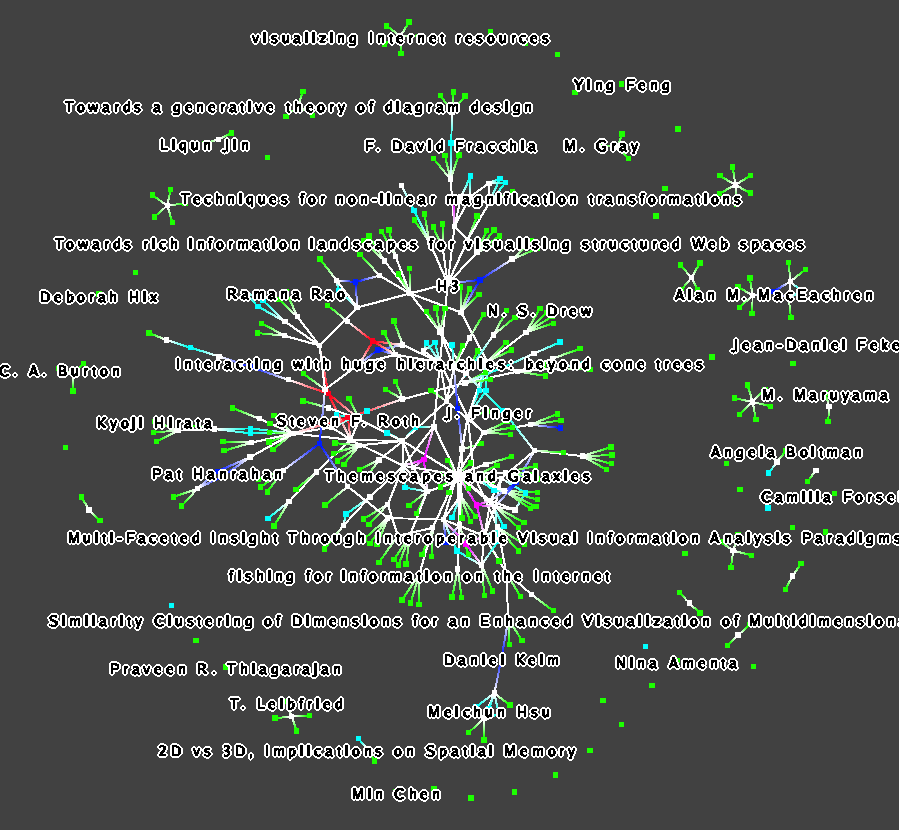
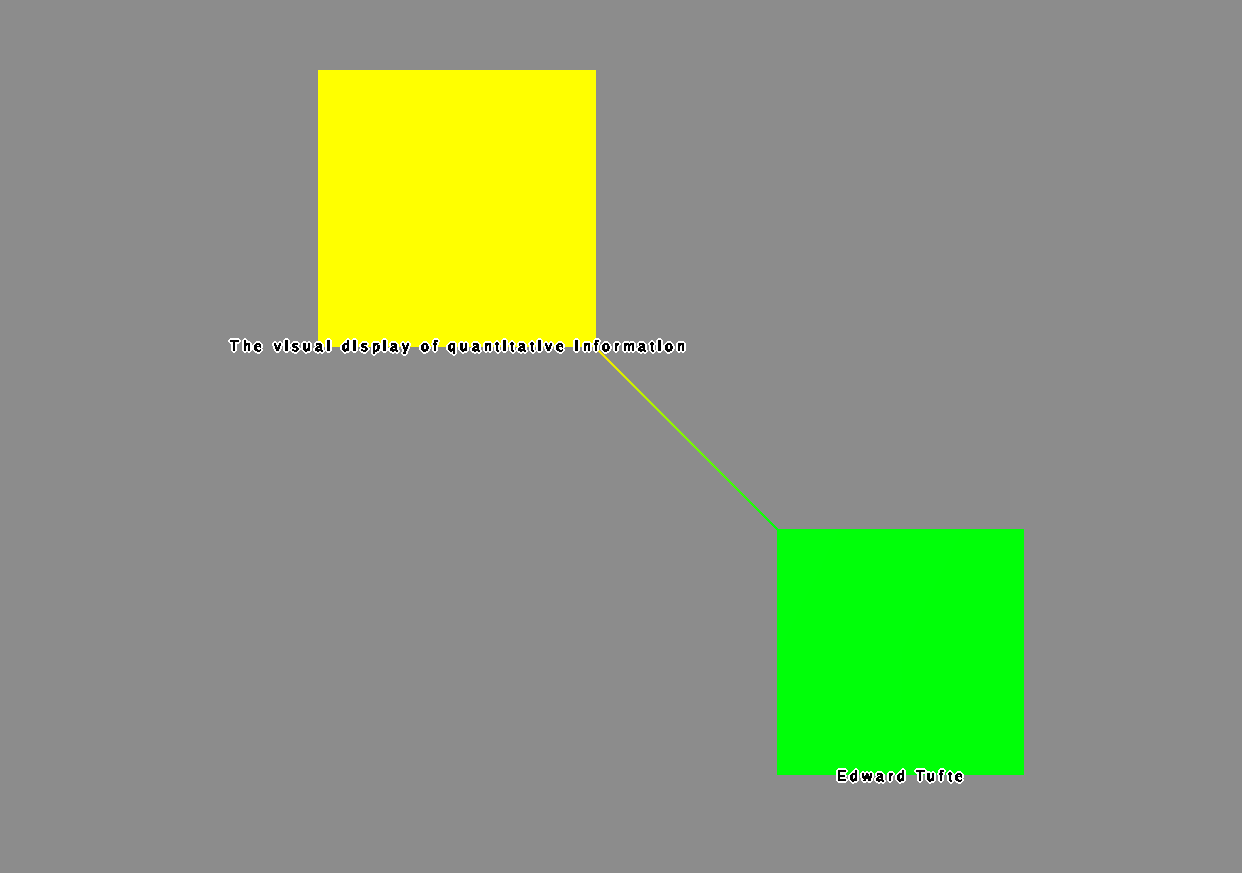
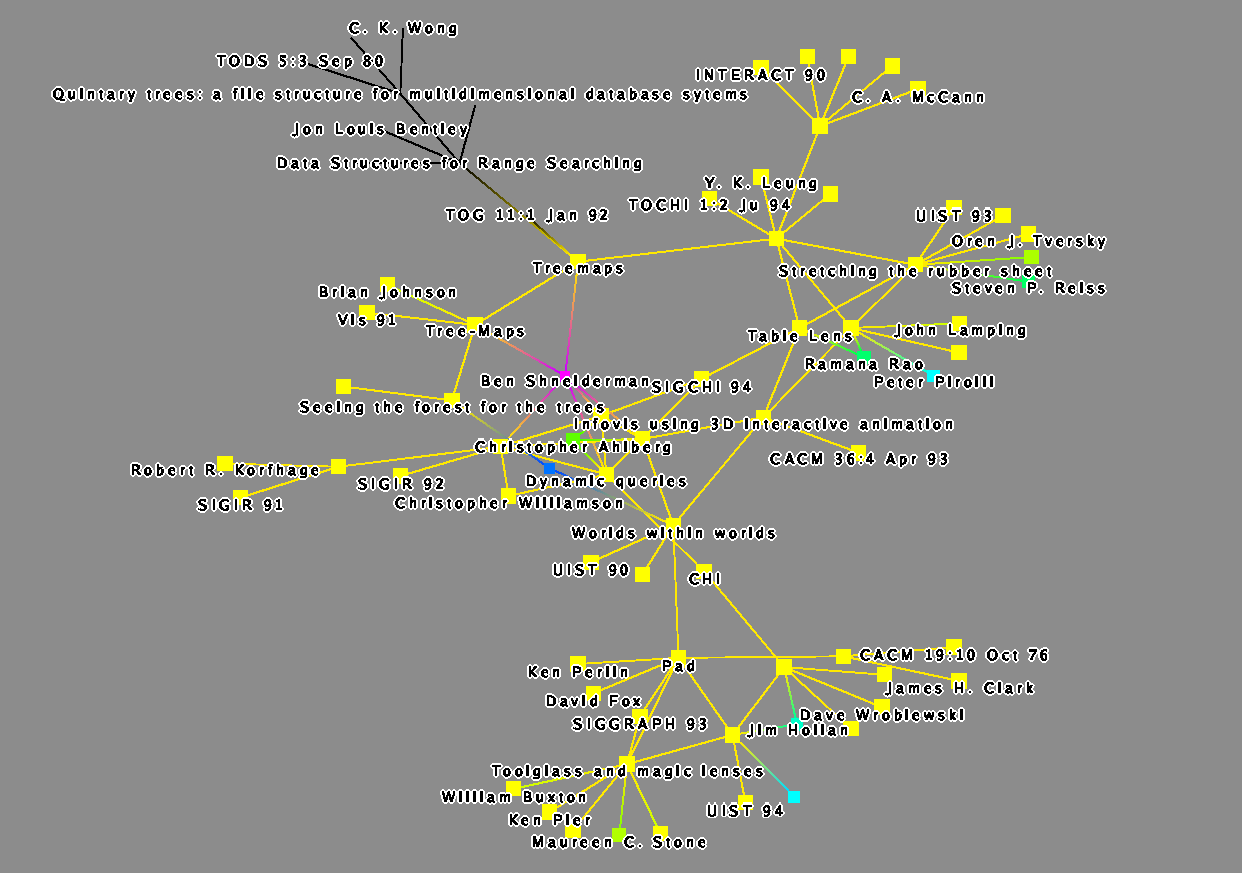
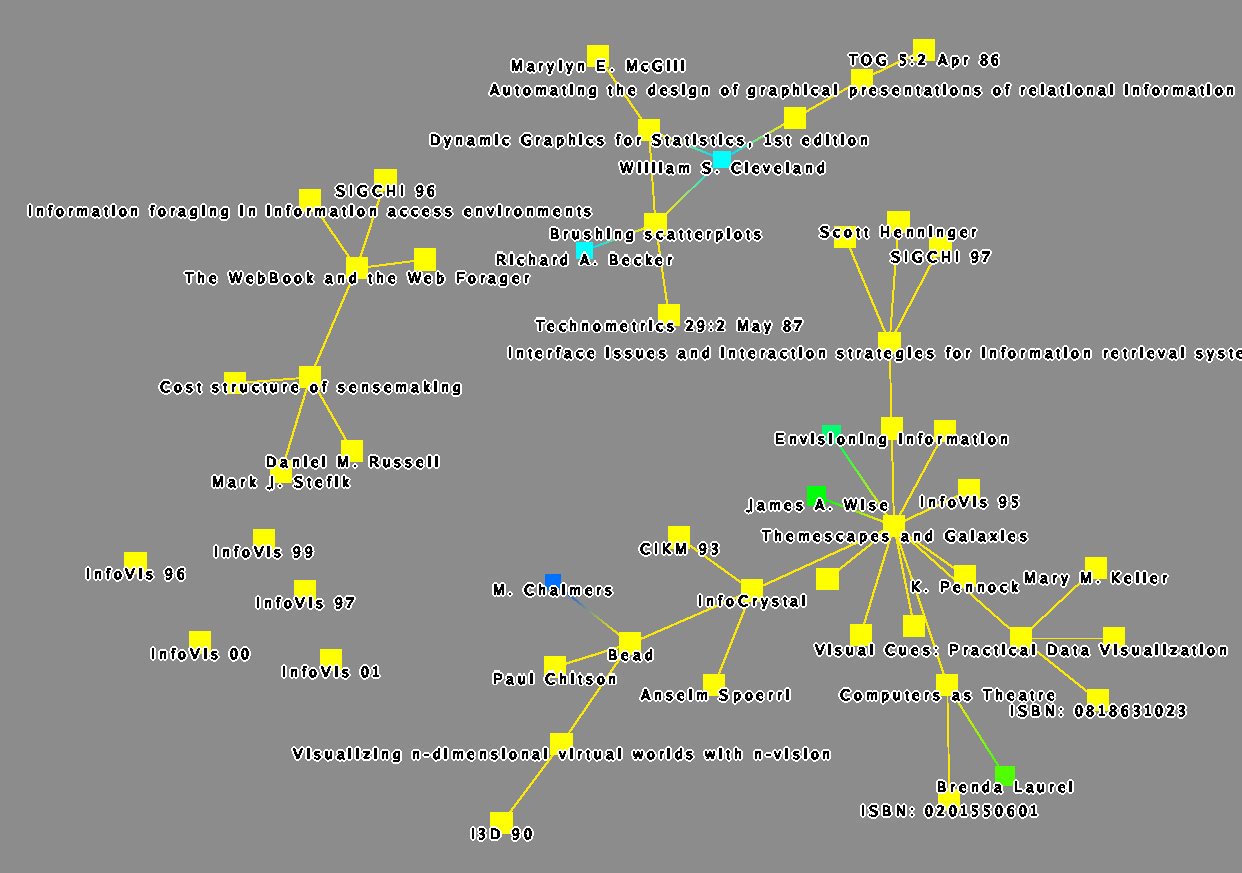
Finally, we select all papers by hitting Control-F for the find panel,
choosing the {\it type} property, the {\it =} filter, and the value 0
for papers. We explicitly add Robertson to the selection using the
ViewSelection property, and save this whole set to a new subgraph that
we name GRCite. We then select the Robertson node again as above, use
the Property->Selection->ReachableSubGraph, pick a depth of 2 to find
all papers that cite a paper written by Robertson, and save the
resulting subgraph using the Edit->New subgraph menu. The final image
shows the result of using the Property->Layout->Hierarchical Graph
layout.
property.
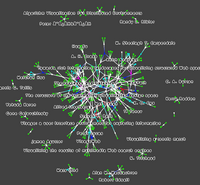
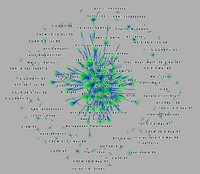
Focusing on a Single Author: Augmented Dataset
- Process:
- Data: same as above
- Plugin: Create coauthorship edges linking authors who write
papers together.
- Color: number of citations, with rainbow mapping
- Layout: circular (1,2), hierarchical (3), Frick force-directed (4)
- Images:
- Insight:
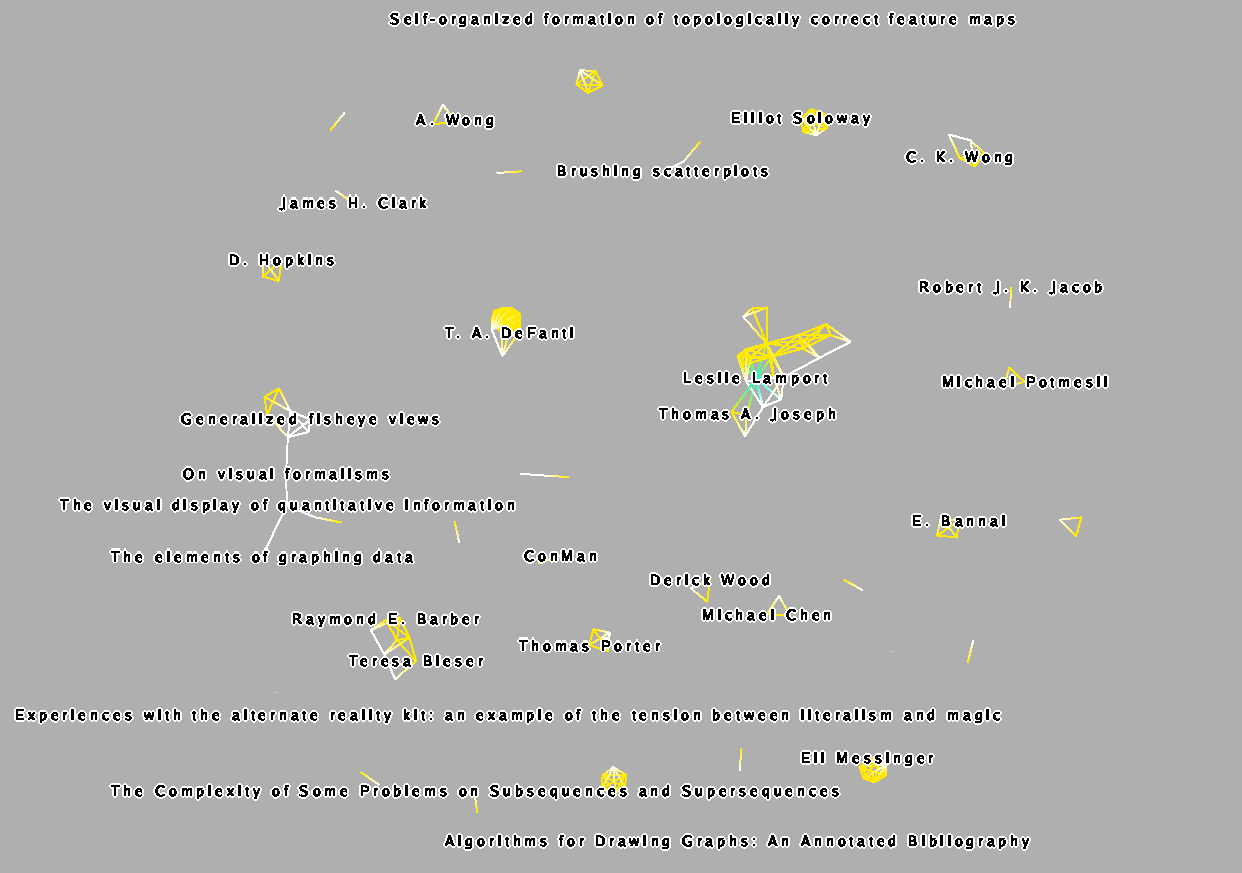
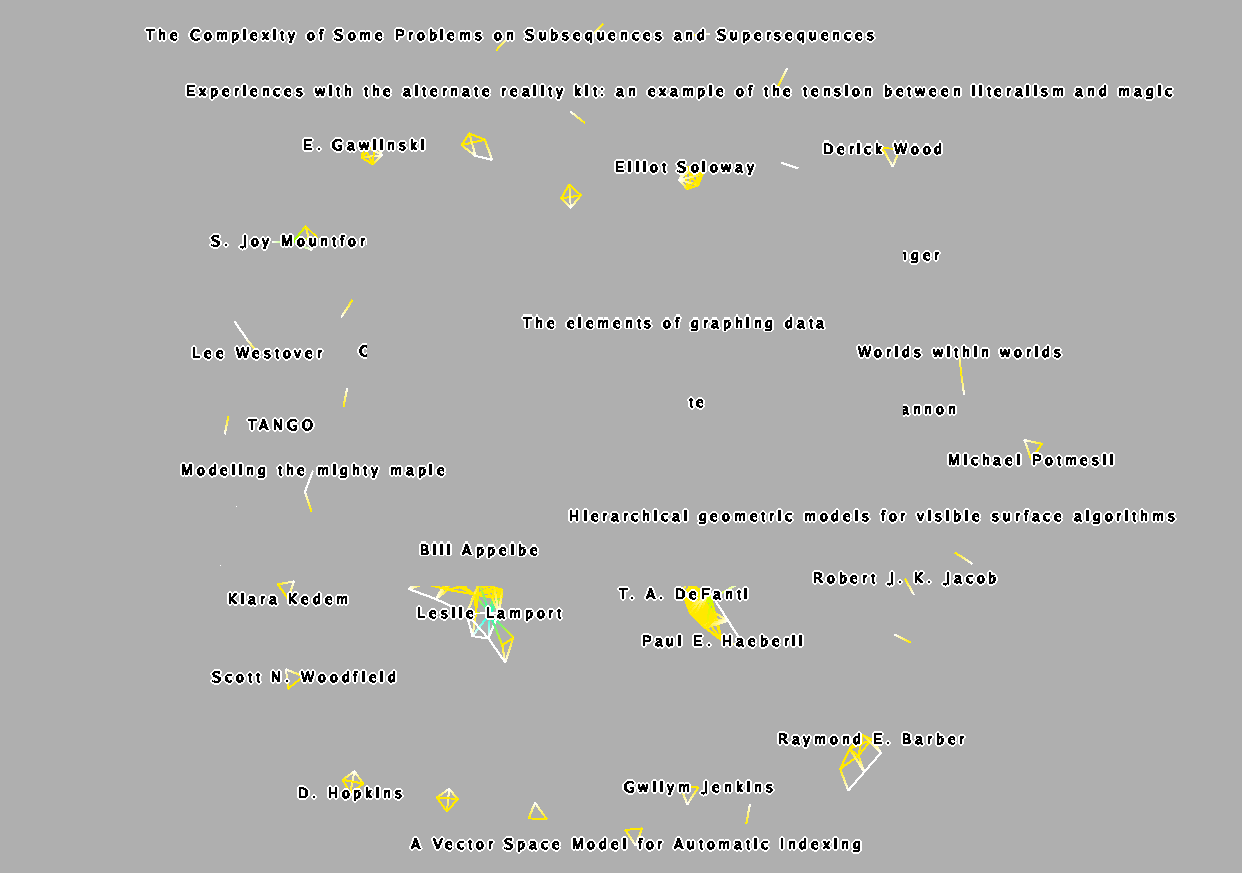
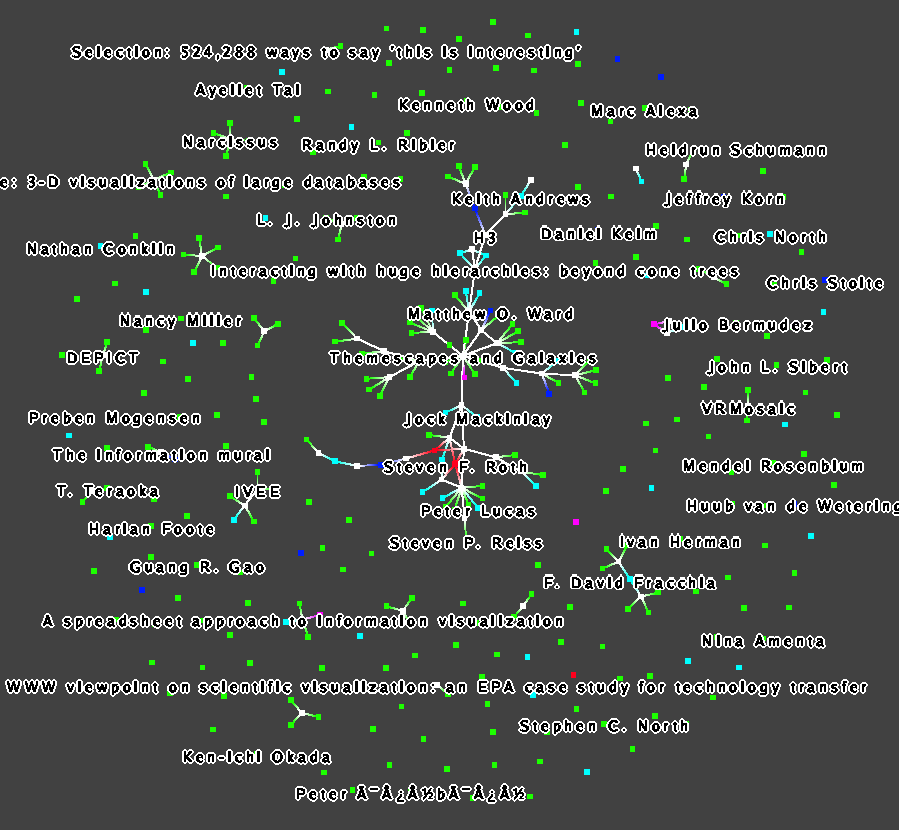
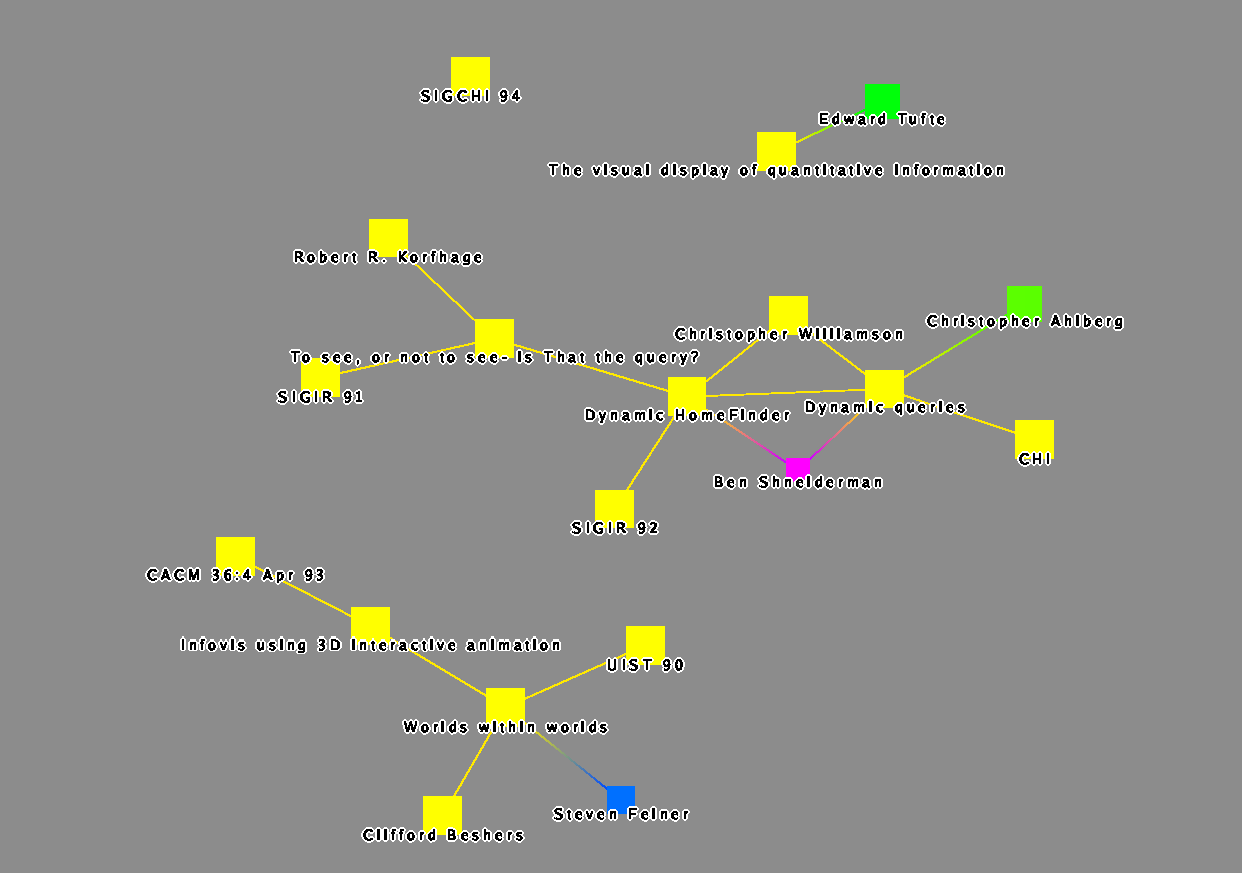
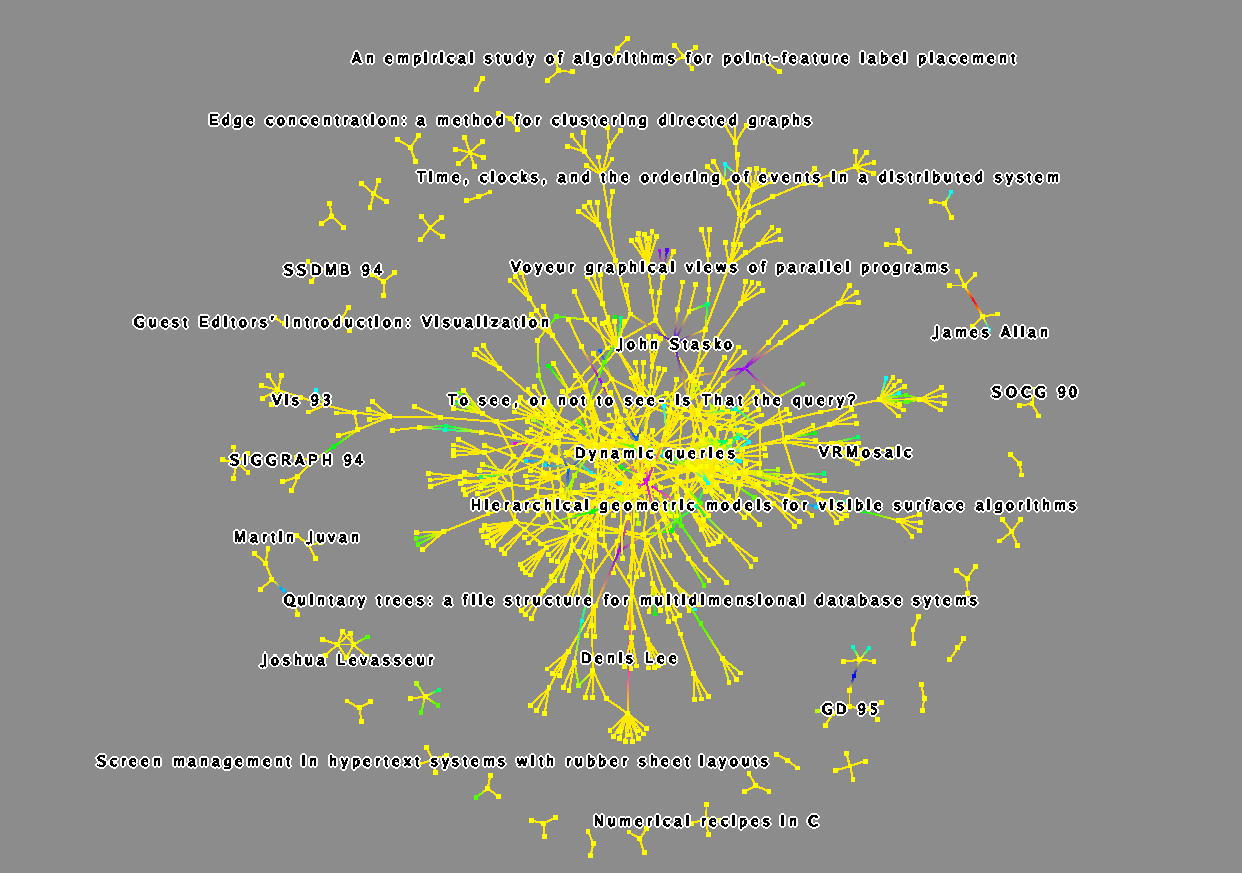
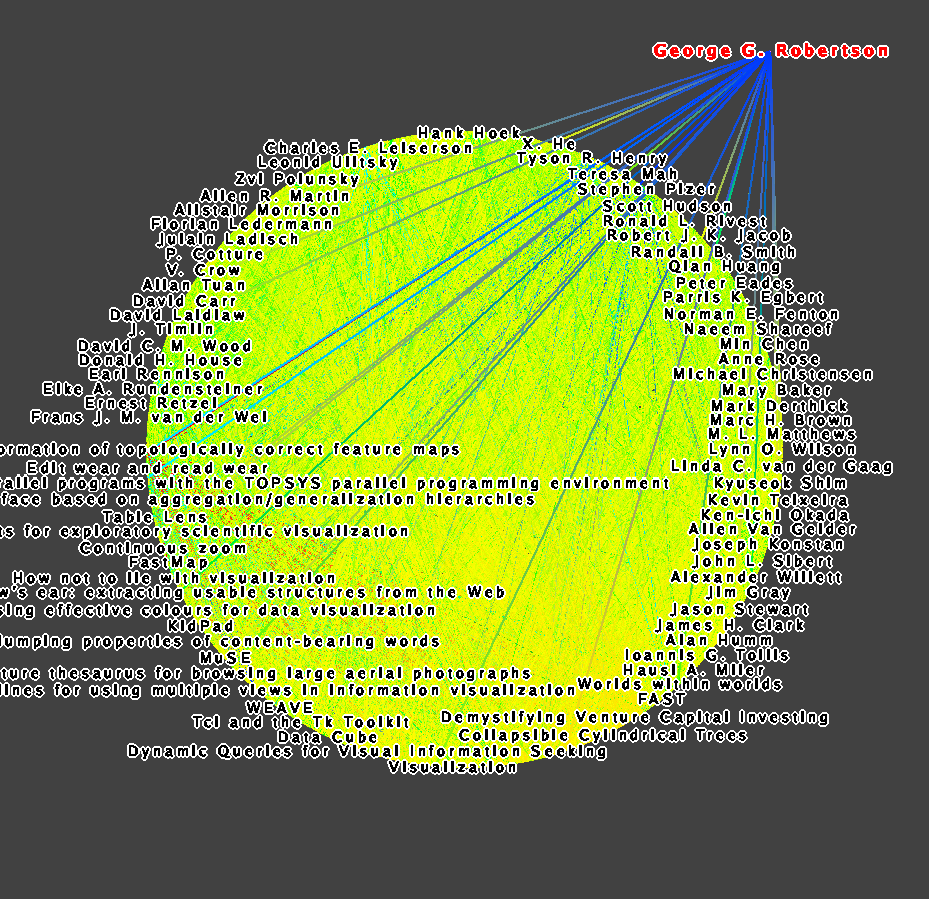
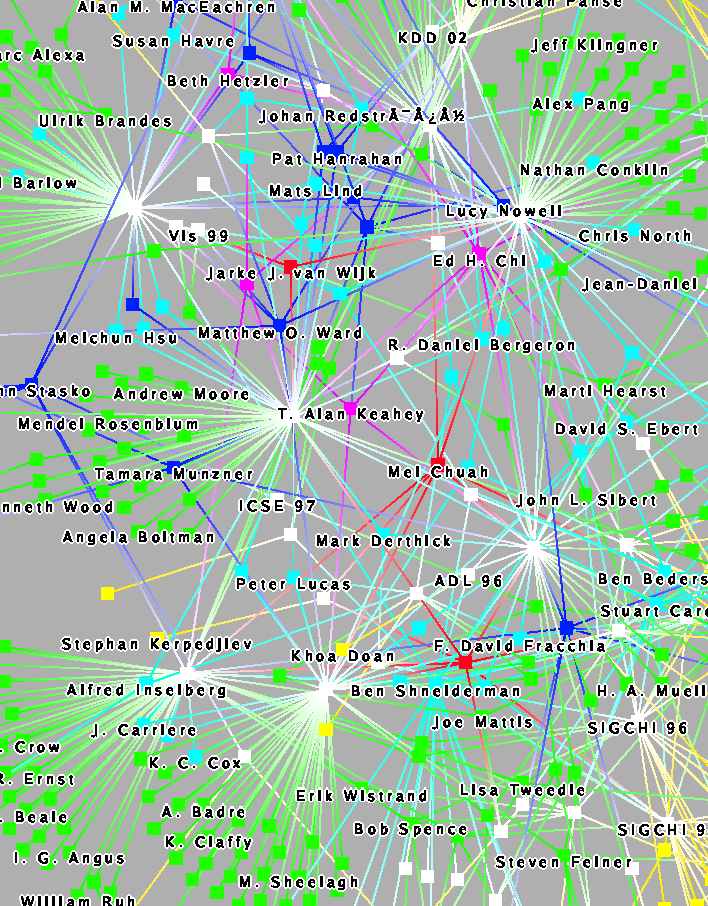
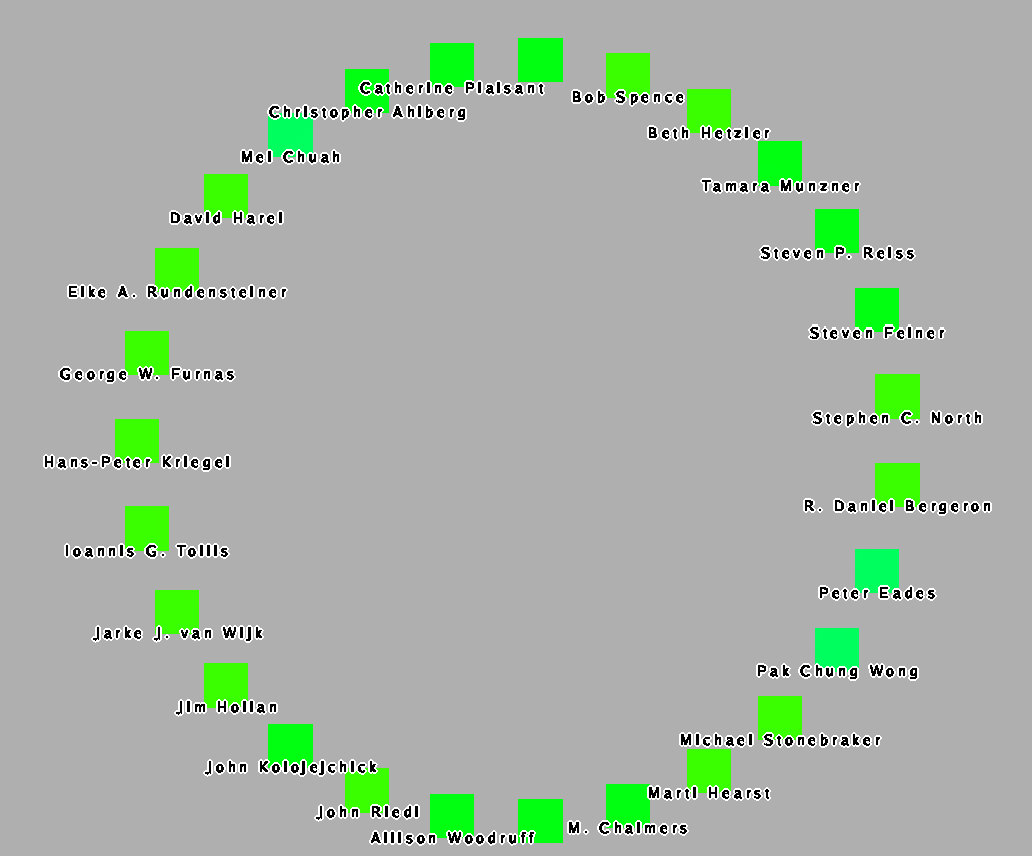
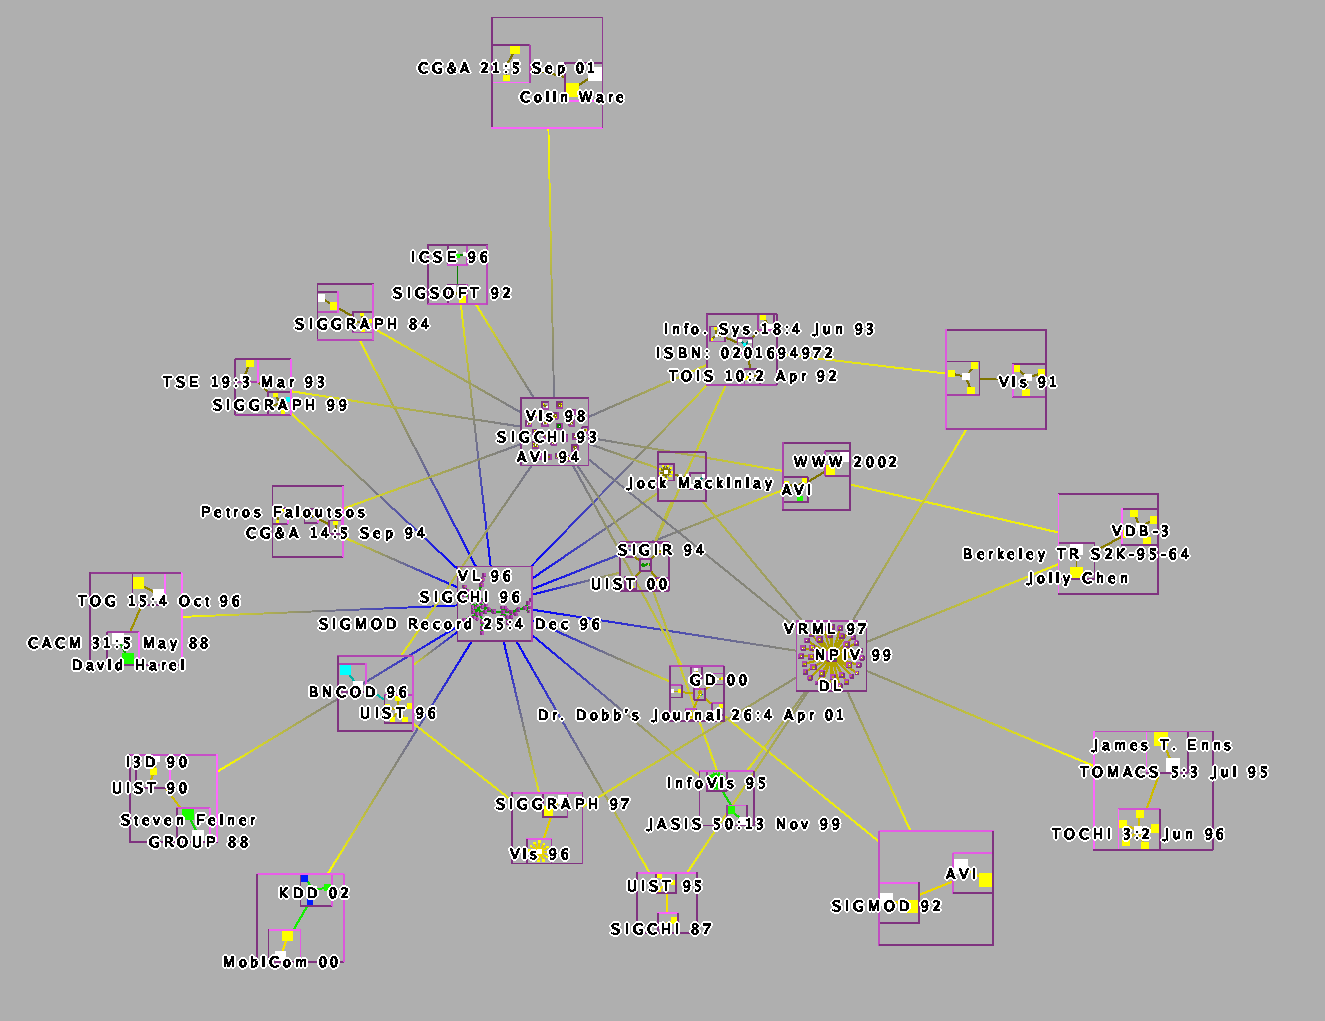
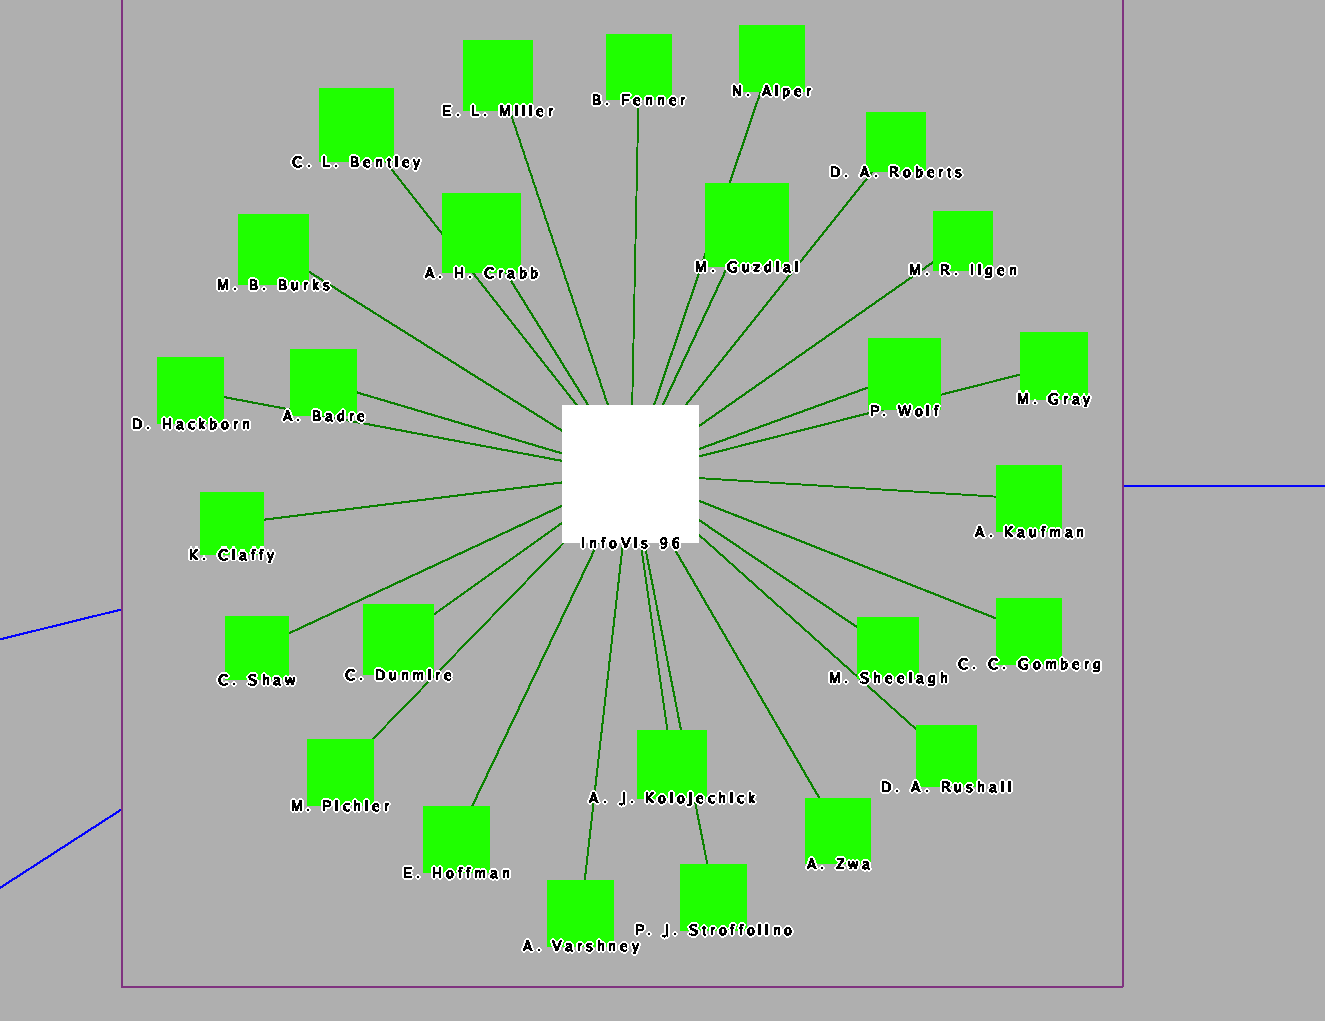
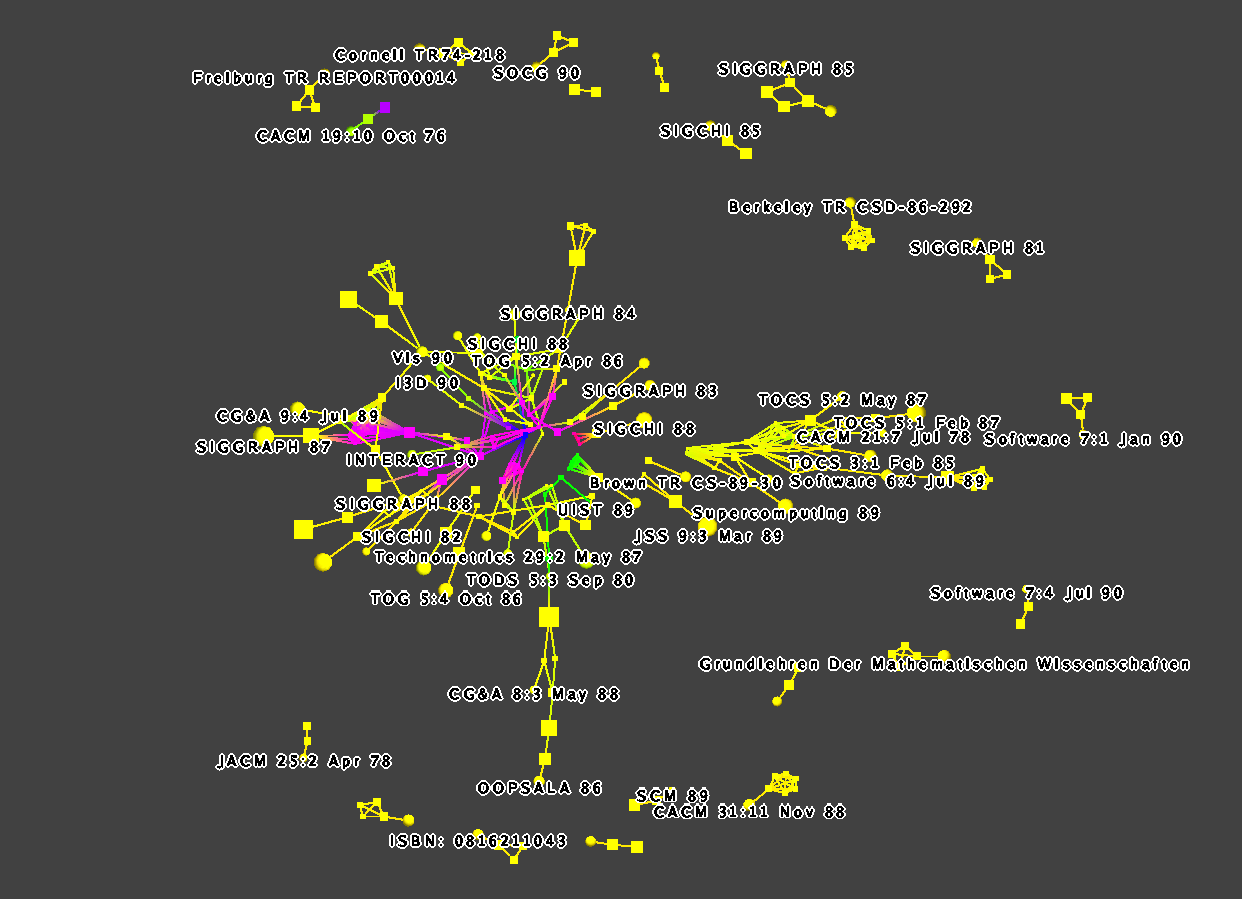
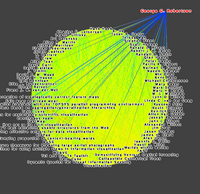
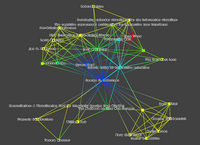
We use the same dataset as before as a base, but use a plugin to add
coauthorship links between authors. The first picture shows that as
before, we select Robertson and move that node away from the main
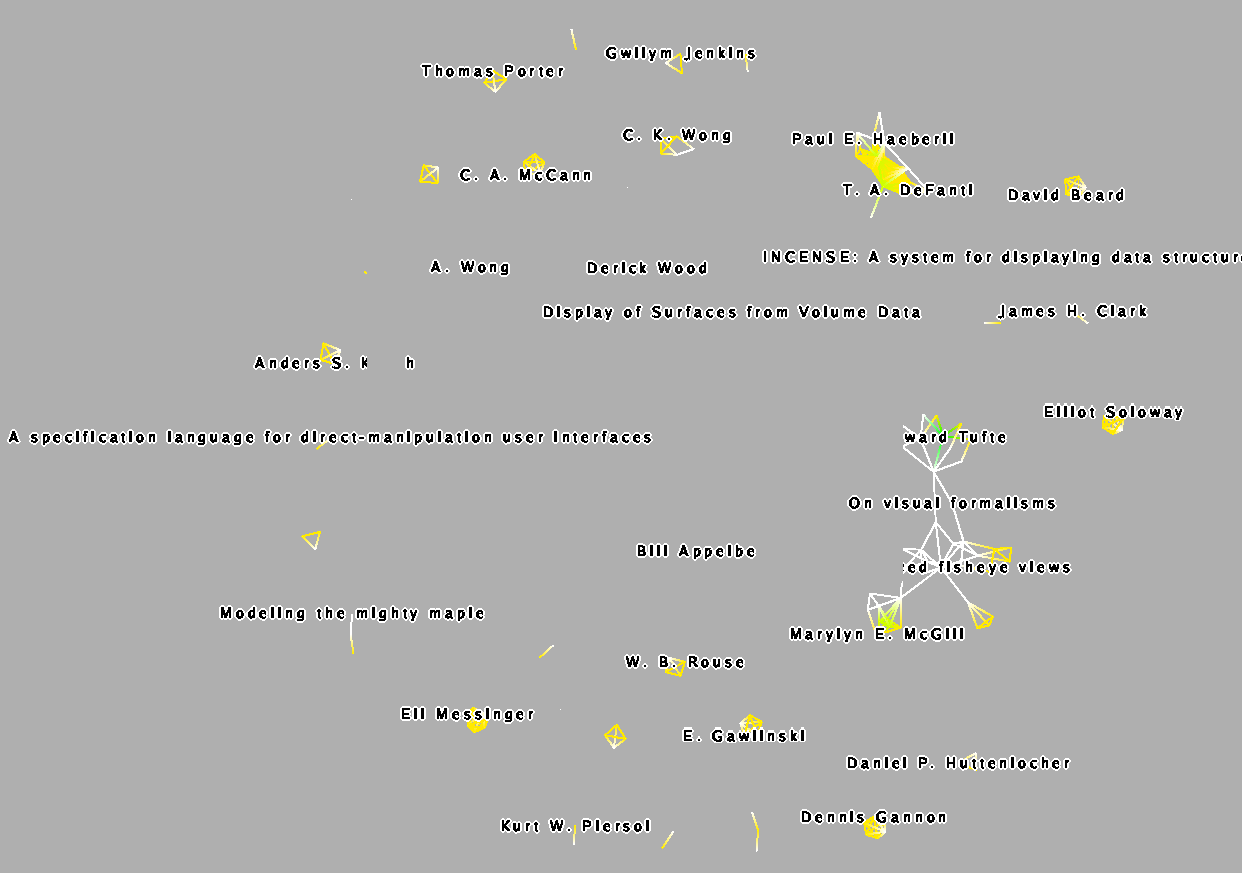
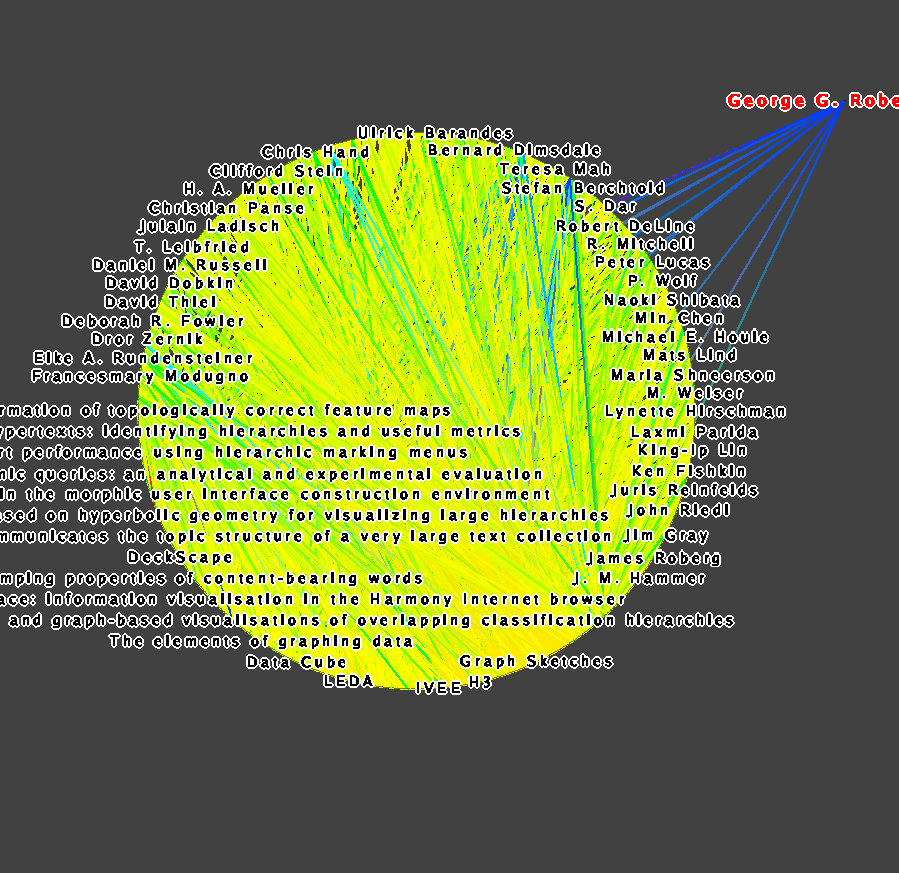
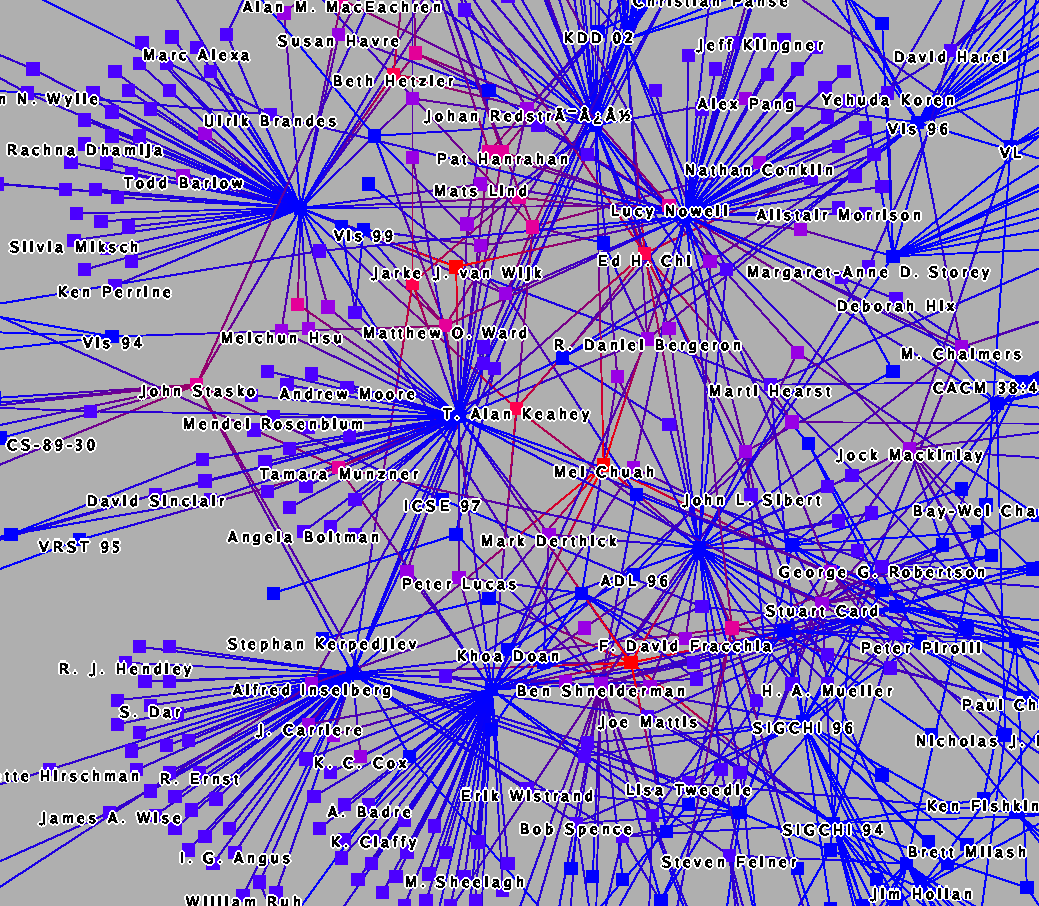
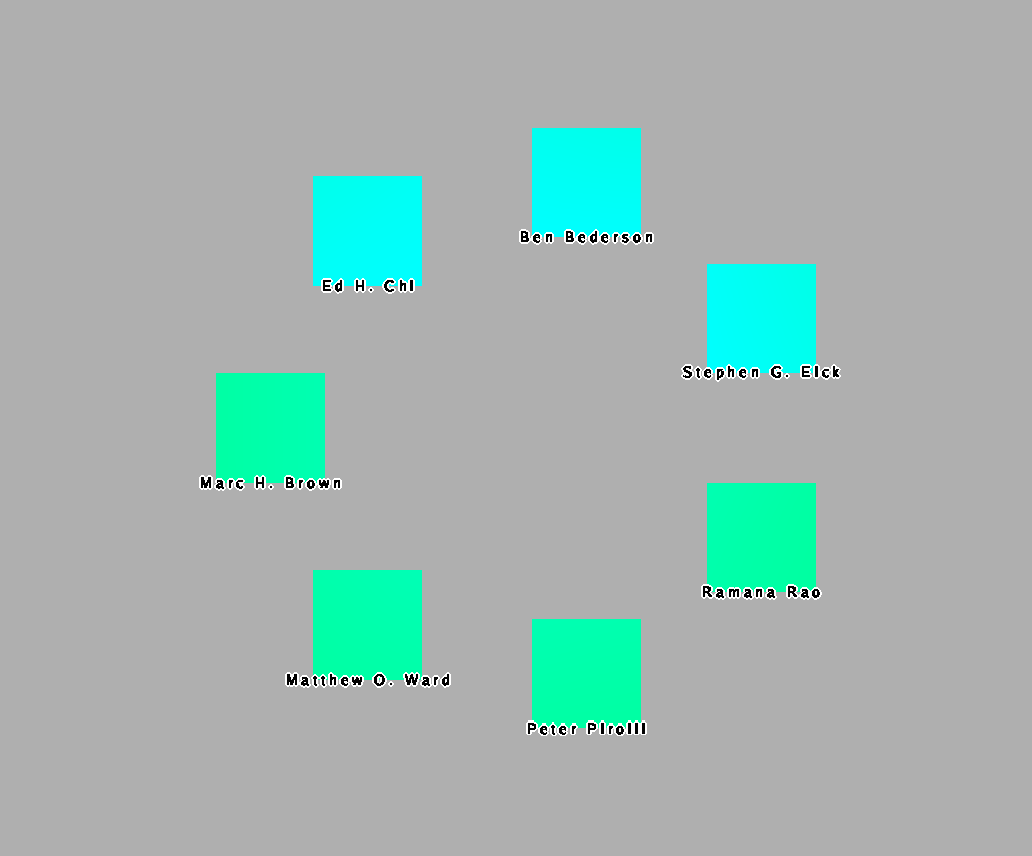
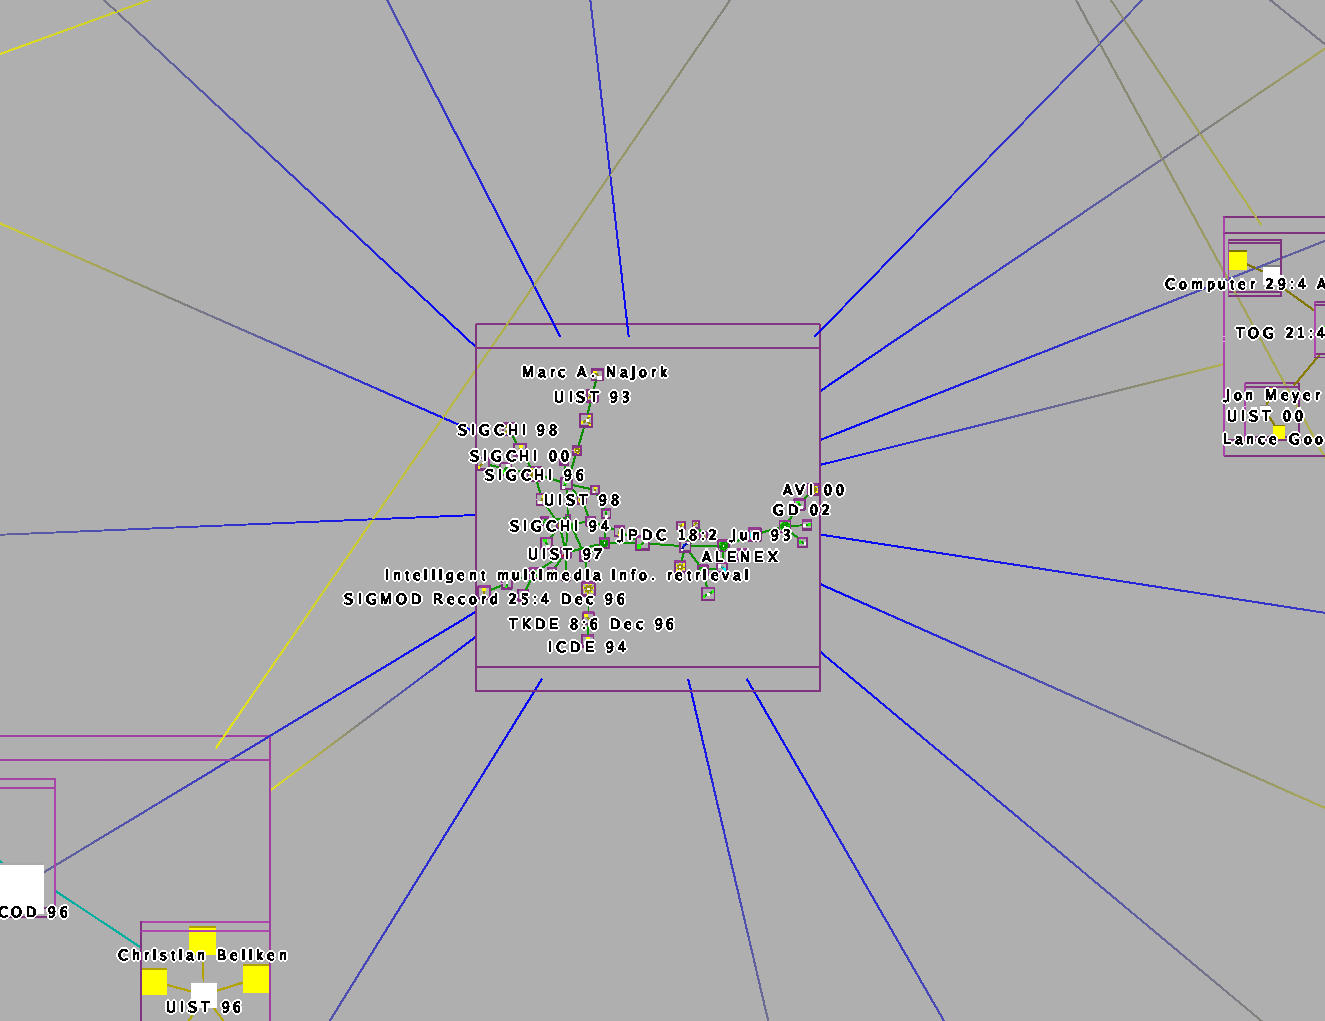
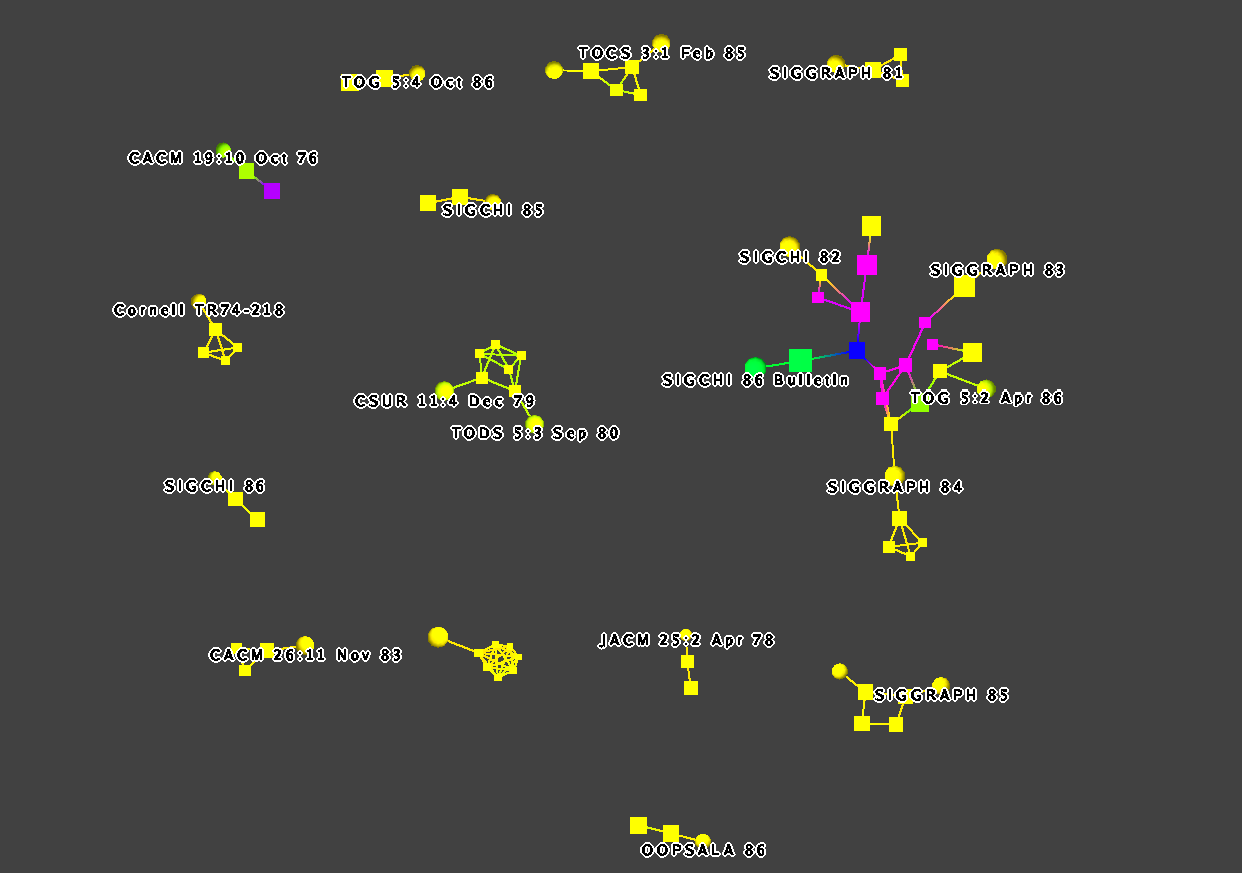
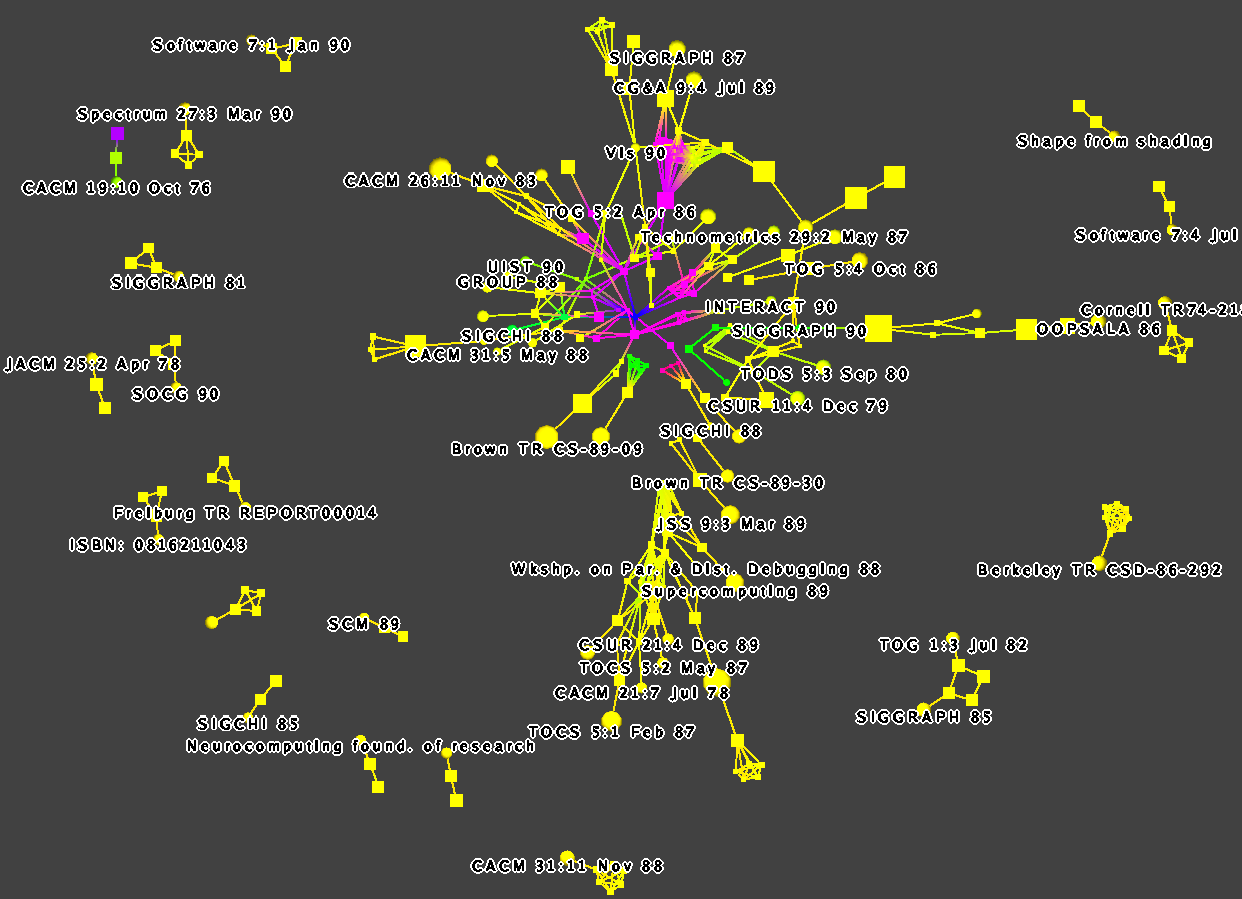
dataset. This time, we can see more links. The second picture shows
the reachable subgraph that is 1 hop away from this node, and it is
considerably bigger than before. We again save that subgraph so that
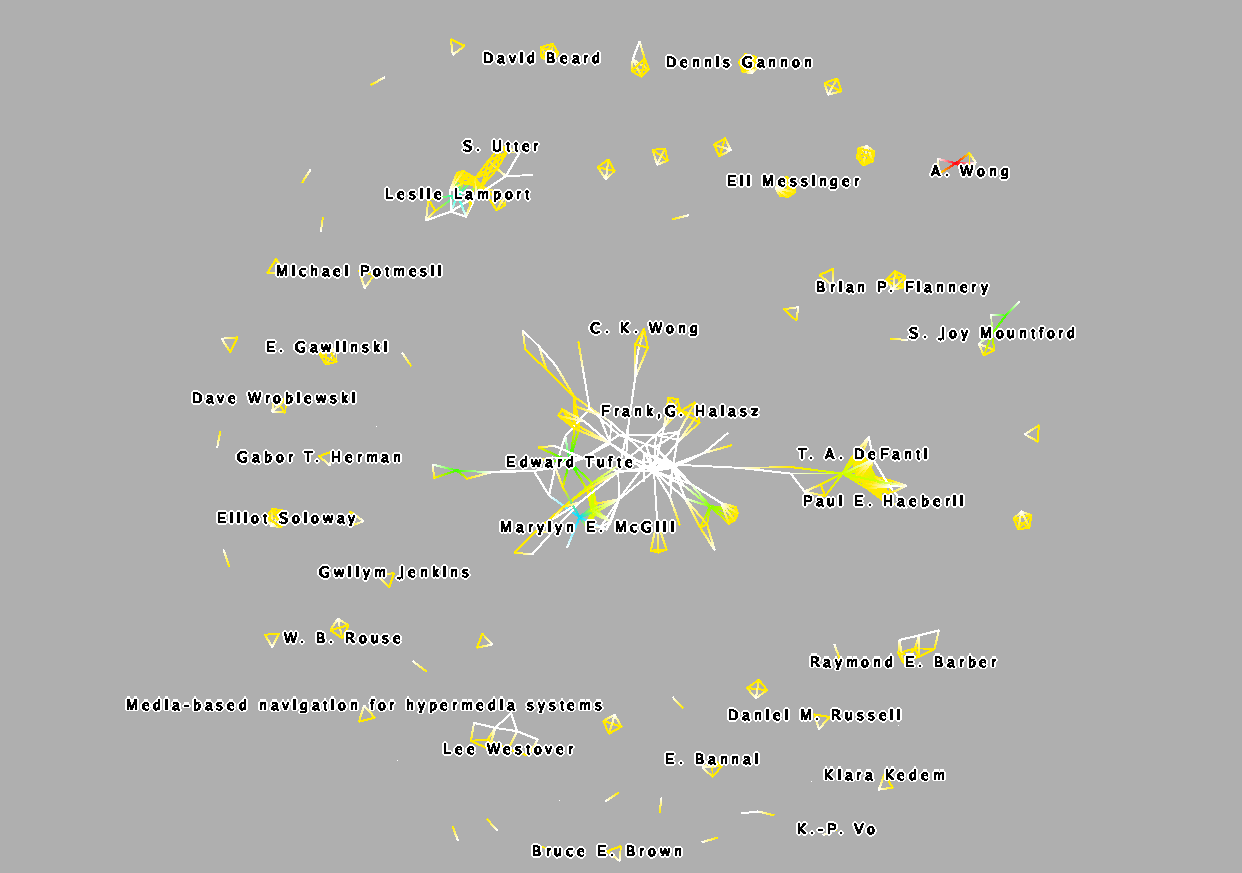
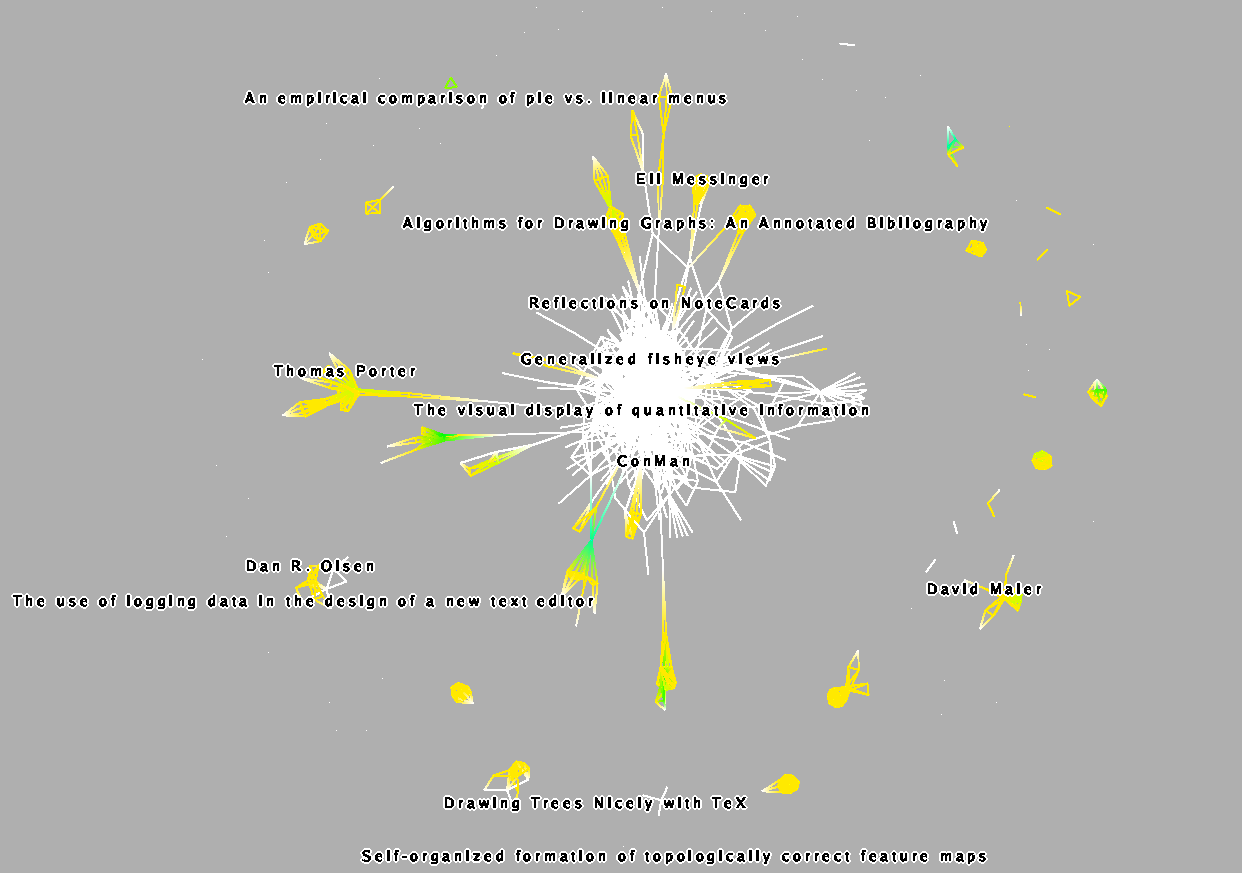
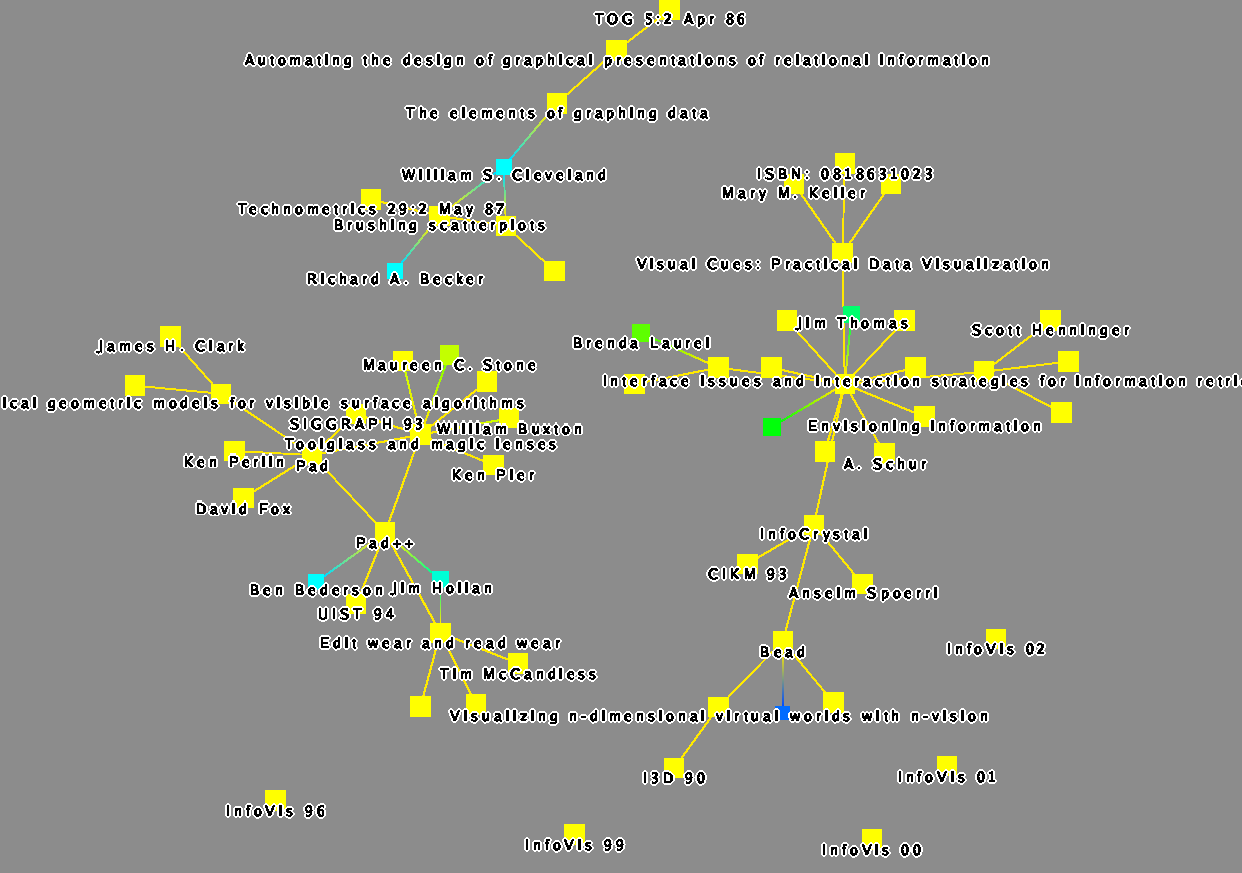
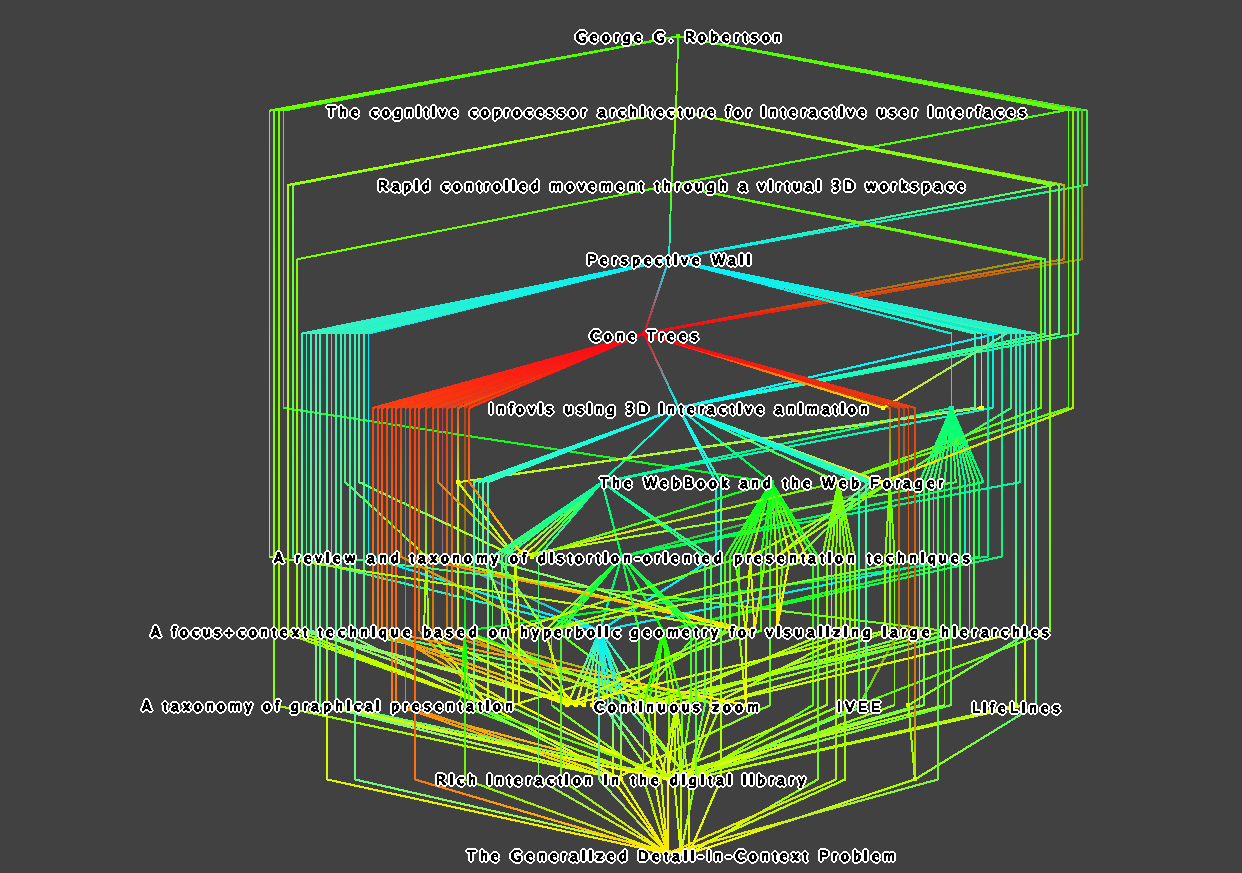
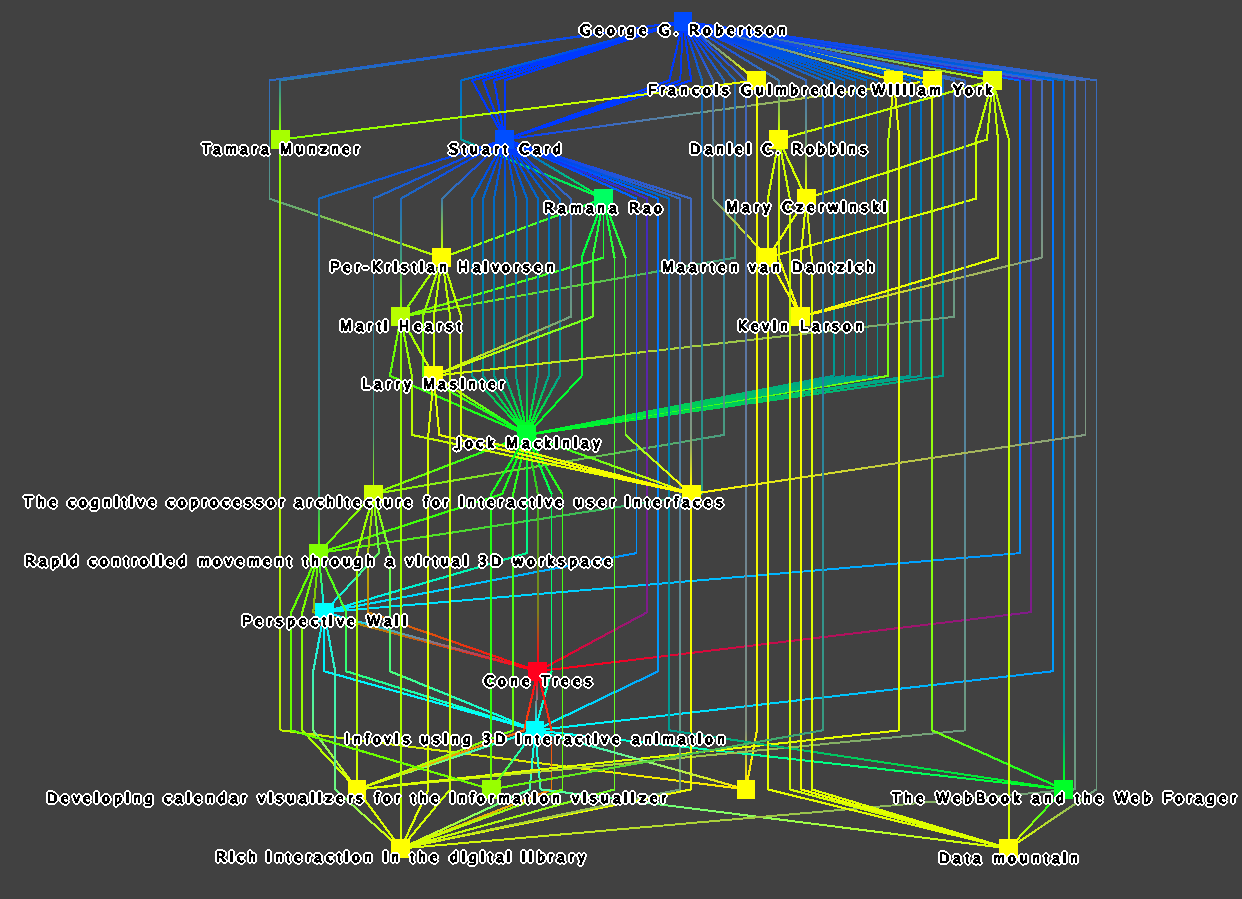
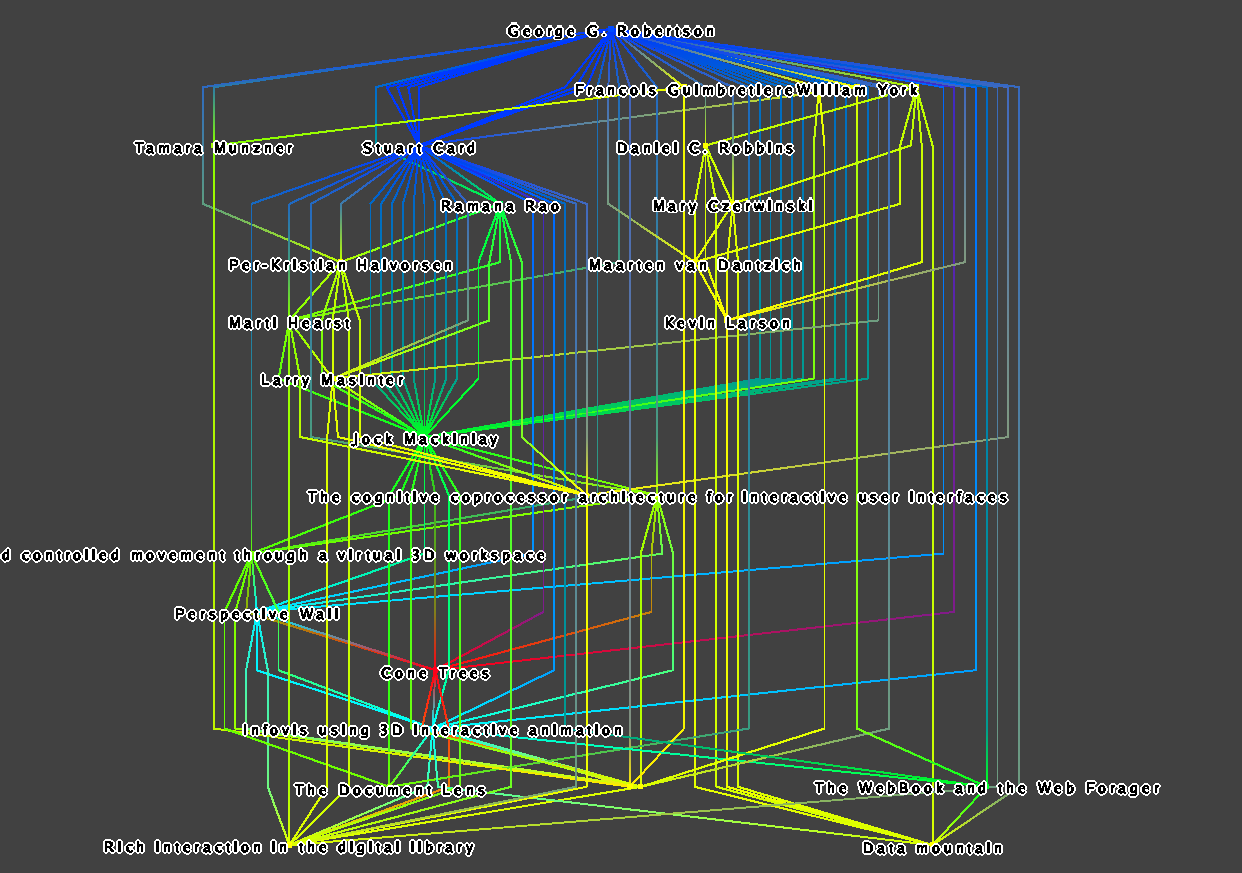
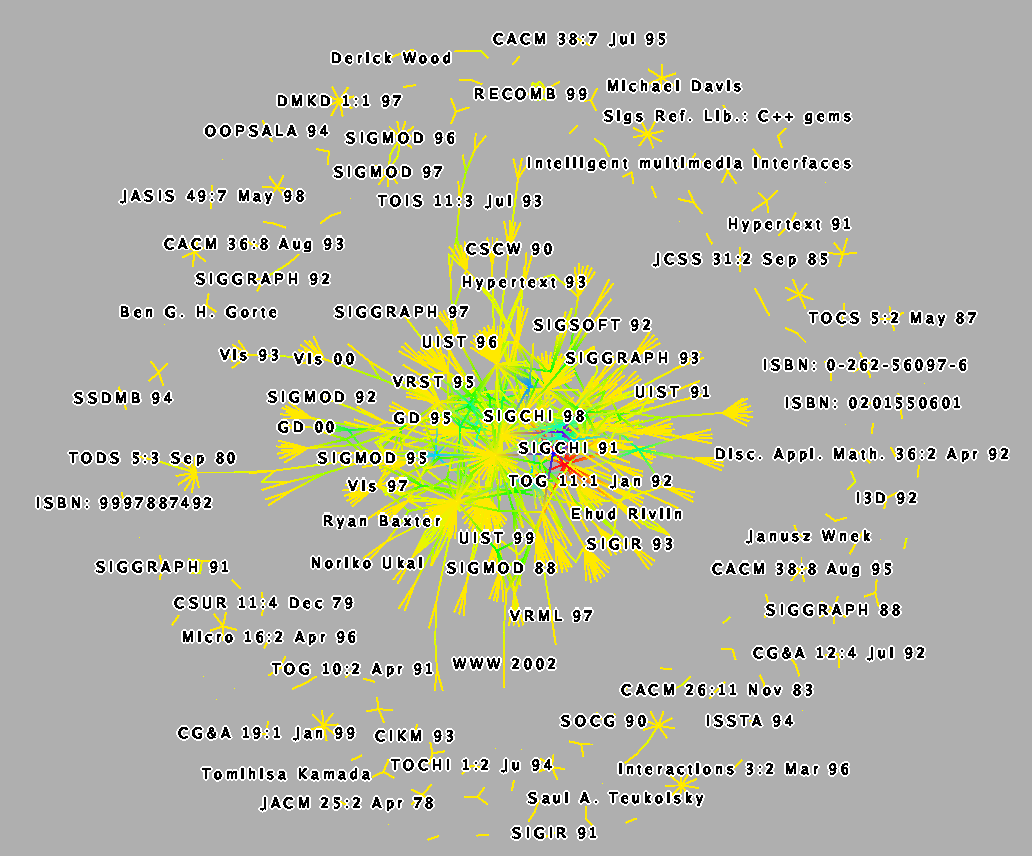
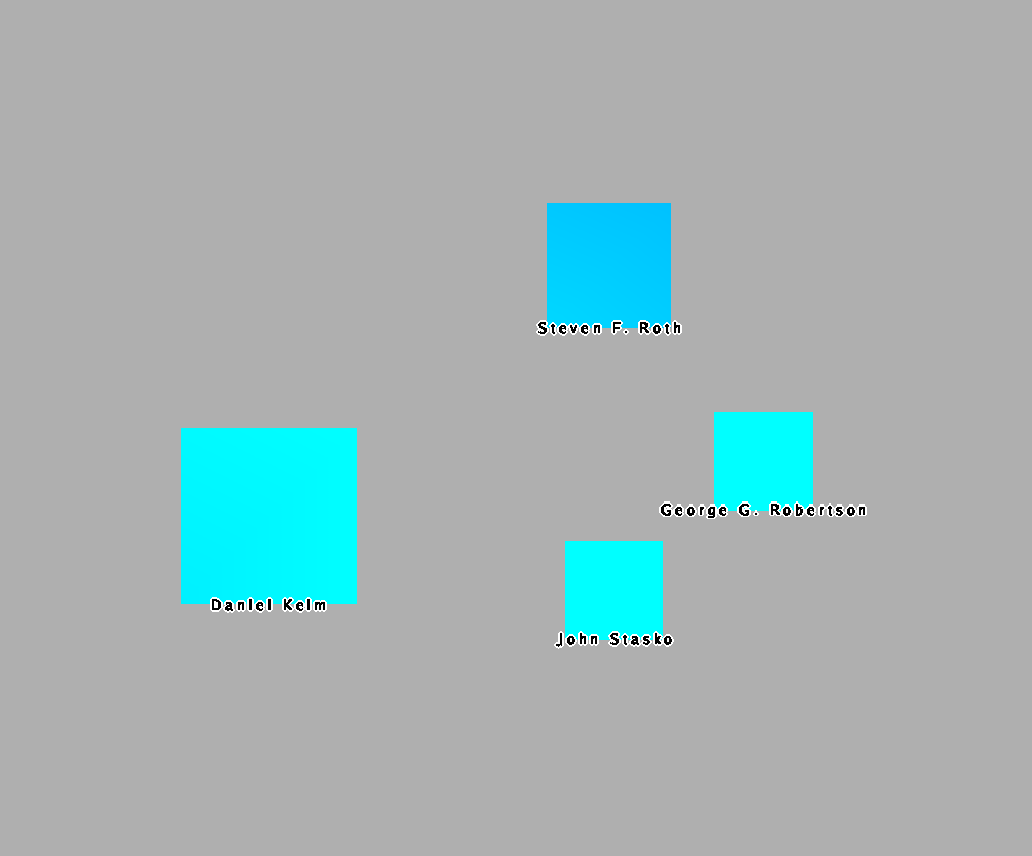
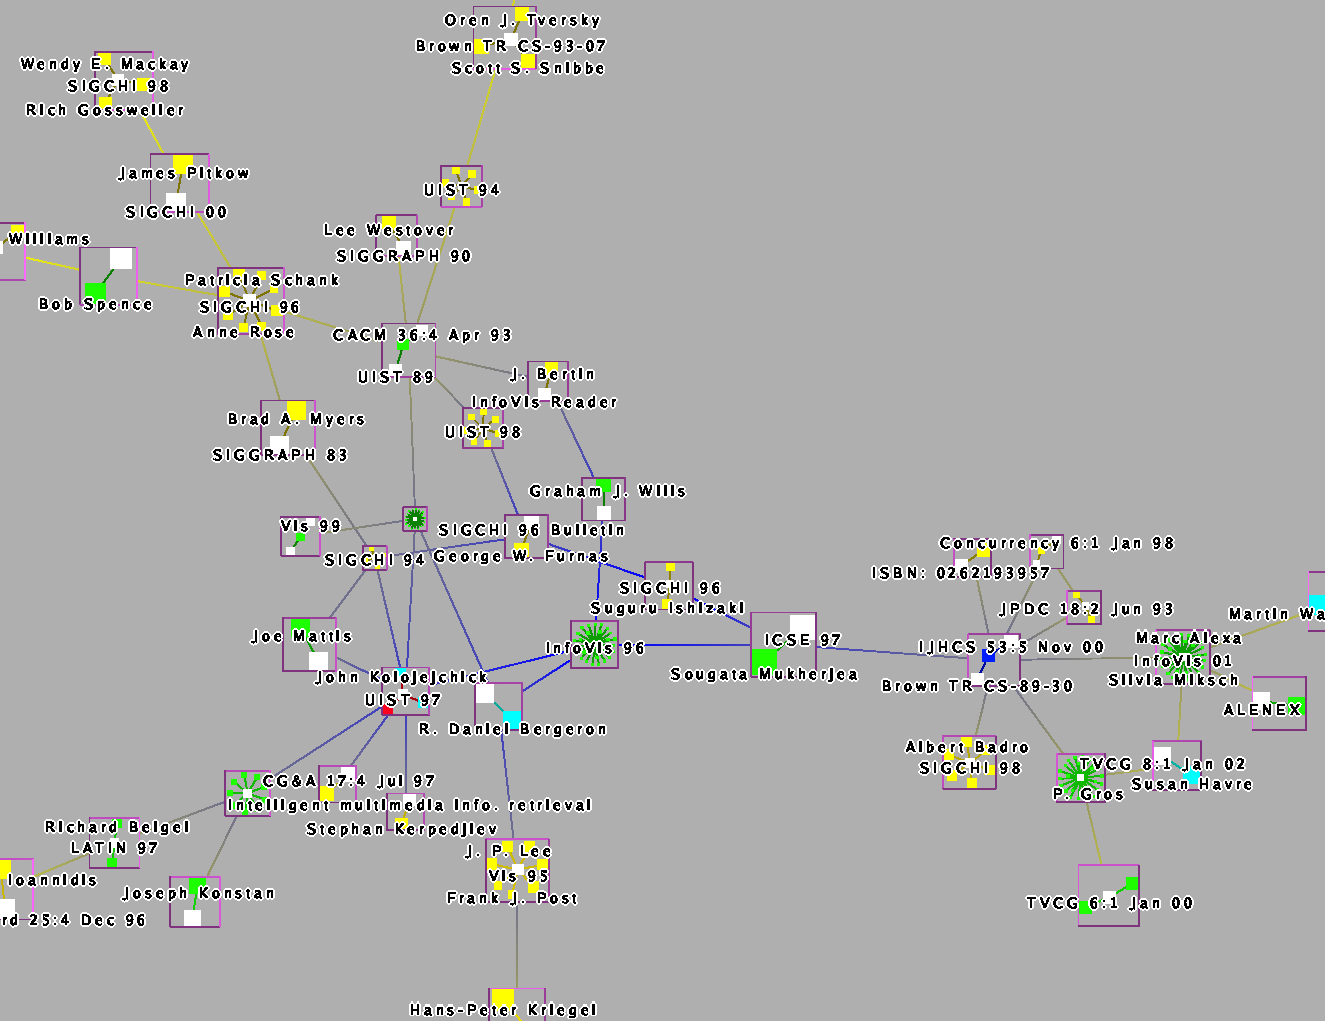
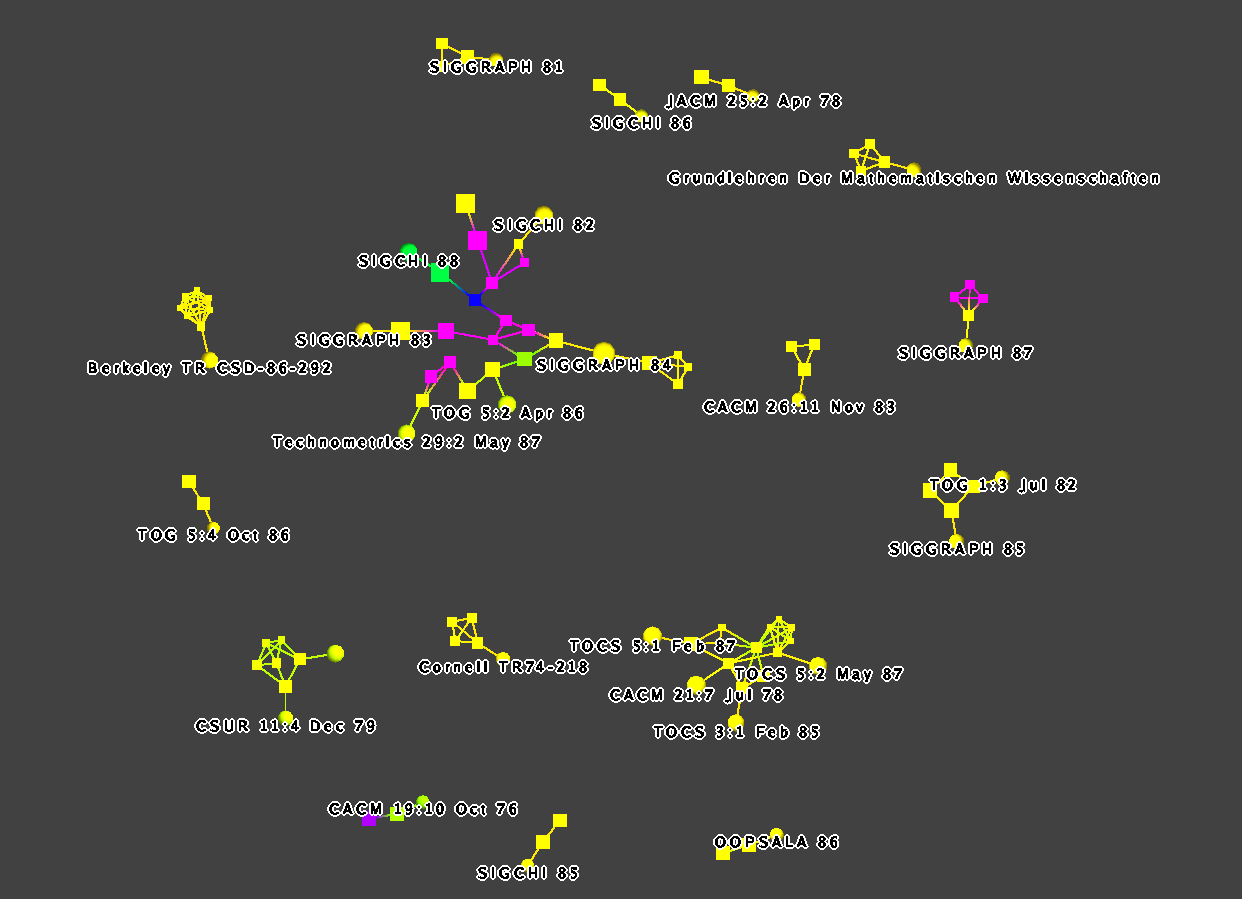
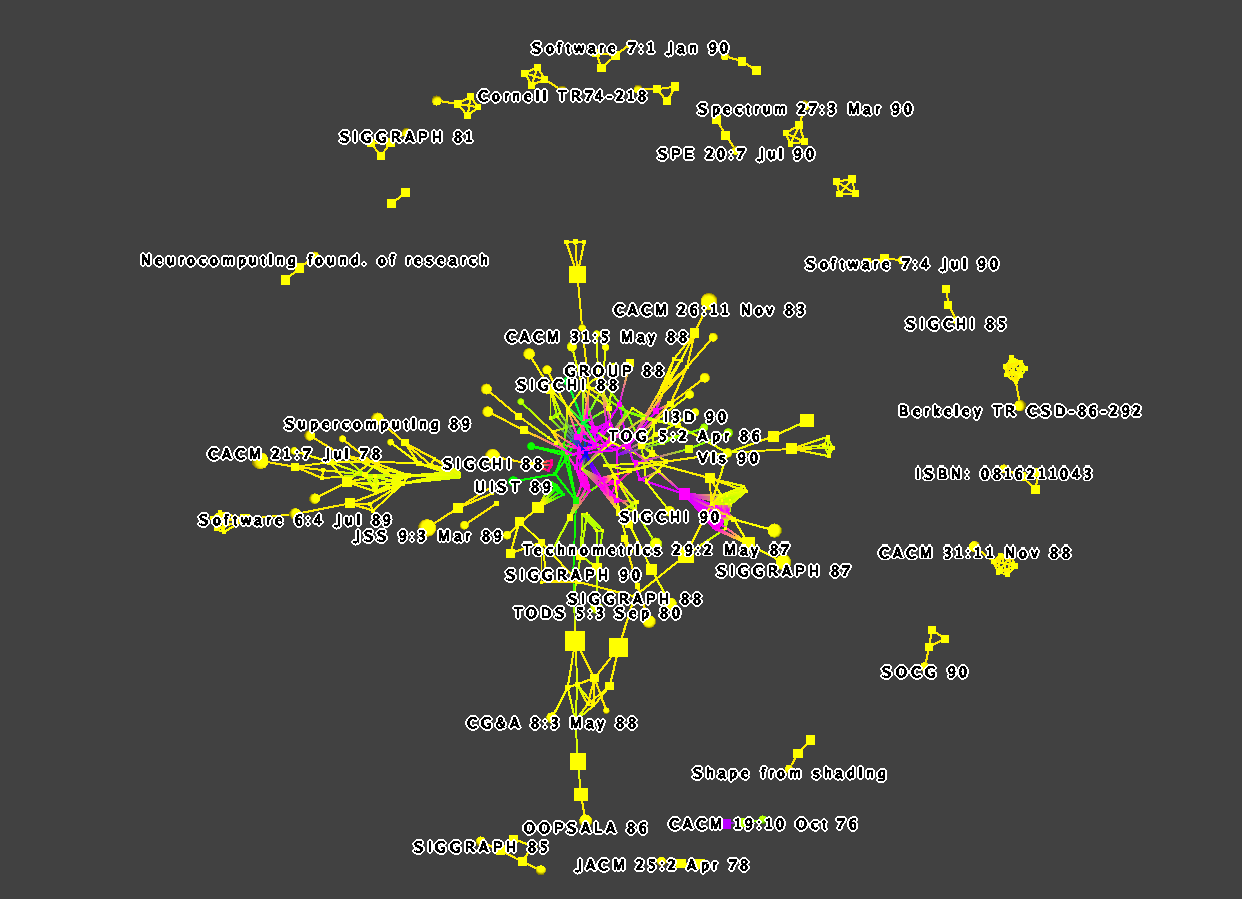
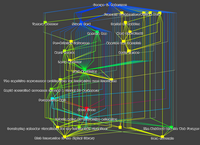
we can apply different layouts to it. The third picture shows a
hierarchical layout, and we see not only Robertson's papers but also
his coauthors. The hierarchical layout automatically places the
coauthors near the top, and the papers near the bottom, again with the
ability to quickly see the rough order in which the papers were
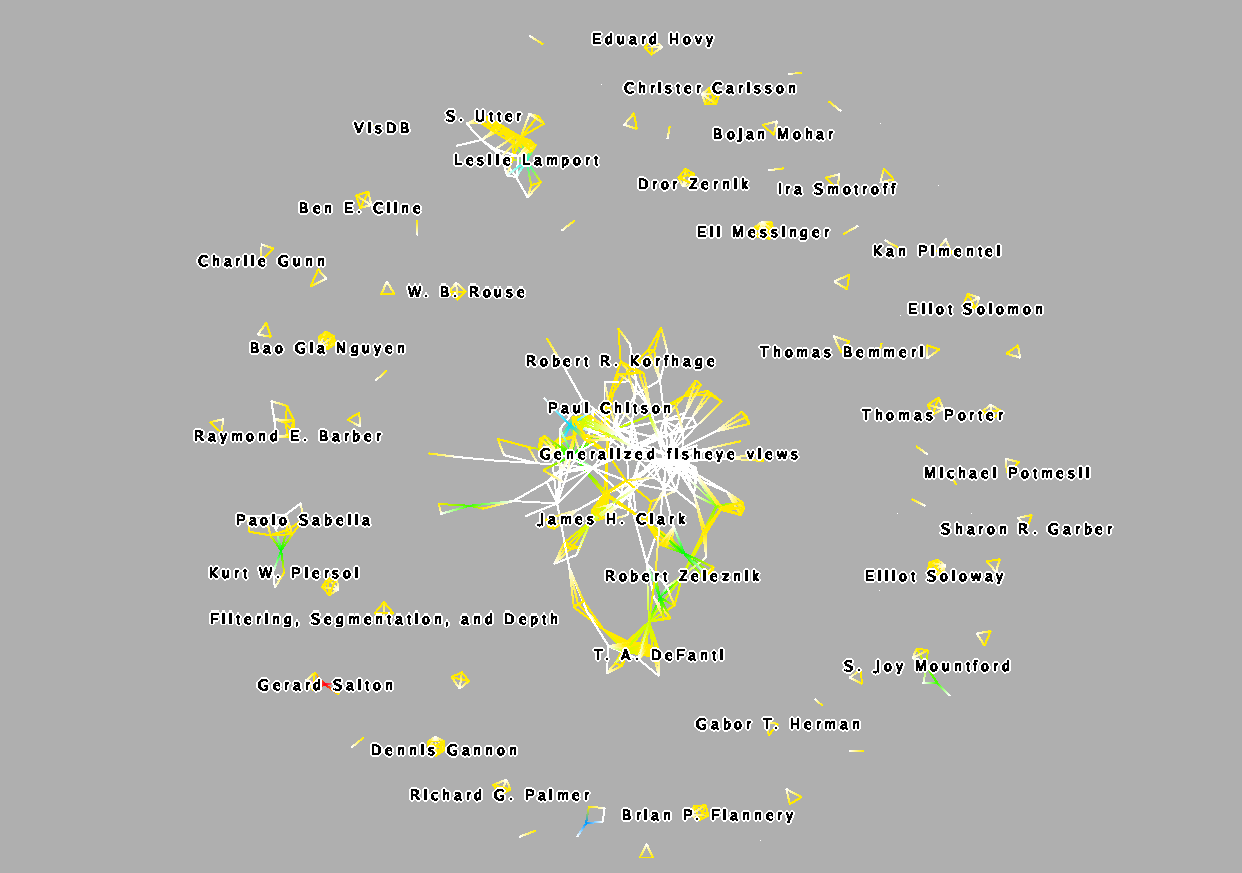
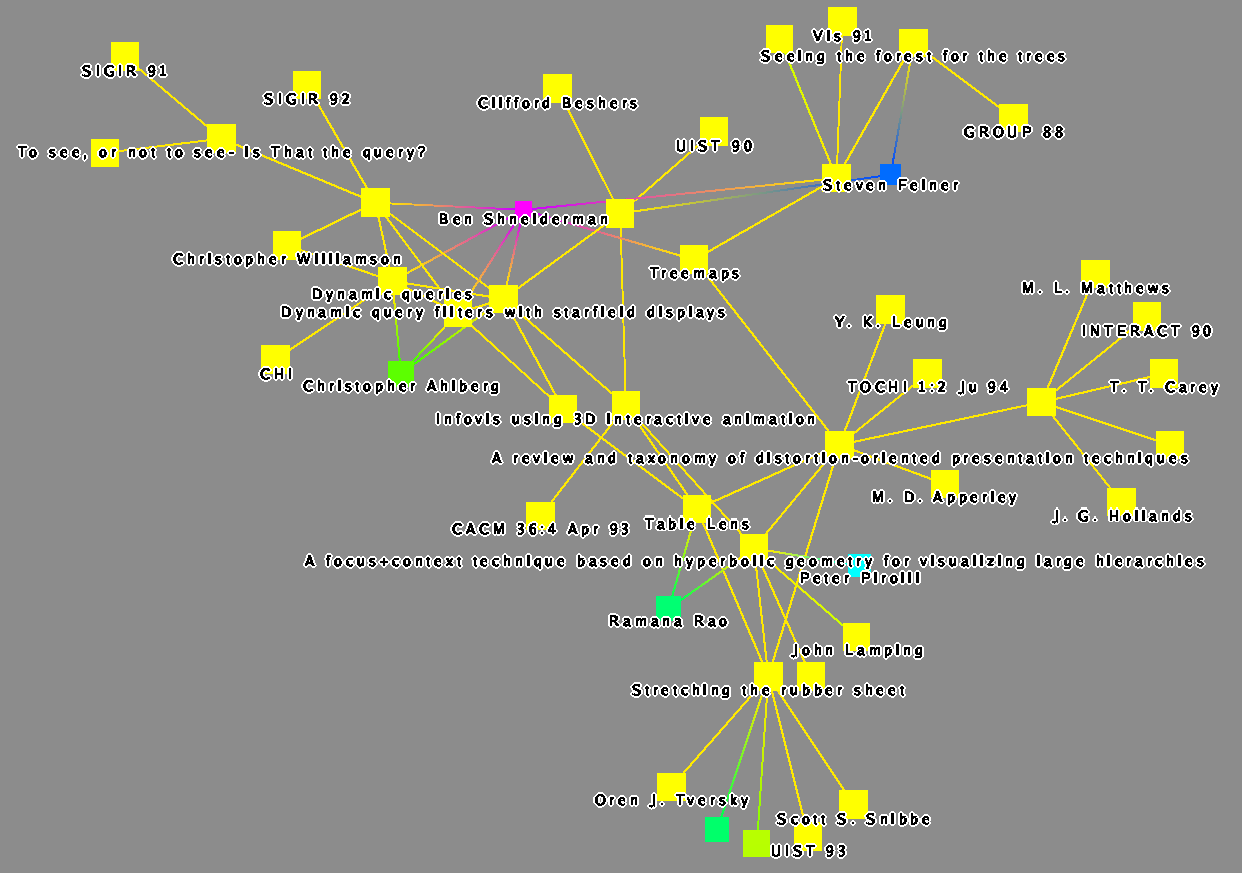
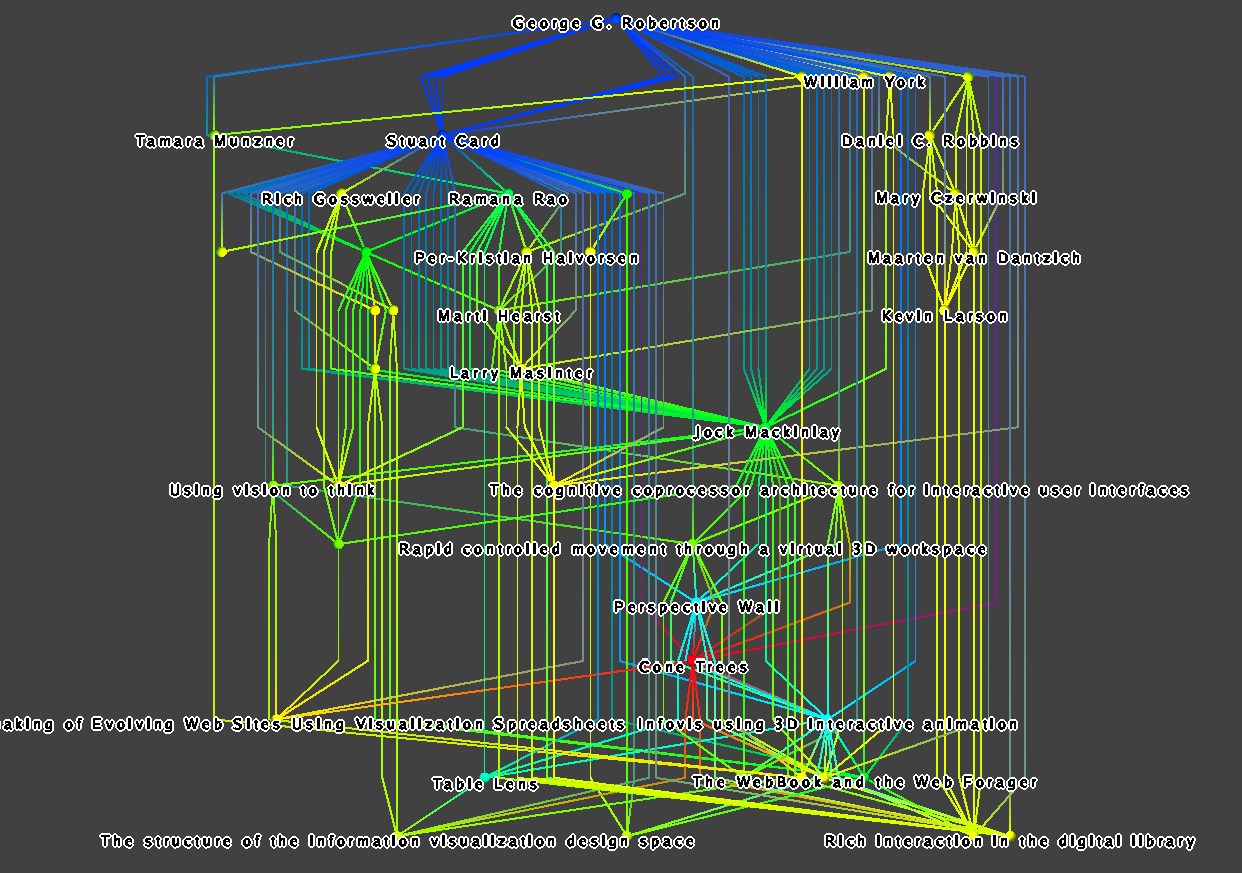
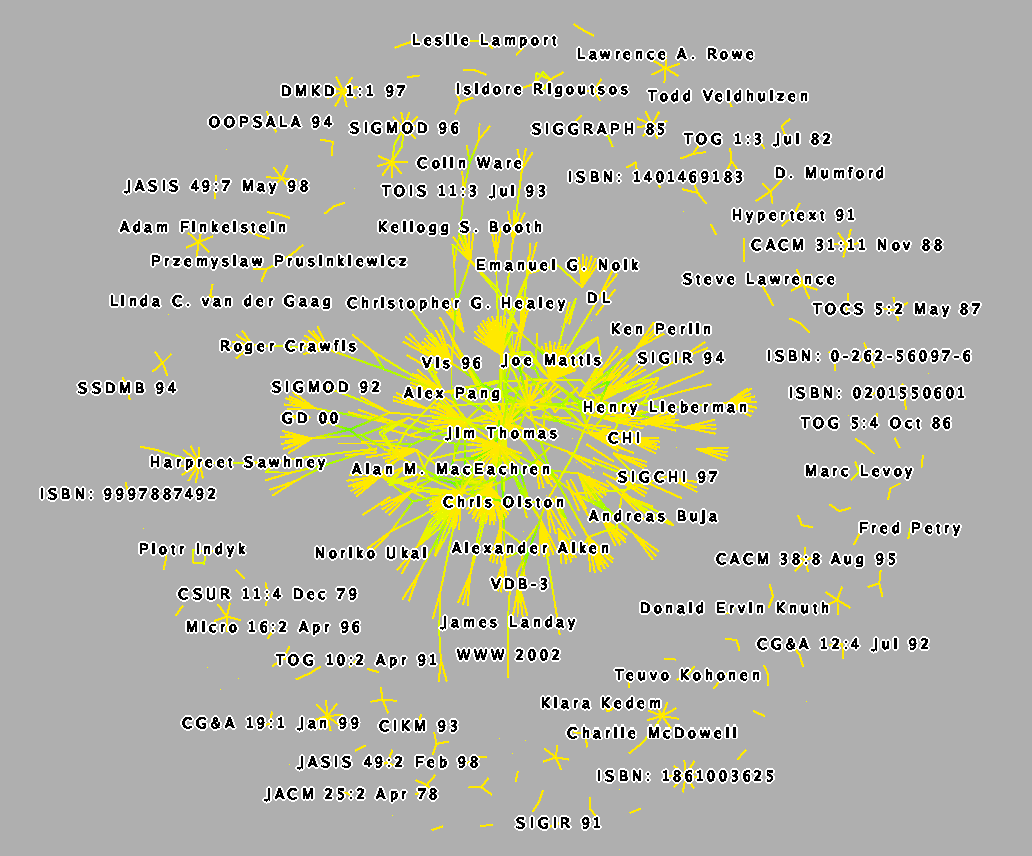
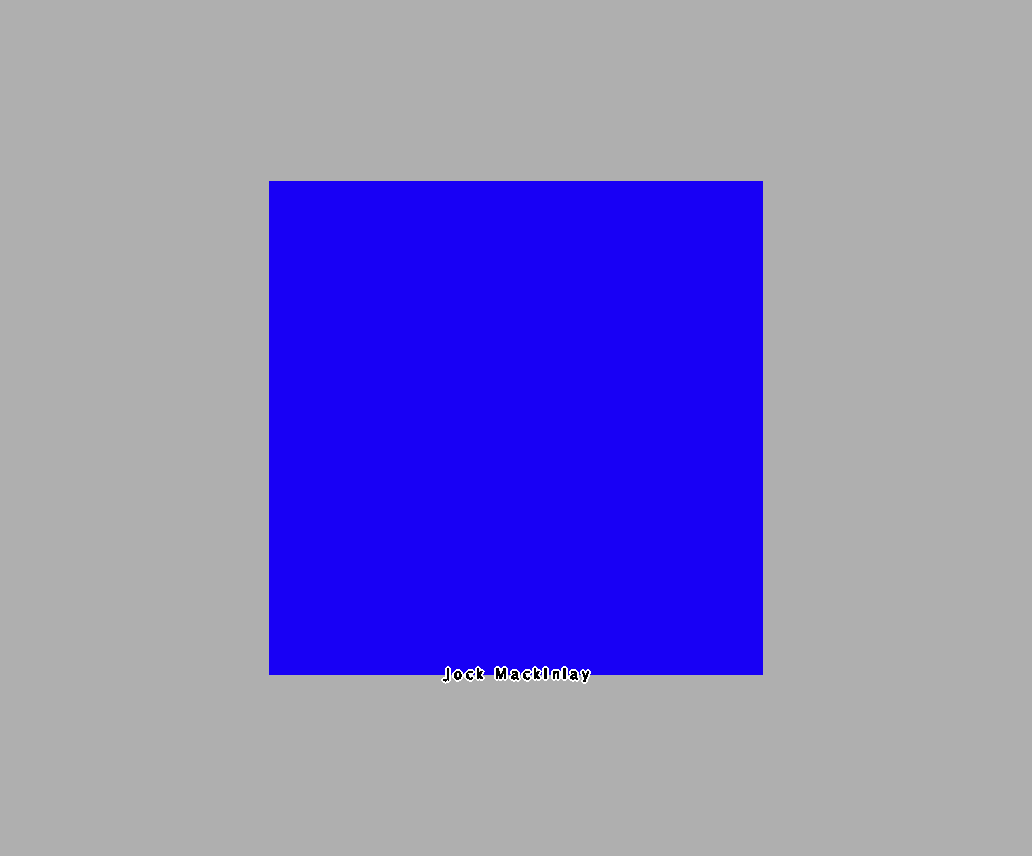
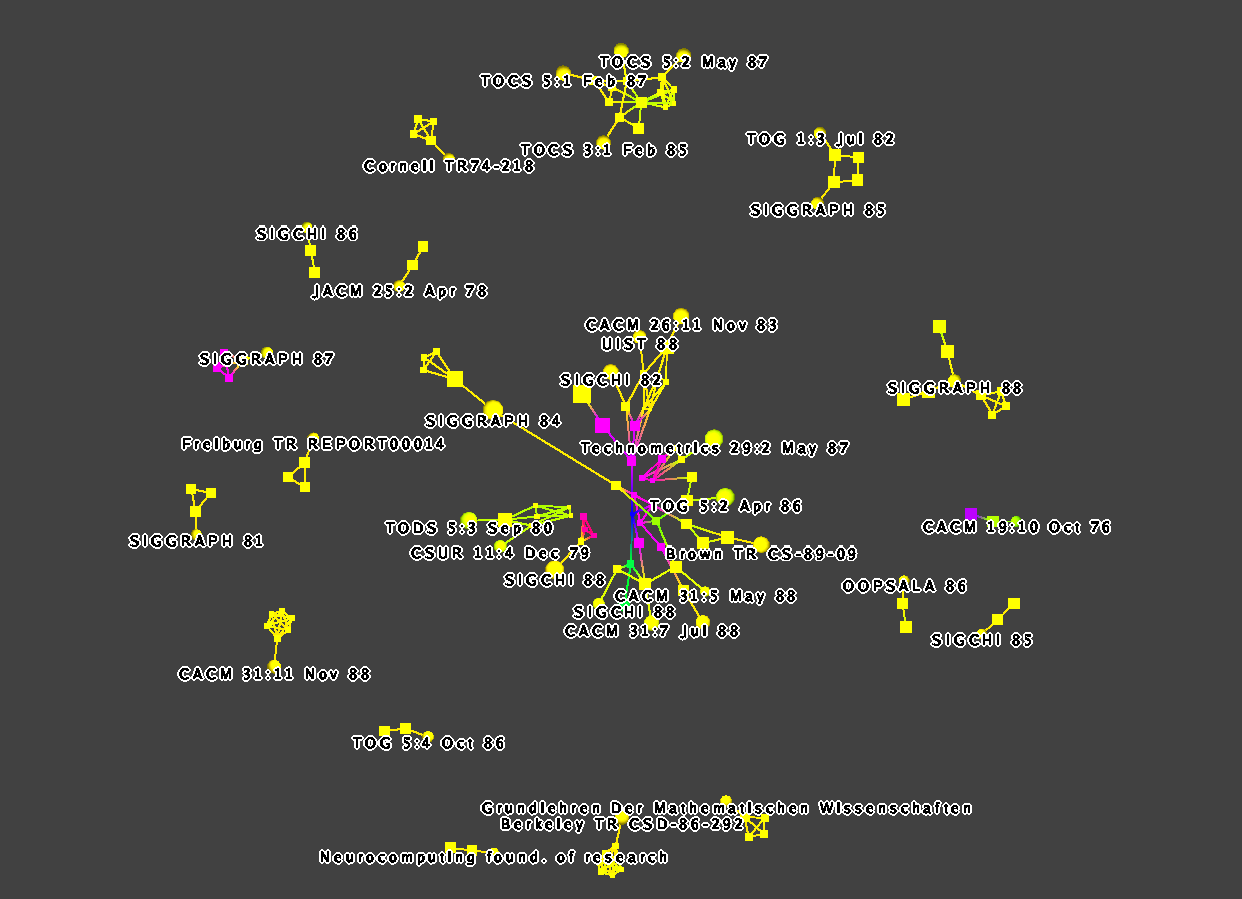
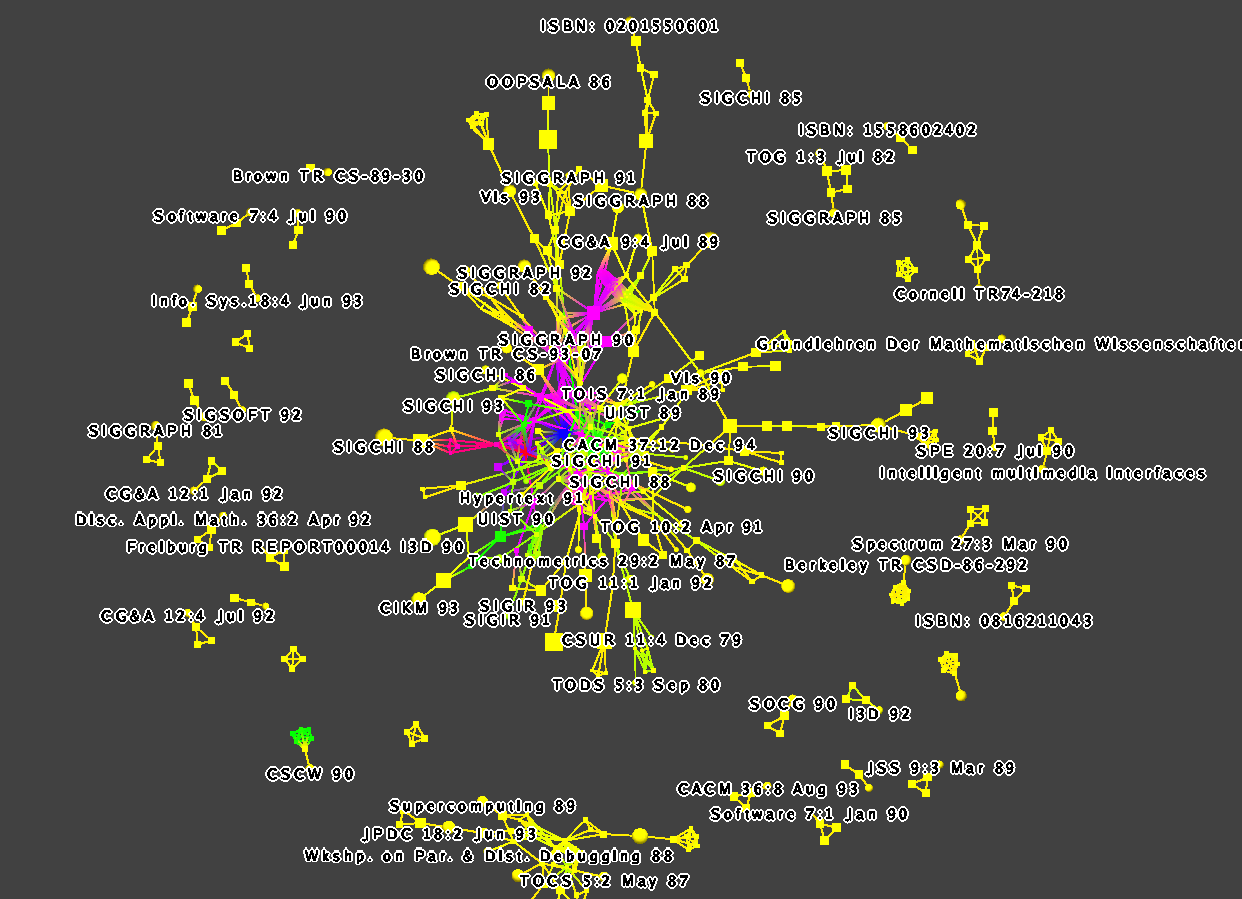
written. The fourth picture shows the usual force-directed layout that
we have been using in most images, and it is easier to see
coauthorship clusters in this view.