Fishery View
Improvement of Time Series Line Chart Visualization of Fishery Data
CPSC 533C Course Project Proposa
November 4, 2005
Project Team:
Ying Zhang, yingzhan@cs.ubc.ca
Lan Wu, wlmakeit@cs.ubc.ca
Project Consultant: Sherman Lai at UBC Fishery Department
Project Domain, Task, and Dataset:
The UBC Fishery Department has a software application system called
Ecopath, developed along with an ongoing research project using present
and historical records of marine species population and biometrics to
analyze and predict the trends of fish population with respect to the
interconnection of marine species in a food network and the degree of
human fishing impact on the marine population.
Currently the prediction of impact on fishing is presented in
form of a line chart with fish groups represented by different colors.
However, due to the number of lines drawn on the screen, the chart
suffers from an overload of visual information cluttering and
overlapping. Thus, it is very difficult to retrieve any comprehensive
information from the line chart system. See Figure 1. Groups of
different fish species are interrelated though a diet matrix table that
describes the amount of each group eats another group.
The project aims to optimize the line charts of fish population
and visualize the information and trends in a more comprehensible way
and give viewers a clear visual representation and interaction of the
line chart.
The project is based on the data provided by the UBC Fishery Department.
| |
Striped bass YOY |
Striped bass resident |
Striped bass migratory |
reef assoc. fish |
| Striped bass YOY |
0.0 |
0.454 |
0.454 |
0.454 |
| Striped bass resident |
0.031 |
0.0 |
0.004 |
0.147 |
| Striped bass migratory |
4.447 |
0.160 |
0.0 |
0.046 |
| reef assoc. fish |
0.536 |
0.423 |
1.026 |
0.0 |
Personal Expertise:
Humans will often fail when
presented with a large set of data in many variables, and faced with
analyzing the data to discover trends or outliers. Multiple views are
often required to discover correlations as well as keep track of
relationships between different dimensions of data: both questions and
individual respondents. In terms of expertise, although Ying has taken an introductory
biology course at UBC, and neither Ying nor Lan has any background in
fishery, this seems like an interesting problem.
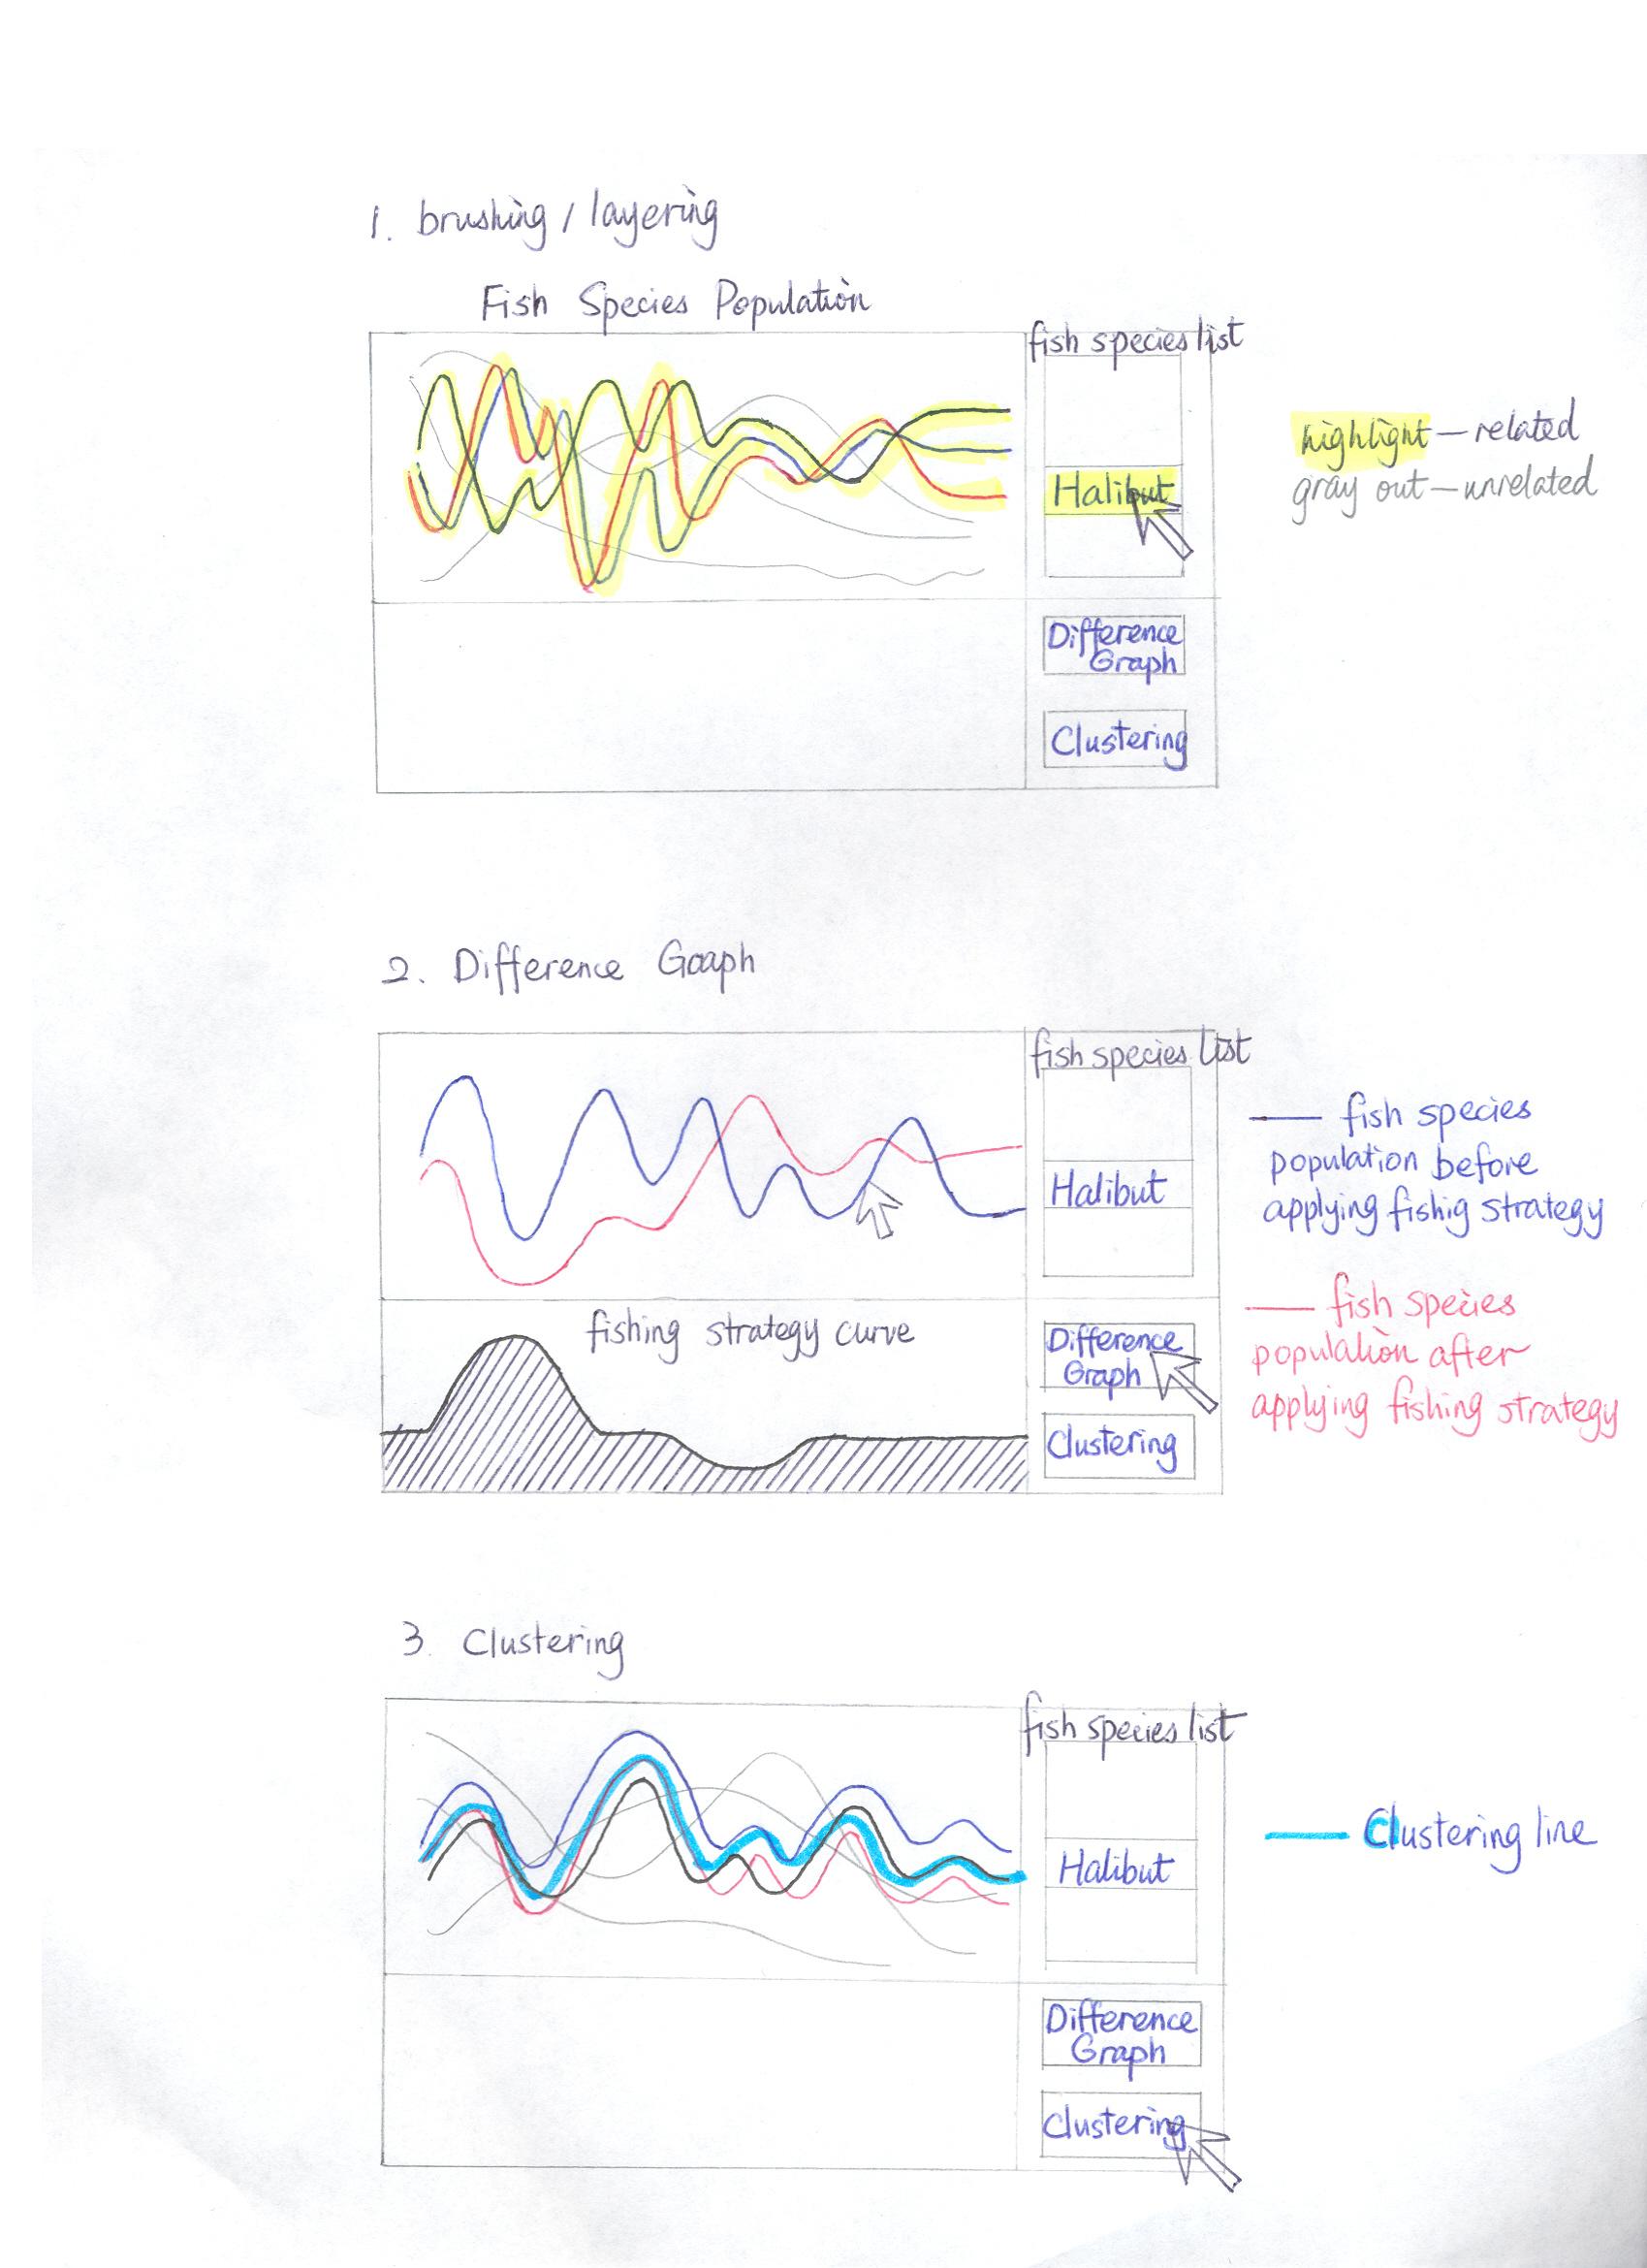
Proposed Infovis Solution:
- Line Layering with Brushing through th e Names of Fish Species.
The idea of line layering is to differentiate fish species that are
related via the diet matrix table from the ones that are not related.
By moving the mouse onto the top of a line of a specific fish species,
all the lines of its related fish species will be highlighted based on
the diet matrix using a multiple color scheme. With respect to the
highlighted lines, any other lines of unrelated fish species will be
put in the background in gray color.
- Difference Graph. The idea of difference graph is to present
the change of fish population before and after a fishing strategy is
applied. The difference is computed between the set of data points of
the current population of a fish species and that of the same fish
population after a fishing strategy is applied. After the data set of
difference is calculated, only the difference between the two
populations is plotted on the graph.
- Line Clustering. The idea of line clustering is to group n
similar lines of several fish species and present them using a new set
of n number of lines to indicate a trend. There does not appear to be
any existing line clustering library implemented; thus, an algorithm is
proposed as the following:For each and every pair of lines, the average
sum of squared difference between one line and another line will be
calculated and store in an n x n matrix. Then given the number of
clusters required, lines are grouped with respect to the smallest sum
of squared difference to form a new line.In case the line clustering
idea becomes unfeasible due to time constraint, the following optional
solution will be proposed.
Optional Solutions:
- Line Chart Zooming. For the current line charts, all the
lines drawn are on top of each other with very little deviations from
one line to another. This causes extreme visual occlusion and
overlapping. Zooming targets at this problem by enlarging a specific
area of the line chart to a certain scale so that the difference among
the lines can be easily viewed.
- Auto-Scrolling. The fish index list, Figure 1, contains the
names of hundreds of marine species. Each time, only part of the list
is visible in the window beside the line graph. Auto-scrolling targets
at this problem by automatically scrolling down the list when the mouse
reaches the end of the index window.
Usage Scenario:
The user wants to see the relation of a specific fish species (Halibut)
with other marine biomass in a food web. Since the data is already
available in the Fishery View tool in Ecopath application, the user
activates the application and the tool; he then goes to the line graph
drawing page and clicks the drawing button to have the lines of all
fish species drawn in a plot system.
- Fish Species Name Brushing with Layering Function. The user
moves the mouse to the list of fish index and finds the fish's name
'Halibut'. As the fish's name is hovered over by the mouse, the lines
of Halibut and its related fish species are highlighted with different
color scheme, while all the lines of other unrelated ones are grayed
out. As the user continuously moves the mouse to the name of another
fish species, the same visualization keeps running until he withdraws
the mouse from the fish index list
- Difference Graph Function. The user has already
observed the highlighted lines and the grayed ones above. He also wants
to see a difference graph showing what impact that a fishing strategy
would have on the amount of a specific fish species. So he selects the
line of that fish species on the line graph then moves the mouse
underneath the line graph area and draws a fishing strategy curve.
Afterwards he clicks the button named Difference Graph to have the
difference line of the fish population change drawn in orange on the
line graph with all other fish species lines grayed out.
- Line Clustering Function. Later in the analysis, the
user wants to combine the population of several marine biomasses
belonging to the same habitat location and see the trend. He multiply
selects a few lines on the line graph and clicks the button named
Clustering. All the lines of these selected fish species are clustered
into one highlighted line and drawn in the line graph system.
Implementation Approach:
We propose to improve the
Fishery View tool using Visual Studio.Net. The interaction and
visualization will be implemented using the C#.Net and Visual Basic.Net
Project Milestones
- Nov 1, 2005 - User interview completed. The user interview with
Sherman Lai at UBC Fishery Department helped us to get familiar with
EcoPath and get to know what he wants to improve.
- Nov 4, 2005 - Proposal completed
- Nov 5-12, 2005 - Further test the feasibility of our proposal.
Especially, we are not sure whether we can implement the line
clustering function at this moment
- Nov 13, 2005 - Proposal update completed with updated milestones
- Nov 22, 2005 - Building of the software system EcoPath and design of classes.
- Nov 28, 2005 - Implimenting the line clustering function (or another one of optional components)
- Dec 4, 2005 - Implimenting the difference graph function
- Dec 10, 2005 - Implementating Fish Name Brushing with layering. Implementation phase completed
- Dec 14, 2005 - Testing.
- Dec 19, 2005 - Final presentation and final report completed