Building a Better Visualization for Mp3 Collections
Project Proposal - CPSC 533C
Dave Ternes (dternes@cs.ubc.ca)
“Organizing CDs or records is a *lot* more fun than organizing computer files; that's just a proven fact!”
-Chuck Eddy, Senior Music Editor, The Village Voice
The above received wisdom need not be so. The failure of current computer systems to create a pleasing environment in which to organize and peruse music files is merely a contingent result that can be overcome with sufficient imagination and effort.
Domain, Task, and Dataset
The standard way of organizing mp3 is to store them in a variety of folders, classified by artist, release, or by genre. A slightly more advanced method is offered by systems like iTunes, which allows users to filter music according to artist, album or genre, or display them all. In either way, the interaction is very similar: a large list of songs with must be browsed through in order to play a song or series of songs. I wish to provide a different way of viewing, organizing and playing a collection of mp3s, specifically focusing on the genres of music that various mp3 fall into, and the relationship between them. In this regard, I am particularly interested in the various genres of electronic music. These genres are particularly liable to subcategorization and a proliferation of different, obscure genres, all of which are often closely interrelated. Artists tend to move fluidly from one area to the next, often straddling several genres at once. This multiplicity of genre within a single artist or even song is one of the things that I wish to deal with in my system. Thus the goal of my project is to create an easy and pleasant to use system for browsing and organizing a large collection of mp3s.
The aim of my system is to support two major tasks. One is the ability to freely organize and browse a large mp3 collection. The other is to be able to create interesting playlists using the relations amongst genres. In order to support these two tasks, a third task must be supported, which is the tagging of mp3 with various genres. This will be key in allowing the first two tasks to succeed. It is assumed that most people with large collections of mp3s will be fairly seriously into music, and so will be willing and knowledgeable enough to put in the effort to categorize their music.
For a dataset I plan to use the approximately 7000 songs in my current mp3 collection (50+ GB), which is comprised of about 3000 different artists. The mp3s are currently sorted by 30 different high-level genres (though not all mp3s are tagged with these genres), and then by artists. Within these high-level genres, I estimate that there are around 70-80 different subgenres that could be classified.
Personal Expertise
In my spare time I am what many people might call a music obsessive. I spend many hours a day listening to, reading about, and thinking about music. My tastes vary quite widely, from Pop to Hip Hop to Dancehall and to many different areas of Rock; however, my true love is House, Techno, and various other areas of electronic dance music. I have a very large collection of mp3s (50+ GB) as well as hundreds of CDs and records, so the issue of organizing and browsing large collections of music is one that I have dealt with extensively and have an invested interest in improving.
I have a reasonably strong background in GUI development, having experience with it in both industry and at school. Unfortunately, though, I have fairly little pure graphical programming expertise.
Proposed Infovis Solution
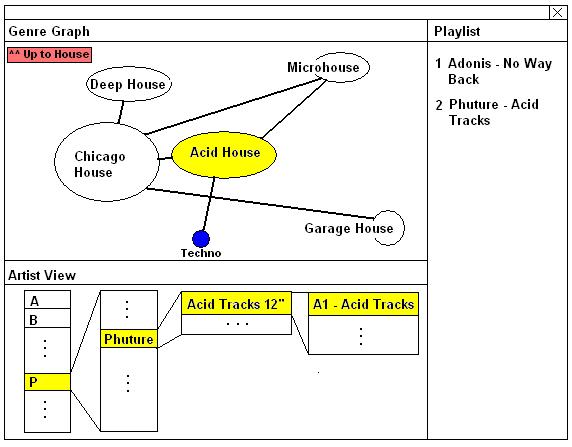
My proposed solution is based upon leveraging the relation of songs and artists to different genres. There are three main areas to the system: the Genre Graph, the Artist View, and the Playlist View (see Figure1). The most important is the graph of all the genres that the mp3 collection falls into. Navigating through this graph, the user can select one or more genres, and choose to view all the artists that have songs within the intersection of these genres. The list of artists is displayed in the Artist View, which contains an alphabetized list of all the artists. From there users can browse a particular artist’s releases, and then the songs on each release. At any stage in the browsing, the user can enqueue the entire genre, artist, release or song in the playlist. While browsing, the user can also choose to view Genre Graph any of the other genres that an artist, release, or song is in. The playlist is a simple list of songs to be played in the specified order that can be added to, rearranged and deleted from at any point during the interaction. The goal is to have the playlist integrated with an mp3 player, either within the program, or by using exporting playlist files that can then be run in popular mp3 players such as Winamp or Windows Media Player.
Figure 1: Basic Interface Layout
The difficult and interesting visualization problem in this is clearly then the Genre Graph. My goal is to build the genre graph up from the genre tags of the mp3s themselves. For every genre an mp3 is tagged with, a link will be drawn joining these two genres. The size of the nodes will be proportional to the number of mp3s tagged with that genre. This idea presents two main problems: how to ensure that people have actually tagged all of their mp3s (and hopefully with more than one genre, in many cases), and how to ensure that the graph is laid out in a reasonable and informative manner and does not become overly cluttered with interlinked nodes.
To solve the first issue, I propose to use an easy graphical drag-and-drop style interaction for adding existing artists/releases/songs to genres. Users will be able to create new genres which to tag mp3s with or use existing ones. I will also allow for the creation of wholesale links between genres, such as setting all Deep House to also fall under House, and thus tagging large bulks of mp3s at once. Additionally, a Wizard-style importing feature will be needed in order to get a user's mp3 collection into a roughly usable state. This will still require a fairly large investment of time and effort into getting started with the system, which is one of the reasons why this is aimed at serious music enthusiasts, who already spend a lot of time organizing and dealing with music. The upside is that by allowing users to define their own genres and the connections between them, the Genre Graph will reflect their own view and understanding of the music they own, rather than one proscribed by the critical canon.
To solve the second issue of visual clutter, I propose to use some basic clustering algorithms in order to group genres into related genres as well as subgenre-supergenre relationships. The first idea is to use a force-directed layout algorithm where genres that are heavily interlinked are more attracted to each other, while genres that are less interlinked (or not linked at all) are repelled from each other. This should naturally clump together related genres, which can then can be zoomed in on and viewed up close. Methods for this are discussed in Auber et al. (2003) and Herman et al. (2000). This solves the issue of layout, but may not solve the issue of visual clutter: the node labeled “Rock” will still likely have many, many nodes linking to it. To solve this problem I plan to find thresholds of the number of links coming into a node that, if surpassed, would designate that note as a supergenre, and the nodes that link to it as subgenres. I posit that these supergenres should roughly correspond to the high-level genres that the dataset is already sorted into. Using this division the user would be able to view the graph at a high level, looking only at supergenres, and then expand an individual supergenre in order to explore its subgenres. The success of this technique depends on the tagging of mp3s, so it remains to be seen if this, or another filtering or clustering algorithm will be used. Regardless, in both the clustering and hierarchy cases, users will be able to control the parameters, though reasonable defaults will be found so that the user does not need to alter the controls if he/she does not wish to.
Scenario of Use
Scenario 1: Creating a Playlist:
Chuck has been obsessing over the seminal Acid House classic, Phuture’s “Acid Tracks,” for the last couple of days, and wants to set up a playlist of songs in a similar vein. So he loads up the system, and views the top level of genres (see Figure 2). He sees the “House” node and chooses to view all subgenres. This zooms him in on all genres that are related to House. In this graph he then spots “Acid House,” and chooses to view all artists. The Genre Graph centers itself on Acid House. In the artist view he browses to P->Phuture and see the Acid Tracks 12” release, which he then enqueues in the playlist (see Figure 3). He then notices that Acid Tracks is marked as both Acid House and Chicago House and so chooses to highlight Chicago House in the Genre Graph. He then selects both Acid House and Chicago House and views all artists within the intersection of those two genres. He then browses to his favourite Chicago House producer Larry Heard and enqueues all his tracks, as well as “No Way Back” by Adonis. Chuck then notices that Acid House has a link traveling off to the Techno section. Chuck follows this link and travels into the Techno subgenre area, where he discovers that the link actually goes to the Acid Techno subgenre, which is highlighted (see Figure 4). He then browses to and enqueues Public Energy’s “Three O’ Three” as well as all of his tracks by DBX. Chuck then clicks on “Acid Tracks” in his playlist, which redisplays the song in the Artist View and highlights the Acid House genre in the Genre Graph. He then starts playing the playlist as he continues to browse through the Acid House artist section.
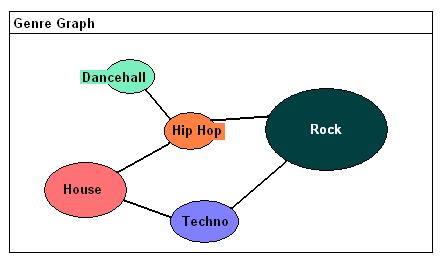
Figure 2: the Genre Graph at the top level of genres
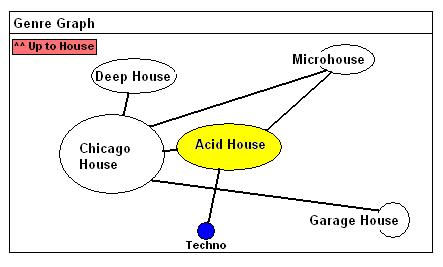
Figure 3: the Genre Graph in the House section, with Acid House highlighted
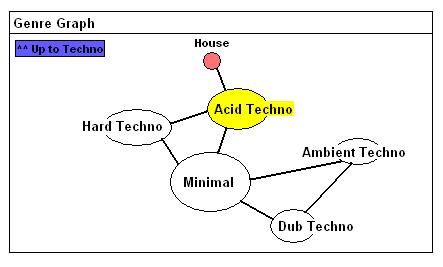
Figure 4: the Genre Graph after traveling from the House section to the Techno section, with Acid Techno highlighted
Scenario 2: Tagging mp3s
Philip is importing a collection of mp3s into the system and wants to tag them according to genre. After selecting the mp3s to import an import Wizard runs, which displays a list of all the artist and songs that do not have genre tags. Philip can select all of an artist’s music and assign it a high level genre like House, Techno or Rock. Once all the mp3s have at least one genre assigned to them, they are imported in, and the Genre Graph is built up. Philip has imported a bunch of Superpitcher tracks, and in the wizard labeled them House. However, he also wants them all labeled as Microhouse, and so creates a new node in the Genre Graph and then drags Superpitcher from the Artist View and drops him on Microhouse. Now all of Superpitcher’s tracks are labeled as Microhouse. Philip has also imported several Dominik Eulberg tracks, and labeled them as Techno. He wishes to label these tracks as both Electrohouse and K-House, so he creates these nodes, and drags Dominik Eulberg onto both of them in order to label them. However, Philip also feels that both Electrohouse and K-House should be considered House, and so draws a link connecting Electrohouse and K-House to House, thus making all Electrohouse and K-House tracks also defined as House. Thus Dominik Eulberg can be accessed through both Techno and House, which Philip likes because he thinks Eulberg straddles the line between the two genres.
Implementation
The system will be implemented using Java and the Eclipse IDE. The Prefuse java toolkit will be used for graph drawing.
Milestones
November 4 – Project Proosal Due
November 10 – Familiarized myself with Prefuse toolkit for making graphs, and some method of reading in mp3 tags.
November 15 – Create a first version of the Genre Graph, created from actual mp3 tags
November 16 – Project Update
November 28 – Have a fully functioning Genre Graph, with force-directed layout, and Supergenres
December 3 – Have Artist View functioning properly and in sync with Genre Graph
December 7 – Be able to edit genre tags graphically using Genre Graph
December 10 – Have Playlist functioning properly
December 10-19 – Final testing and debugging
December 14 – Begin work on Report and Presentation
December 19 – Project Presentations
December 20 – Project Report Due
References
Auber, D., Chiricota, Y., Jourdan, F., Melancon, G. (2003). Multiscale Visualization of Small World Networks. Proc. InfoVis 2003.
Herman, I., Melancon, G., Marshall, M.S.. (2000). Graph Visualisation in Information Visualisation: a Survey. IEEE Transactions on Visualization and Computer Graphics, 6(1), pp. 24-44.