Interactive Visualization of Large Structured Development Environment
Department of Computer Science
University of British Columbia
2366 Main Mall
Vancouver, BC, V6T 1Z4, Canada
anirbans@cs.ubc.ca
Domain, Task and Dataset
Personal Expertise
Proposed Infovis Solution
Scenario of Use
Proposed Implementation Approach
Milestones
References
Domain, Task and Dataset
In large scale project development environment we see a large number of modules interacting with each other. It can get very complicated as the project becomes larger & larger. It can be useful to develop an interacting graphical tool that visually describes the various interactions & relationships of the procedures & the modules in the project giving the developers an interactive idea about the project modules & helping them to debug the software system if something goes wrong. As far as my knowledge in developmental environment system goes, such a graphical system does not come inbuilt with any project development suite. There has however been some work in the Software Visualization areas ([1], [3]) but the question of implementing an effective scalable static visualization tool remains open. If well designed, this tool can be really immensely helpful in large corporate houses involved in software consultancy & development. I propose to provide a solution in this area by my design of a graphical interactive model to describe the software system using dynamic interacting graphs.
Dataset: I intend to test this system with source code of a
rather complicated software project. In the beginning, I intend to use a
simple source code having several functional dependencies within a single module
& then extend it to a larger project in due course. I have several source codes
of my already developed projects in C++ which are rather large & test my
system on them. Initially some modifications might be necessary on these source
codes but later I intend to make the system generic & applicable to all input
C/C++ codes. One limitation though which I will try to address is that if
the project is divided into multiple file modules, all files can exist in
different directories. There has to be a way to indicate to this system so as to
incorporate source files from multiple directories. This, I thought can be done
by passing paths as command line parameters to the program or keeping a separate
settings file which indicates all source code directories.
Personal Expertise
I have been involved with C, C++, Java programming for several years &
also developed some rather large software projects in C++, C & Java.
I found the need to have such a graphical system which can give me at a
glance the interrelationships between the modules & within the
modules, the various methods. But among all the tools that I have
used thus far, I found none. I have never taken an InfoVis course before or any
other graphics course for that matter. During my InfoVis course work, it occurred
to me to design such a system that will be helpful in future for me as
well as for all other developers. I was looking for some useful tool to develop
this utility when I came across Prefuse & I thought this tool can be of good
help for this project.
Proposed Infovis Solution
The task of visualizing a structured system involves identifying the elements (smallest elements being the methods & functions) & modules of the system & then linking them with each other. I intend to use Prefuse Java graphical toolkit to develop an interactive graphical model where each node represents a method in a module. If I find prefuse difficult for my objective, I might at a later stage consider using some other toolkit available. All methods (nodes in this case) of a single module can be given the same color to identify methods belonging to the same module. On clicking on the node, the graph rotates to move the node at the central focus position & the system should be able to show the name of the method & the module it belongs to along with some other information (I have not thought a great deal about it though) like size, local data items may be. If the project is large, it will have a large number of nodes & graph may not be contained within the screen space. In this case, its a problem of scalability of this utility. In this case, some zooming & panning feature must be built into the system so that users do not loose context. Users should be able to drag the graph (pan it) to bring the node of interest into focus. I will also try to make the system zoom in & zoom out so that the users can have an idea of the entire structure (context) when the graph does not fit in the space. Some other interesting features can also be added at a later stage like clicking on a node opens the corresponding location in the file where the method has been written so that it can be easily debugged. Such a possible functionality has been shown in figure 1.
Scenario of Use
The software can be of immense utility with the large scale software consultancy firms. Though most of them use their professional developmental & debugging utilities, this tool might prove to a simpler one for use ( & cheap!). This tool can also be used by armature program developers like me who would like to use this simple free tool instead of much costlier professional software packages. When a programmer loads up the start file (containing the root of the execution tree), (in C/C++, the file containing the main() method), the system looks for all the different function call within the program & populates the graph. When complete the graph shows all the methods along with the module they belong to (with different colors) & the relations among them. Recursive calls are shown by edges that has the same origin & termination nodes. The user can click on any one node to view the description of the corresponding method as is described above.
A sample figure is shown below (hand drawn):-
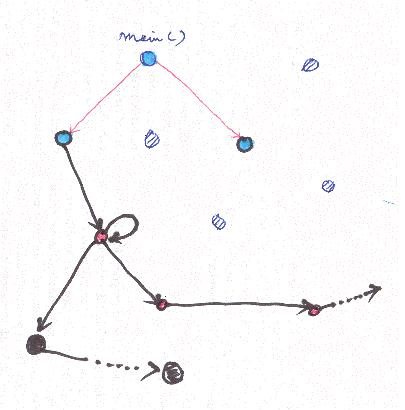
Fig 1:
A possible output from the design
|
Fig 2: A demo of Prefuse that shows the possible use of it in this project can be seen here.
Proposed Implementation Approach
The implementation will consist of first traversing the start file (I will either use my own static analyzer that I worked on a few years back, or if I find it buggy & unable to fix it, I will then use a third party analyzer in the worst case), populating an adjacency matrix type data structure (but this may be a single three dimensional or one one-dimensional & one two-dimensional matrix) to store the attributes of the relationships between the methods). Then the actual drawing will start, each node representing one method in the graph. If the project contains multiple files, each file will be loaded & perused for interconnecting relationships. We will use the appropriate methods within the toolkit to animate the graph & make it interactive.
Milestones
|
|
Establish familiarity with the Prefuse Toolkit. |
|
|
Try out the animated graph with a dummy adjacency matrix |
|
|
(a) Code for perusal of C/C++ source codes &
scan for methods.
(b) Load & populate adj. matrix. (c) Allow user interaction with display of detail info in node click. (d) Add zooming, panning etc. |
|
|
Extend it to incorporate larger multifile programs, cluster nodes as per the modules. |
|
|
Prepare final presentations & project reports. |
References:
1. Prawn: An Interactive Tool for Software Visualization, Andrew Chan, Reid Holmes
2. Pathfinder: exposing the mental map of program navigation , Mik Kersten (beatmik-at-acm.org), CS 533C Visualization Project, March 1 2004.
3. J. Wu and M.-A.D. Storey. A multi-perspective software visualization environment. In Proc.of CASCON'2000, pages 41-50, 2000.
4. S. Tilley H. Mueller, M. Orgun and J. Uhl. A reverse engineering approach to subsystem structure identification. Journal of Software Maintenance: Research and Practice, 5(4):181{204, 1993.
5. I also would like to talk to Prof. Kris De Volder of our department regarding this idea.