1. Project Authors:
| Author Name: |
Email: |
| 1. Alam, Mohamed |
malam@cs.ubc.ca |
| 2. Chita, Christian |
cchita@cs.ubc.ca |
2. Description of problem, task, dataset:
- Problem Description:
Over the last decade, the computing experience has changed for both business and private users, mainly due to the advent of powerful, yet affordable machines. In addition, a significant amount of data has migrated from shelved hard copies to the World Wide Web, sparkling a frenzy of Internet activity all over the world. Moreover, interpersonal communication equally migrated in a significant proportion over the web. As a consequence, always on, high speed internet connections have become common in the western world households, and a pletora of service providers has flourished to answers the new, Internet-related needs of the population.
One such need is Internet Telephony. Unfortunately, it is an emerging technology and has a number of technological and evolutionary issues. The technological issues are mainly because the Internet was not designed for real time traffic such as voice and video. However, the benefits of using IP as a generic platform for both data and real time applications are compelling enough to encourage resolution of these issues [1].
One of the main reasons behind the security problems affecting today's online services resides in the fact that interdomain routing protocol BGP was designed at a time when the Internet was nowhere near its present complexity. In addition, since BGP is a TCP/IP protocol, it is subject to all vulnerabilities characteristic to TCP/IP [2]. Testing for the various vulnerabilities affecting a given networking protocol has gained thus outmost importance in recent days, and given the complexity of today's systems, the number of test cases to be run by any given test suite easily reaches an 10^3 order of magnitude.
- Task Description:
Professionals working in the computer networks field need to test the various protocols for both conformance (to accepted industry standards) and vulnerability (to the most common/obvious threats, and beyond). Using an automated tool, the developer will submit a given networking protocol to a series of test operations, and observe the outcome. For those cases where one or more test cases fail, the developer needs to be able to extract conclusions of the following nature:
- are all, or a majority of the failed test cases concentrated in one particular phase of the protocol?
- are all, or a majority of the failed test cases trivial, or do they belong to a high priority equivalence class?
- are all, or a majority of the failed test cases in one branch of the testing tree in any way related to those in some other branch of the tree?
- how far along each branch was the test suite allowed to
progress, before the occurrence of the first major failed case?
- the usual how-many-of-each stats
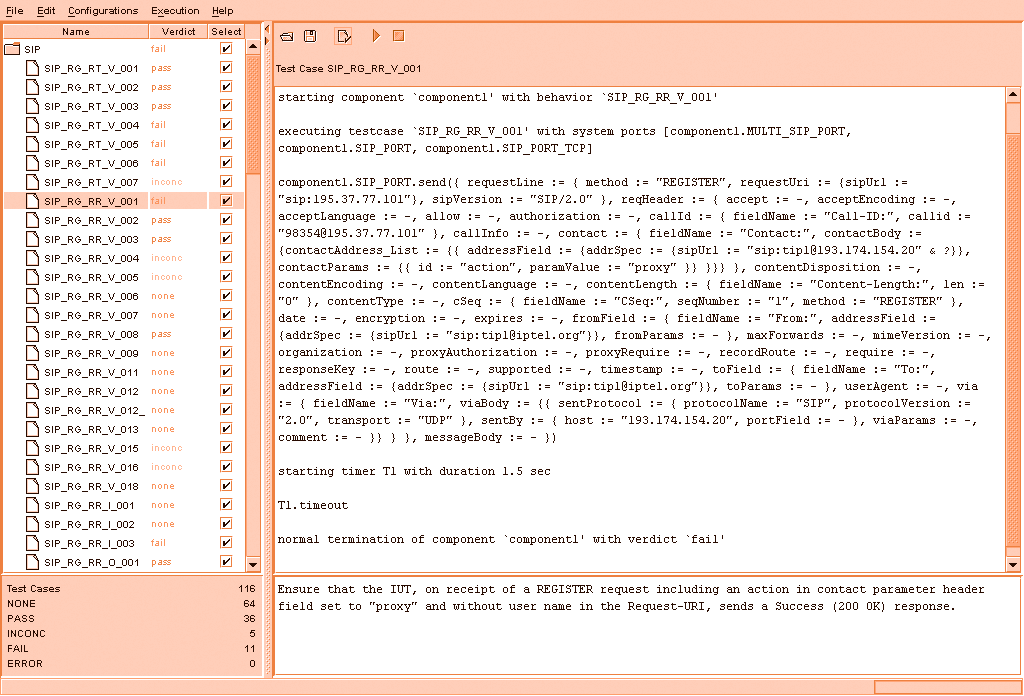
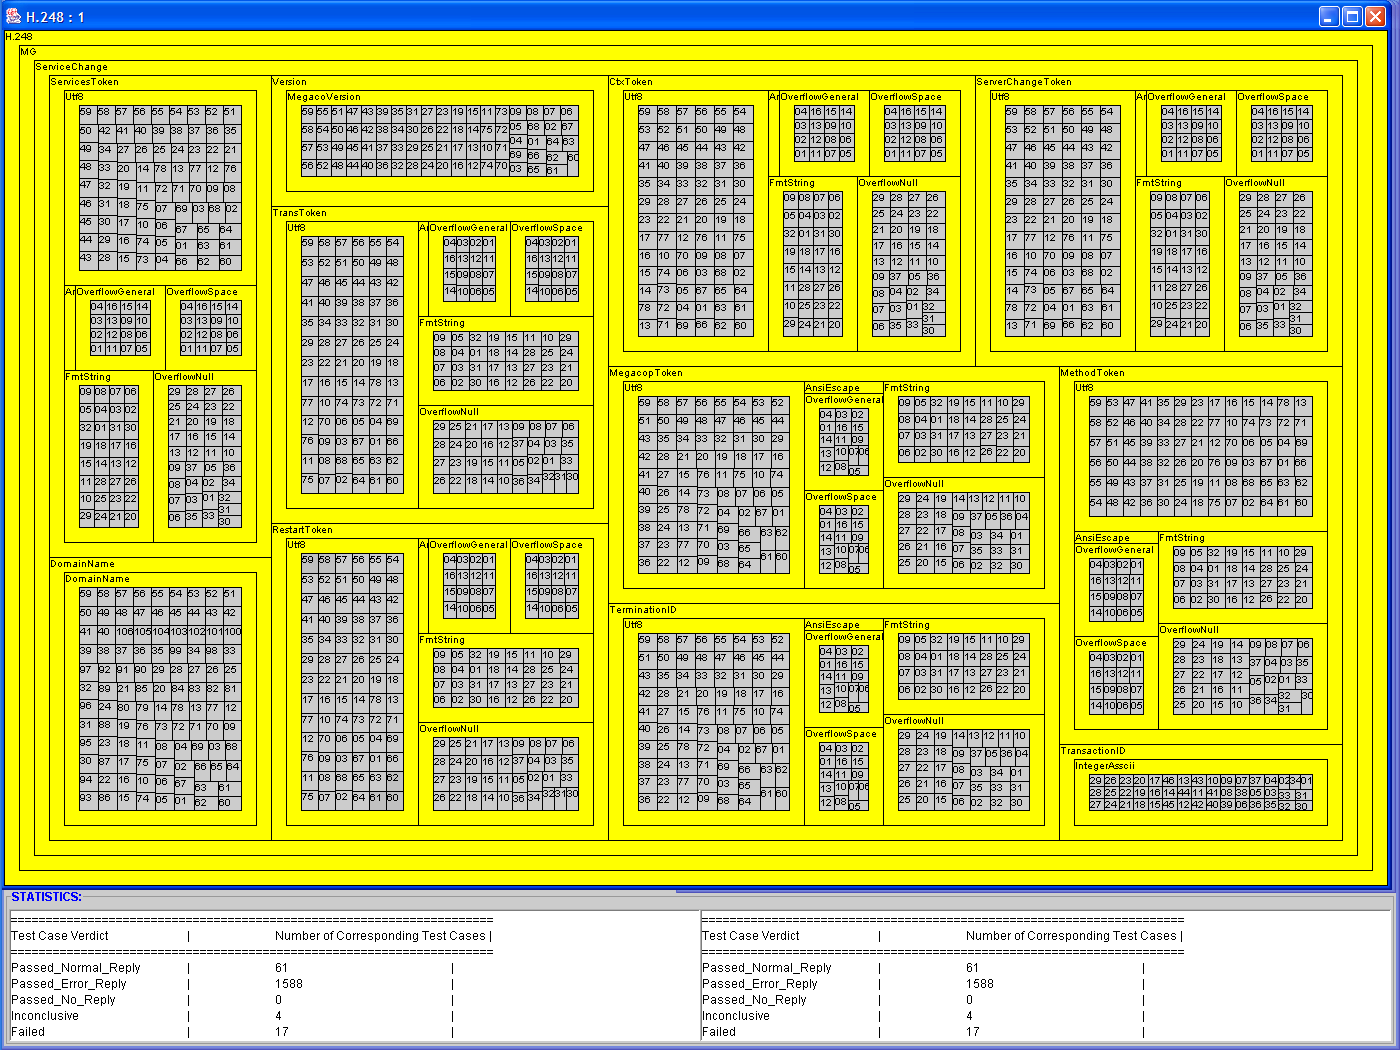
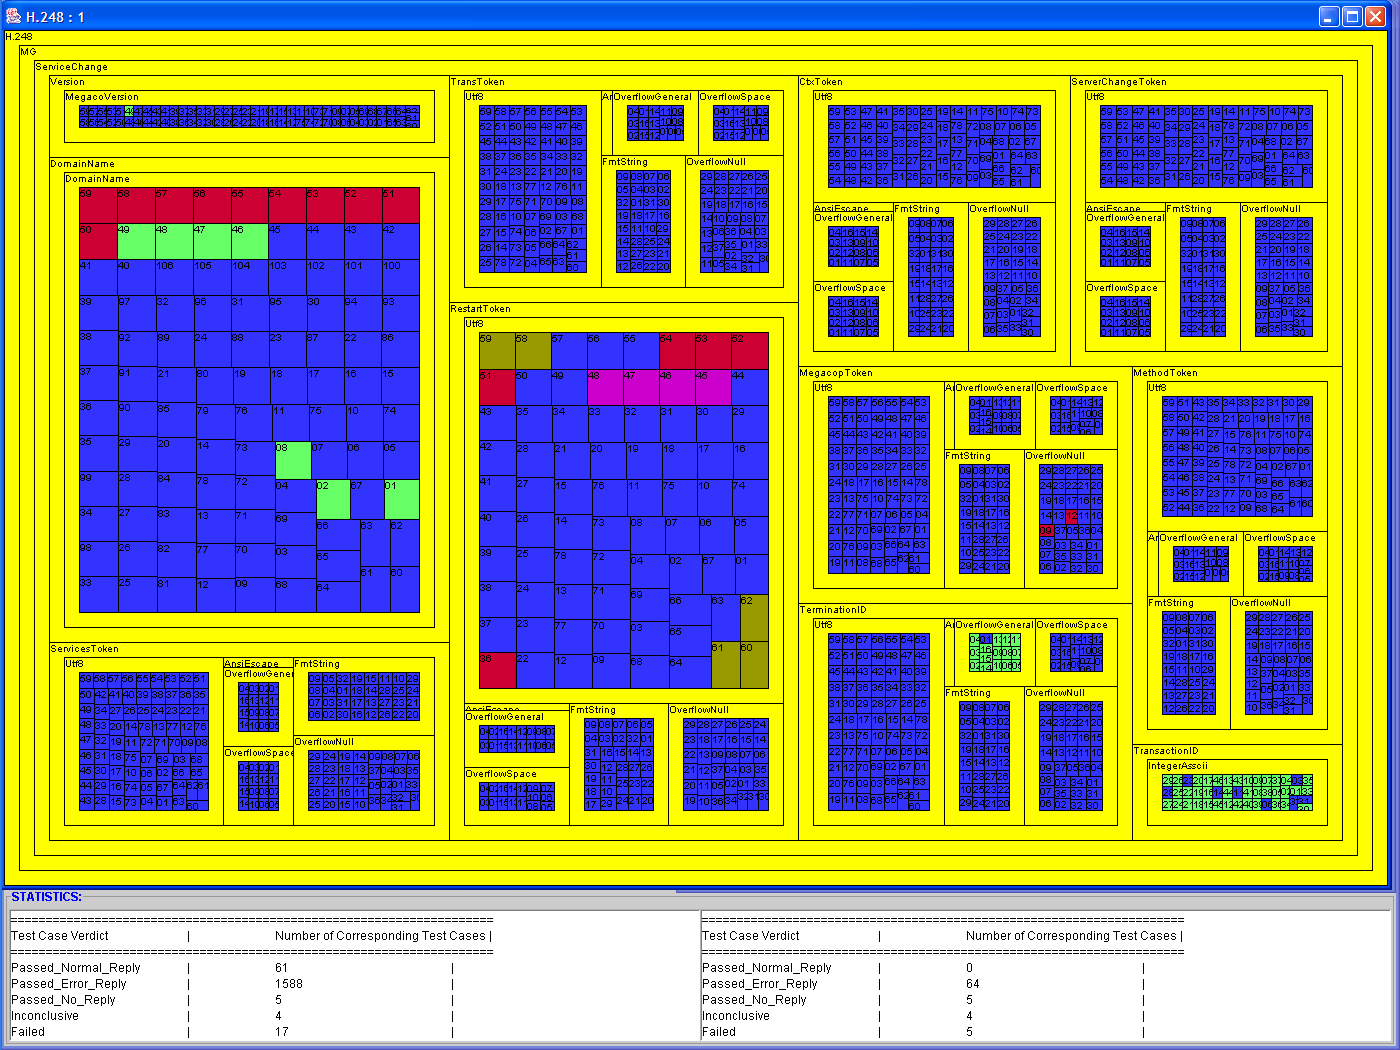
The problem with the current human interface of the available test suites is that they easily afford only the latter type of inference, as the screen shot below shows. The tester needs to perform significant additional steps to answer (i)-(iv) type questions.
- Dataset Description:
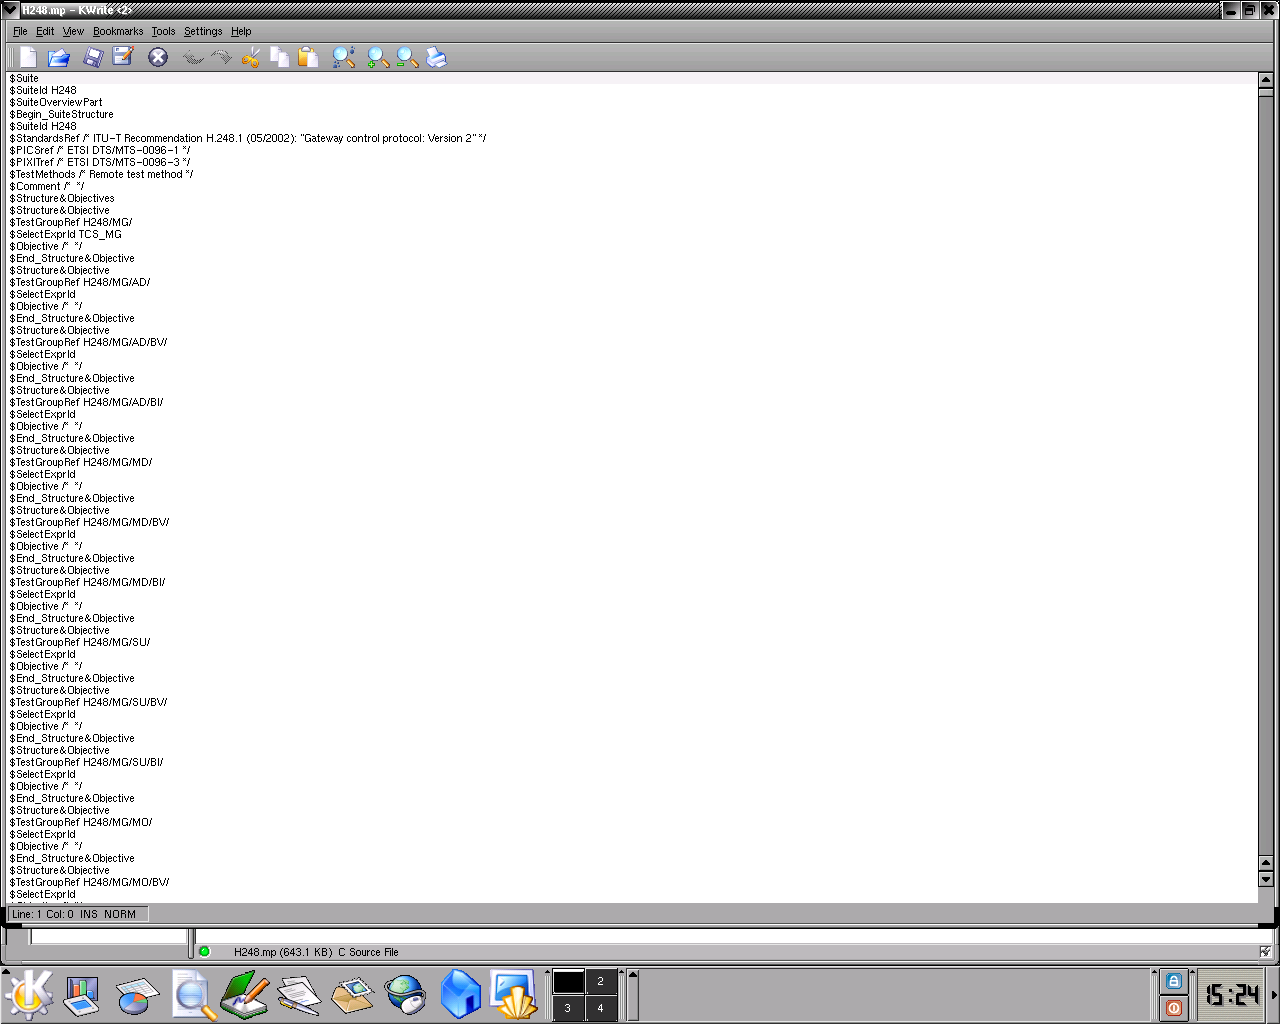
Significant inroads have been made in automating the networking protocols' testing task, and the H.248 [3] test suite is an industry wide accepted tool. It is based on the Tree and Tabular Combined Notation (TTCN), defined by the International Standard Organization and International Electrotechnical Commission, and it is composed of a collection of various test cases together with the declarations and components it needs. The main component of the test file can be examined here, or glimpsed at by clicking on the thumbnail below. In addition, for a human readable version of the file, please follow this link.
In the initial phase of our project, the Conformance test suite of the H.248 protocol was the only available data. In the later phase however, a Vulnerability version was made available to us. We will highlight briefly the major differences between the two datasets:
- format and language: the Conformance
version is written in TTCN2,
whereas the Vulnerability
contra part is written in TTCN3.
This distinction becomes a factor given that the ttcn2 file included
both the structure and the test events of each case of the test suite,
whereas the ttcn3
file only includes the structure -- to a certain degree only. This is
mainly due to the fact that
the ttcn3 format does not build upon the previous xml-like format of
the ttcn2 format. On the contrary, its format is the one of a
programing language, featuring function calls and flow-control
mechanisms. This provides the operator with the flexibility of choosing
which test cases are to be ran, but segregates the test-suite's
structure from its results and from the test-cases' description.
- number of test cases: the Conformance
version has the order of 300 - 400 test cases, whereas the
Vulnerability contrapart
has 1,771 test cases.
- verdict types: for the Conformance
version , a given test case can have only (one of) three
possible results: passed, failed,
incomplete. In the Vulnerability
version however, the passed
verdict can be any of:
- passed with normal/expected reply
- passed with error reply
- passed with no reply
Our
solution was to format the Vulnerability
test suite results in a manner similar to the ttcn2 format. This
will ensure that our program will accept future ttcn2-formatted data.
The formatted file containing the dataset used for the final phase of
our project can be examined by following this link.
3. Related Work:
- Industry:
As mentioned in Section 2, the field of network-testing has gained significant momentum in recent years, and several companies are strongly anchored in this area (for a complete listing, please follow [4]). We would like to highlight only a few of them here; namely, a few of the VoIP dedicated companies.
- Brix Networks:
Brix's approach focuses more on the nodes visualization. That is, the traffic from one communication node to another is the target of the visualization tool. This provides a higher level of aggregation, and actually an entirely different goal than the one we are aiming for our approach (Figure 3.A.1).
- Empirix:
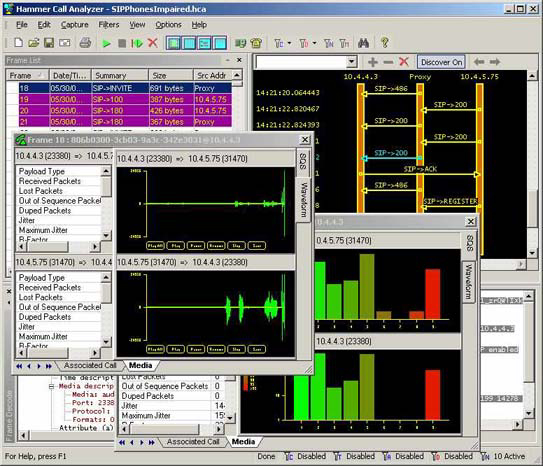
Empirix's approach focuses on low level examination of the packets (Figure 3.A.2). This is a highly valuable tool, but it provides too much detail if all what one would like to explore is a range of aggregate queries of the genre "how many cases of x kind are there, and where are they located".
- Testing Technologies
Testing Technologies' approach is the one that most closely resembles the one we target for our project. In fact, the tool presented in Figure A.3 is used to produce test runs that generate the input for our tool. Our observation is that even though the tool presented in Figure 3.A.3 is excellent for test suite activation and results generation, it falls short in providing accurate test-results exploring techniques (Section 2 b documents the kind of queries hard and cumbersome to answer with Testing Technologies' tool).
Figure 3.A.1: Brix Networks
Figure 3.A.2: Empirix
Figure 3.A.3: Testing Technologies

http://www.brixnet.com/products/voip_testsuite.html http://www.empirix.com/Empirix/Network+IP+Storage+
Test/hammer+call+analyzer.htmlhttp://www.testingtech.de/products/TTsuite-SIP/
index.html
- Academia:
Visualizing hierarchies constitutes one of the important topics targeted by the academia. Several notable inroads have been made, each mapping to a different approach attempting to solve the hierarchy visualization problem.
- Multitrees:
One such approach is known as Multitrees, by Furnas et al. [5]. The paper tackles the problems associated with the shortcomings regular trees and DAG's (Direct Acyclic Graphs) have when representing complex data.
- regular trees:
- Only one way to go from node_A to node_B
- No multiple organizing contexts
- DAG's:
- Edge crossing even for small neighborhoods
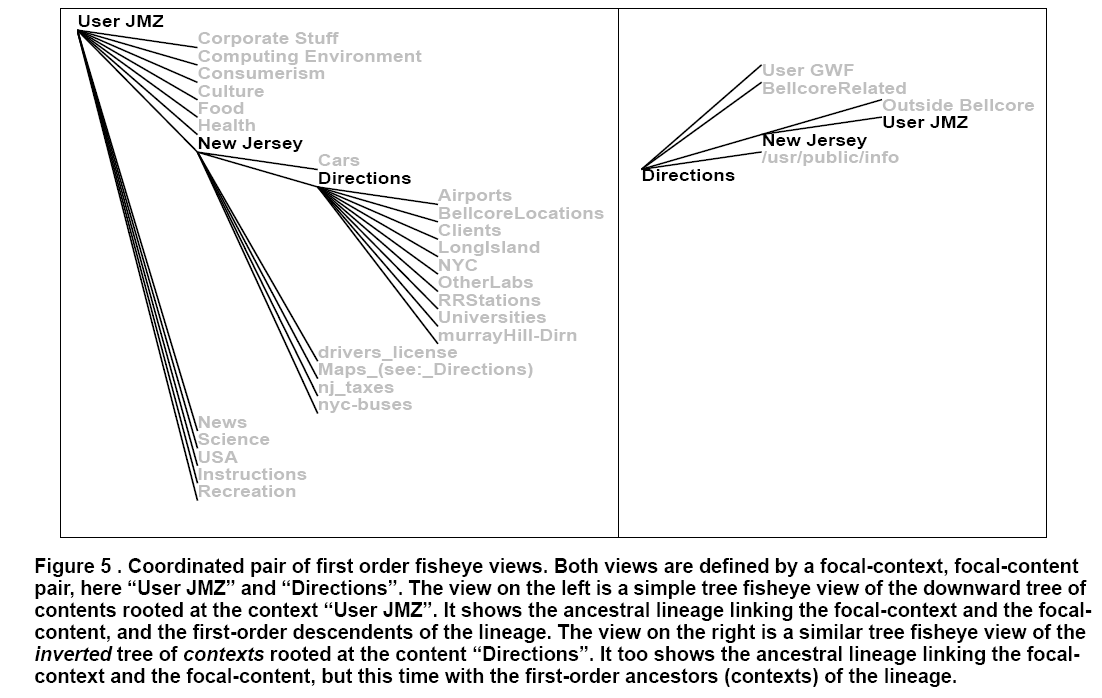
An interface build using the Multitrees approach is shown in Figure 3.B.1.
- Conetrees:
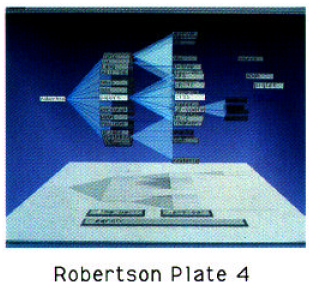
The Conetrees approach (Robertson et al. [6]) addresses the problem of aspect ratio that is characteristic to file-browser interfaces. Namely, a 2D layout will not fit onto the screen, and will invariably lead to excessive scrolling and panning once the width of the ratio of the tree's base and the number of levels in the tree reaches a critical threshold.
The paper suggests using a 3D approach, and an implementation of this approach is shown in Figure 3.B.2, and Figure 3.B.3.
| Figure
3.B.1: Multitrees |
Figure
3.B.2: Conetrees |
Figure 3.B.3: Conetrees |
 |
 |
 |
| Multitrees: Enriching and reusing hierarchical structures | Cone Trees: Animated 3D Visualizations of Hierarchical Information | Cone Trees: Animated 3D Visualizations of Hierarchical Information |
4. Description of solution: InfoViz technique:
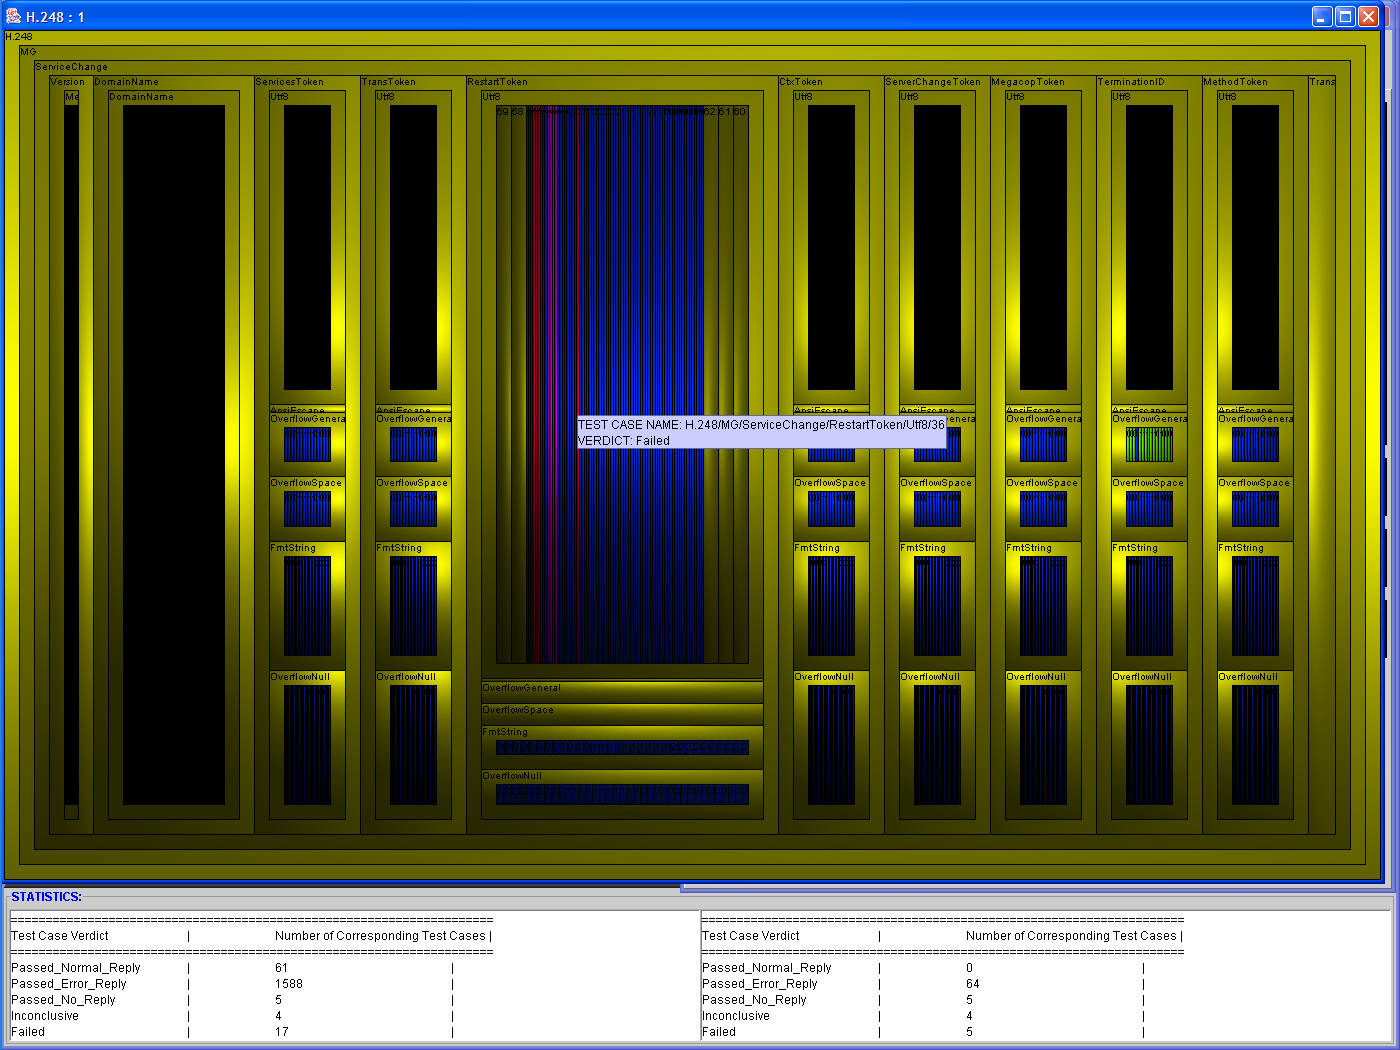
Our suggested visualization of the test suite's structure and results is based on the Matryoshka dolls principle (more about the dolls here). In particular, we propose using a series of recursively defined virtual shoe boxes, each holding one level of depth in the test suite. The boxes will have their cover removed, thus exposing their contents to the user. Furthermore, the boxes will see their physical size change, according to the following schema:
- before the test suite is ran, the tool will only show the suite's
structure, and as such, all groups and test cases are equal citizens,
and will benefit from the same amount of screen space.
- once the test suite has finished running, the results will
determine the
size of each container box. For example, a group with numerous failed
test cases will be drawn significantly larger than a group with only a
couple of failed test cases, even if both groups are otherwise located
at the same depth in the test suite's inner structure. Furthermore,
this increase in size will be percolated through the groups' hierarchy
until the highest level is reached.
- the extra pixels required for this magnified representation will be substracted from the ones dedicated to other groups with few and/or unimportant failed cases -- which will consequently be drawn smaller than in the a priori view.
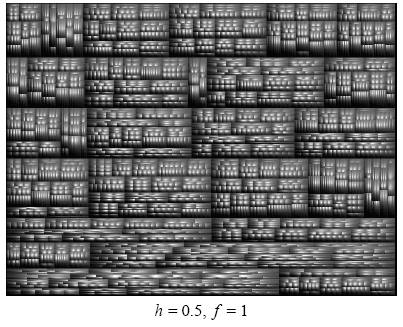
Since this initial development, several enhancements have been added to the Treemaps technique. Among them, we would outline:
- the addition of borders around the levels, so as to make more readable the nested structure of the tree
- the possibility to zoom, so as to afford in-depth exploration of a given sub-level
- use of colors and hue/saturation controls
- squarified layout, to improve the aspect ratio
- cushions, which we infer as been the most graphically intensive, and also as perhaps the most revealing improvement.
| Figure
4.1: Cushion Treemaps |
Figure 4.2: Cushion Treemaps | Figure 4.3: Cushion Treemaps |
 |
 |
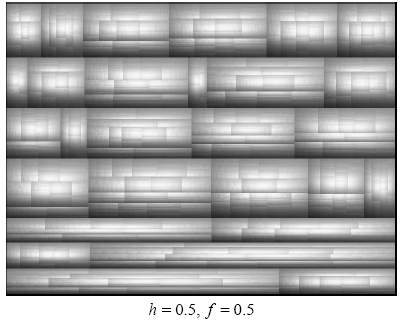 |
| Cushion Treemaps | Cushion Treemaps | Cushion Treemaps |
5. Scenario of Use:
Bob is a new UBC graduate just hired by the prestigious CRESCO Networks & Co networking equipment company. The company is heavily involved in producing the hardware required by the various North-American high-speed networks, and also produces the software required to run the resulting systems. Furthermore, the company is currently heavily involved in developing a new protocol for the next big thing in American digital communication: Voice over IP (VoIP).
In his entry level job, Bob is required to test prototype network-segments implementing the new VoIP protocol for the various vulnerabilities inferred by the senior (vulnerability testing) developing team. In particular, while the senior team is busy developing a novel, all encompassing VoIP vulnerability Test Suite, Bob must run an existing test suite (H.248), so that the team developing the actual networking protocol can progress as well.
In particular, today, Bob's manager (Martin, a guy known to be stiff on deadlines) asked Bob to test the latest VoIP protocol version (with the H.248 Test Suite) and to produce the following results by 4:00 PM:
- What is the group with the larger, and what is the group with the smaller number of test cases.
- What is the group with the larger, and what is the group with the smaller number of:
- failed
- inconclusive
- passed test cases.
- Given that the H.248 Vulnerability
Test Suite has several H.248_*_*_*_Utf8 groups, how
balanced is the resulting tree? (i.e. in percentage points, what is the
ratio of the failed/passed test
cases for all Utf8 groups?).
- For all inconclusive test
cases in the MG group, find out the
ratio of Failed VS
Passed test events (a test
event is the atomic component of a test
case; several test events compose a test case. A test case is
inconclusive when some test events pass, and some fail).
- What is the trouble area of the H.248 protocol, if any? (i.e. is
there
a specific concentration of failed cases in some specific group, or
adjacent groups of a branch?)
| Martin's
Question |
Explanation |
GUI
in |
Use |
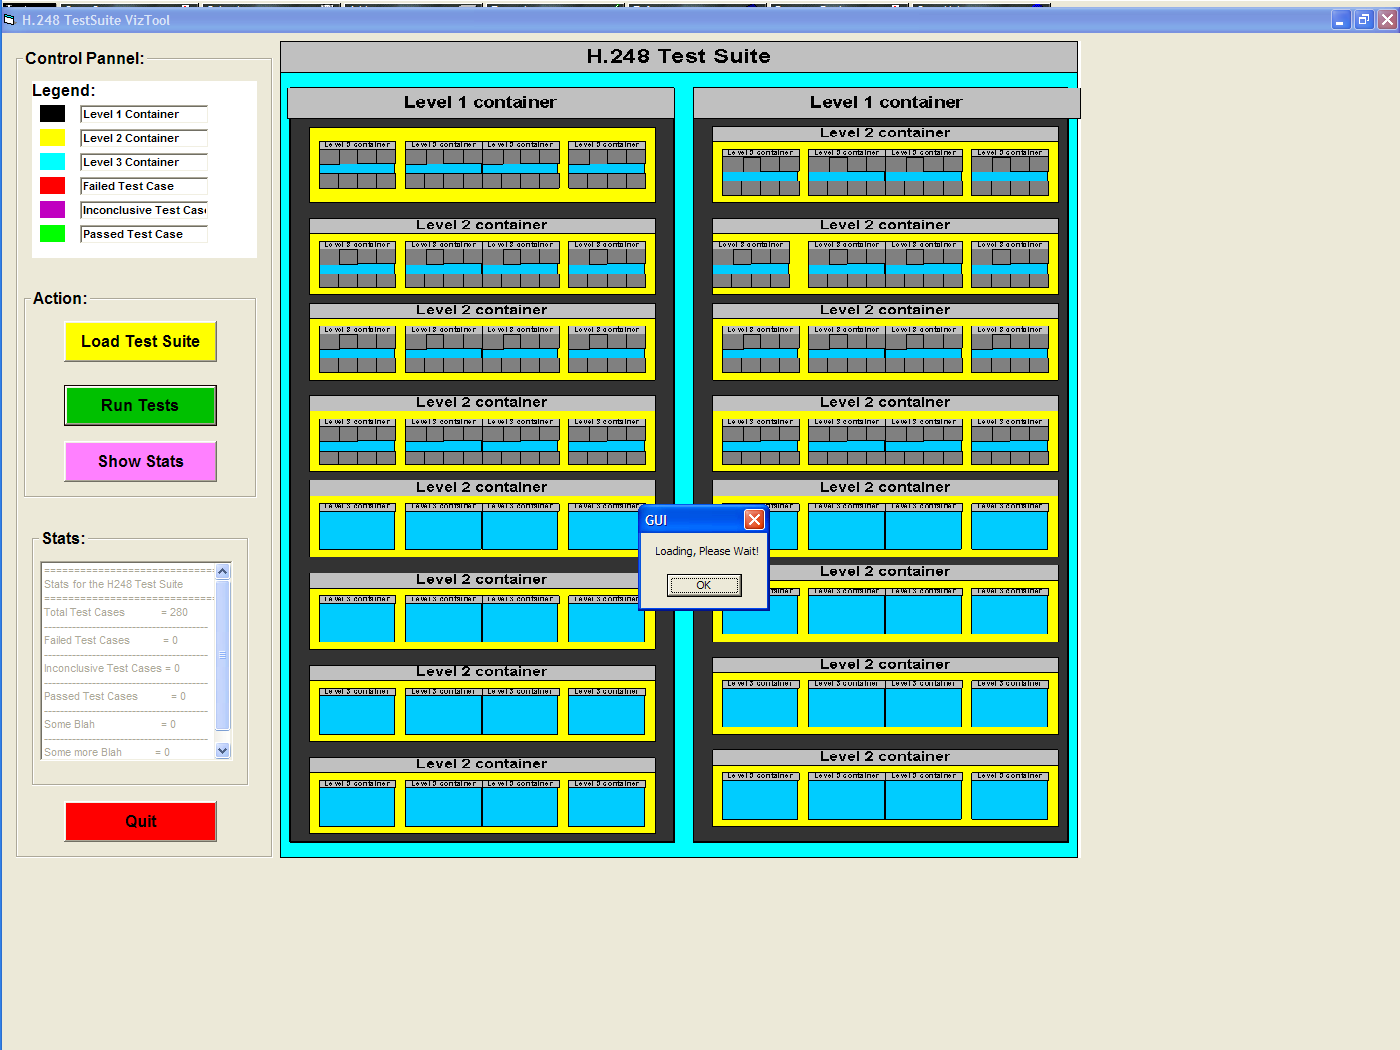
i |
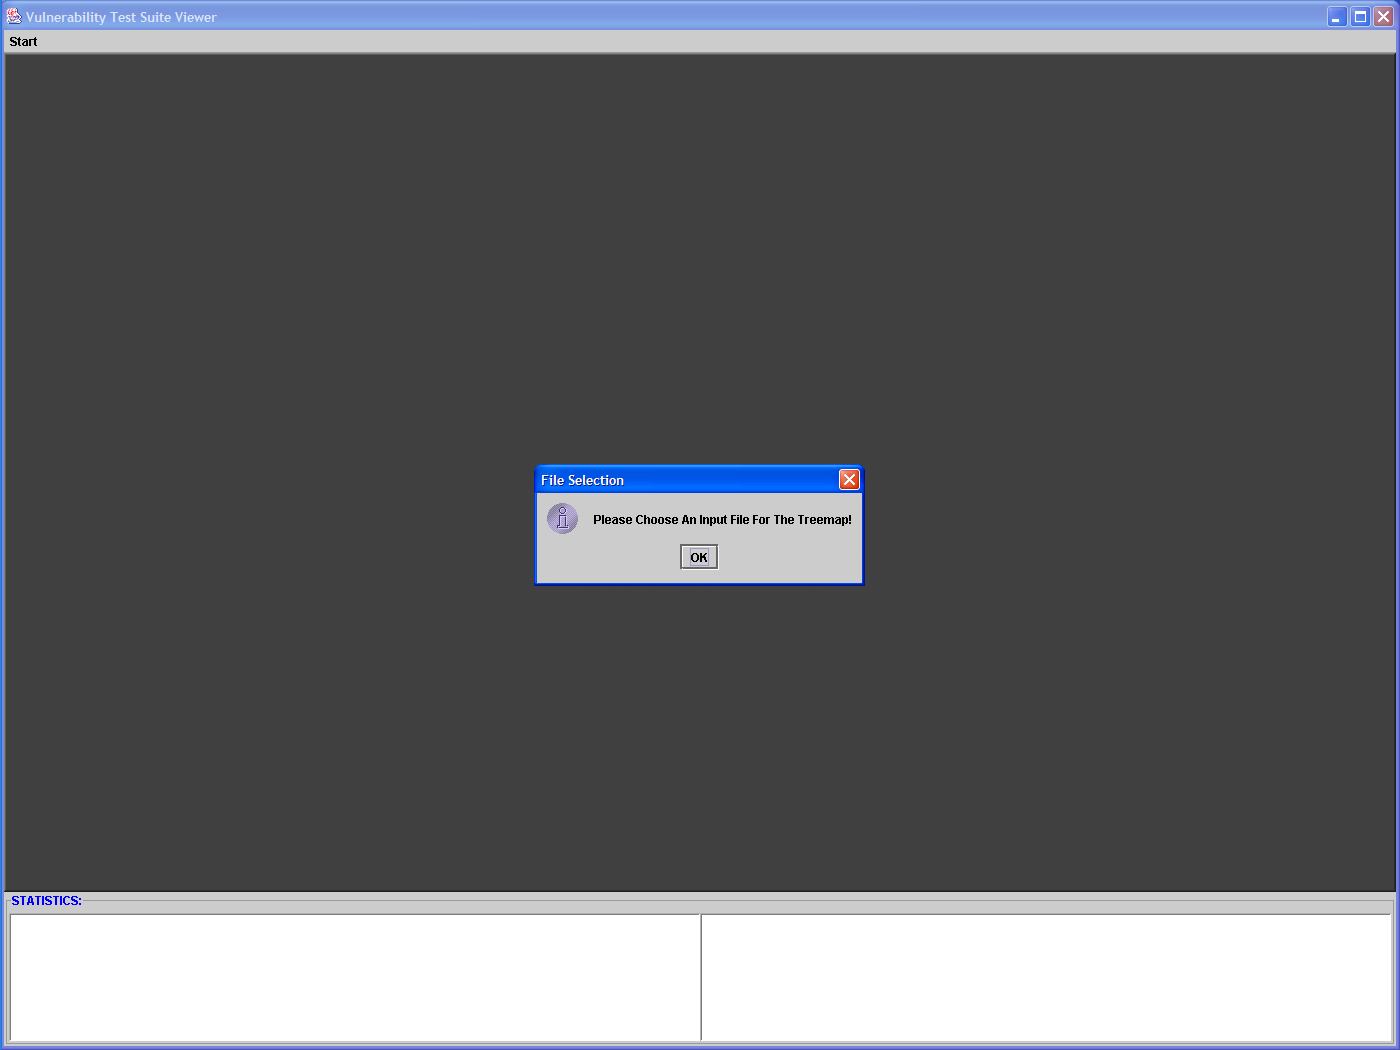
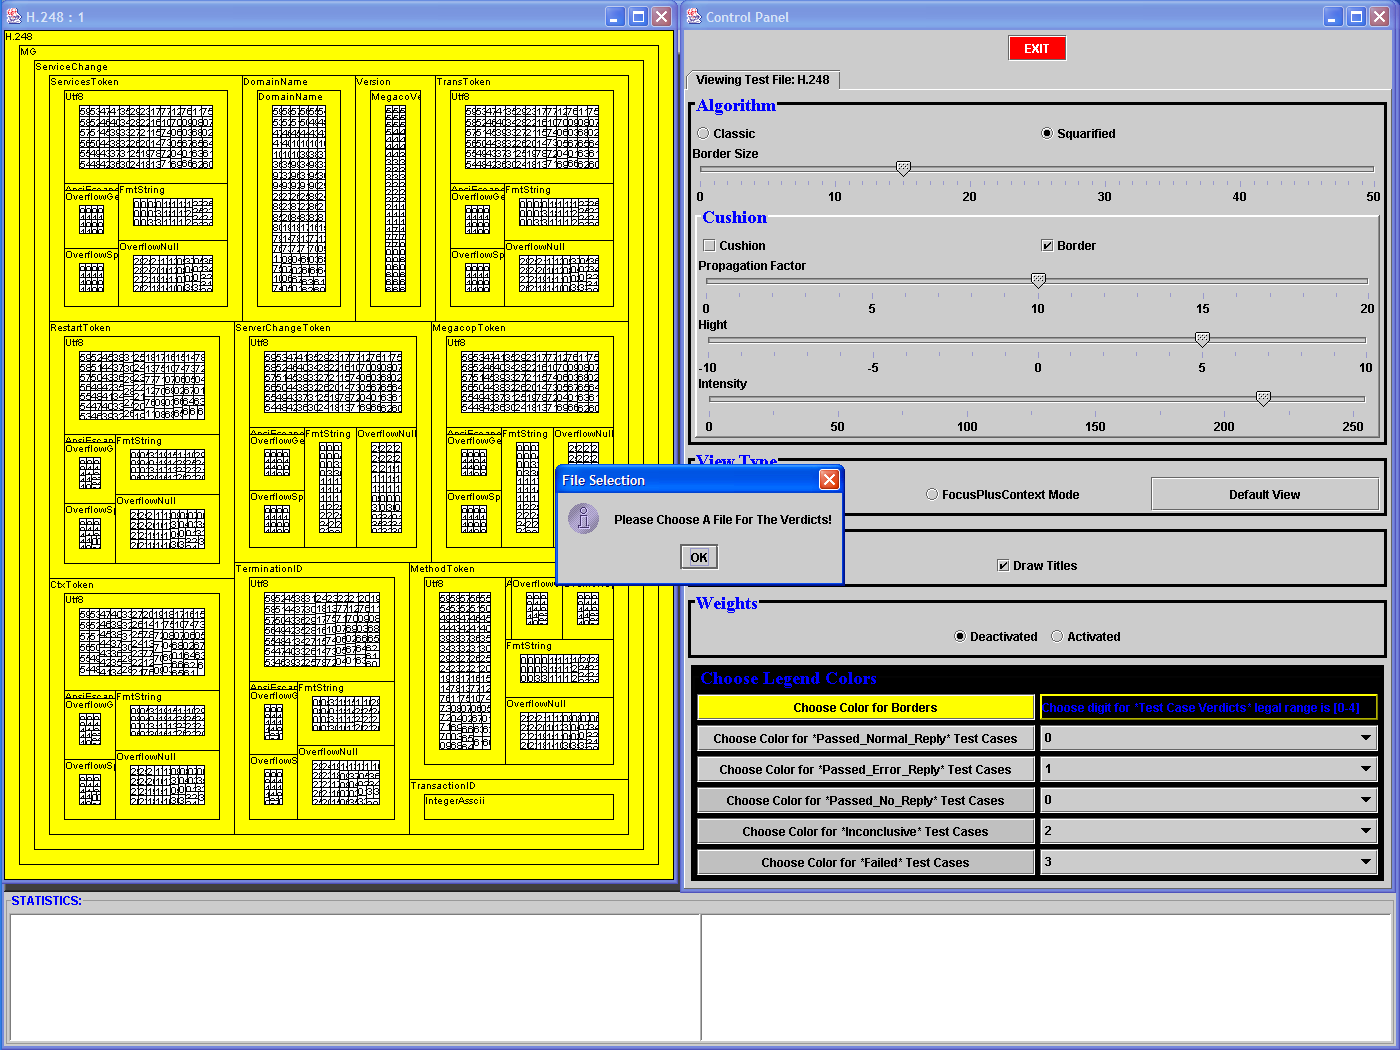
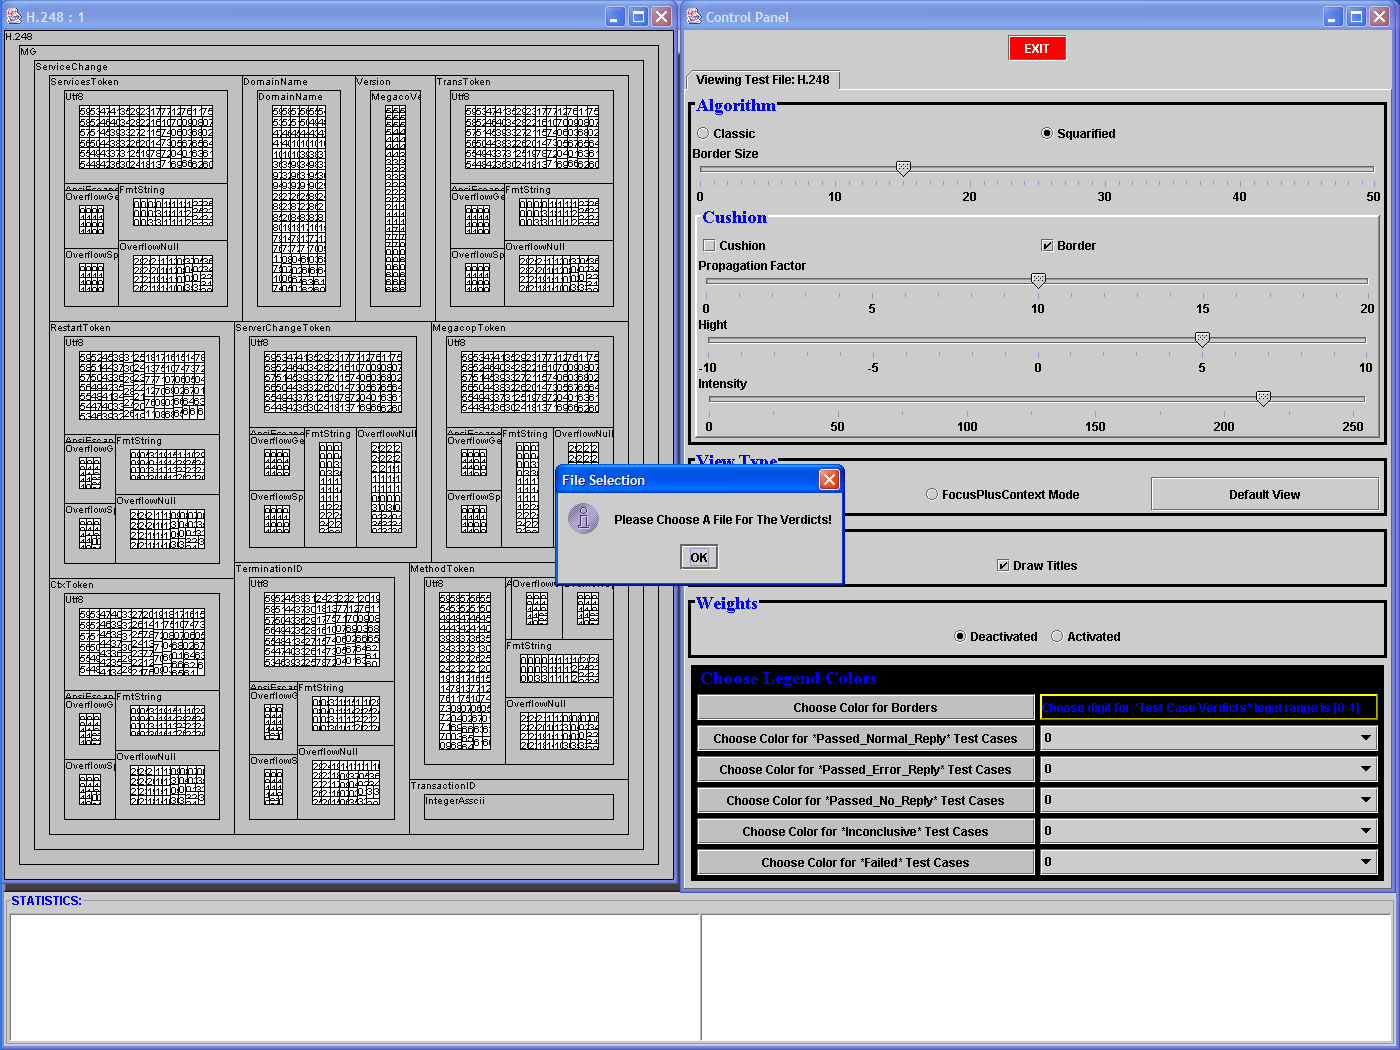
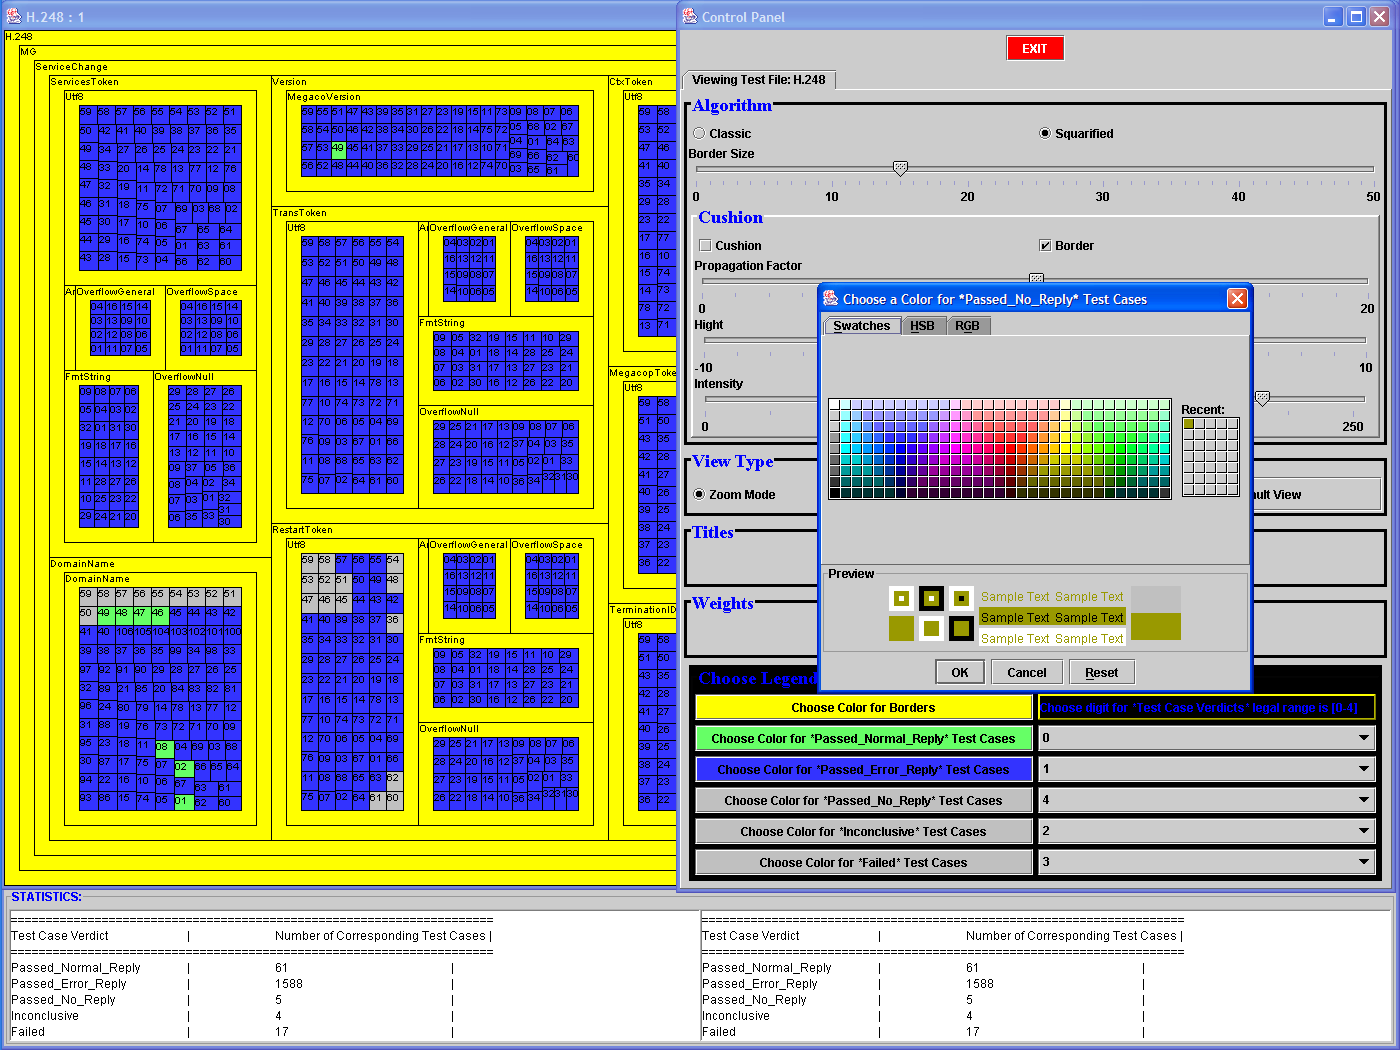
To answer
question (i), Bob needs to upload the test suite by clicking
on the "OK" button when prompted (LHS figure), and visually
inspect the
various groups shown in the resulting view (RHS figure), while using
the
Stats window to solve any ambiguities (the Stats window updates itself
with the stats of whatever container happens to be in full view. The
color for the borders is entirely at the discretion of the user.
Zooming is
explained further in the next row. We remind the user that all the screenshots use the results of the Vulnerability H.248 test suite developed at UBC within the CPSC 527 course boundaries, unless otherwise noted. |
 |
 |
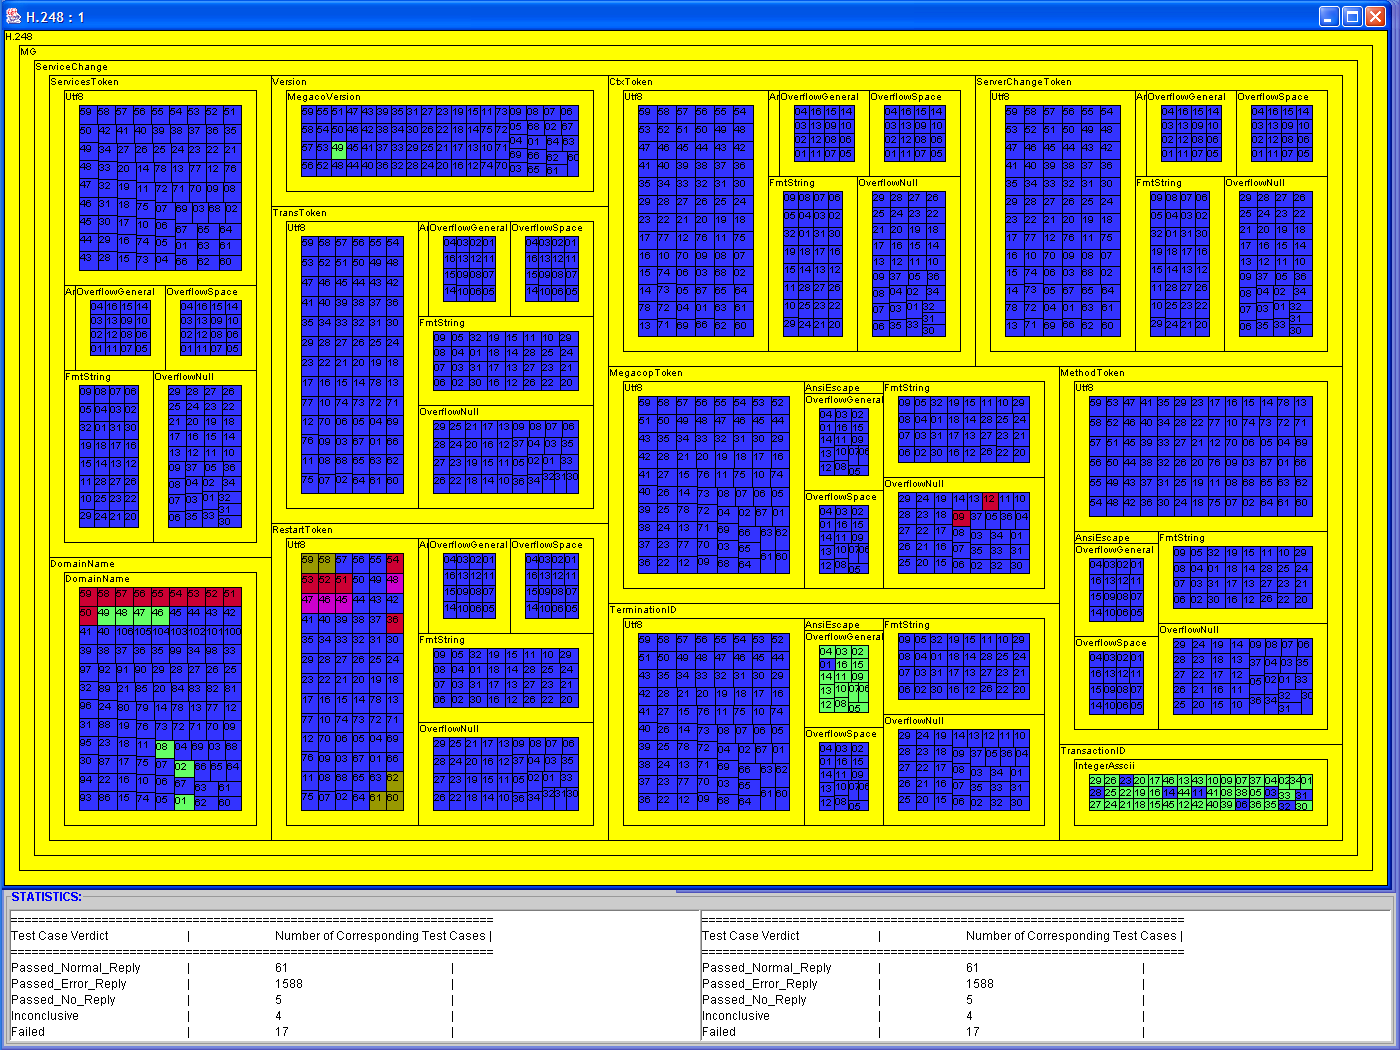
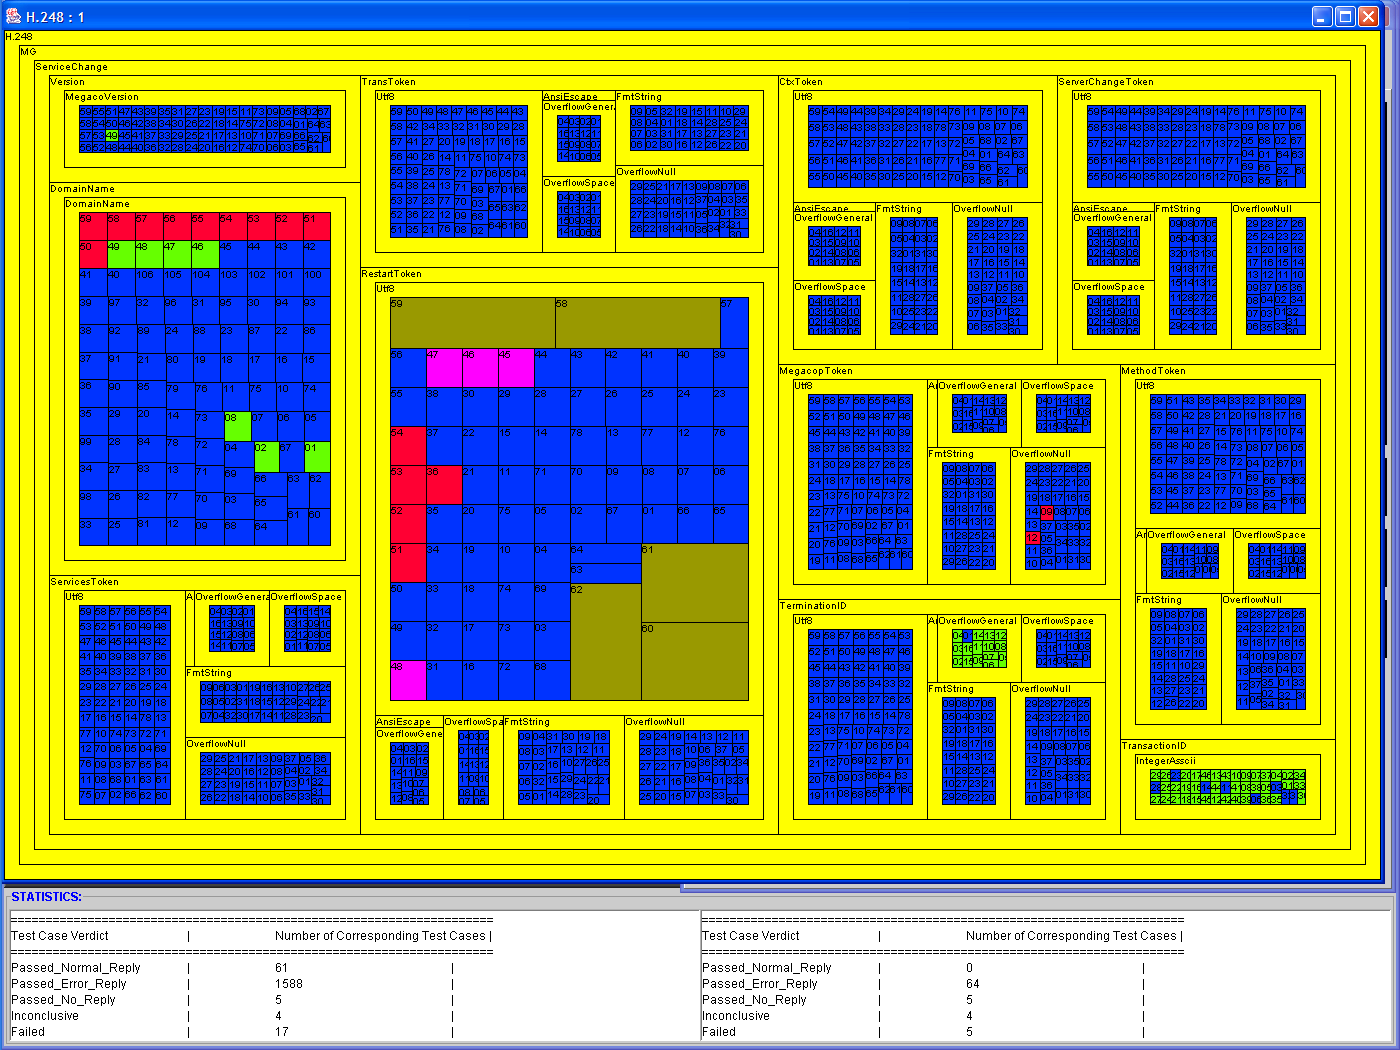
ii, v |
To answer
question (ii), Bob needs to load the specific (i.e. H.248) verdicts
file by
clicking on the "OK" button when prompted to do so (LHS figure), and
observe the
graphical output of the test (RHS figure). Bob will easily solve any ambiguities, by zooming, in turn, on the k groups best candidates to hold the greater/smaller number of failed test cases (zooming is shown in the row below). The Partial Stats window will provide the exact numbers. For example, let us suppose that there are two groups (in the RHS Figure) that appear to hold the greater/smaller number of failed test cases. Bob will click on their borders (or anywhere within that group), thus zooming in and bringing each one in full view, and will examine the rows of interest in the Partial Stats window (Zooming is shown in the screen shot next row, and can be performed at any level). Question (v) can be answered by visual inspection of the RHS Figure only, and perhaps a few Focus+Context actions (shown below, RHS); something not possible with the current tools. |
 |
 |
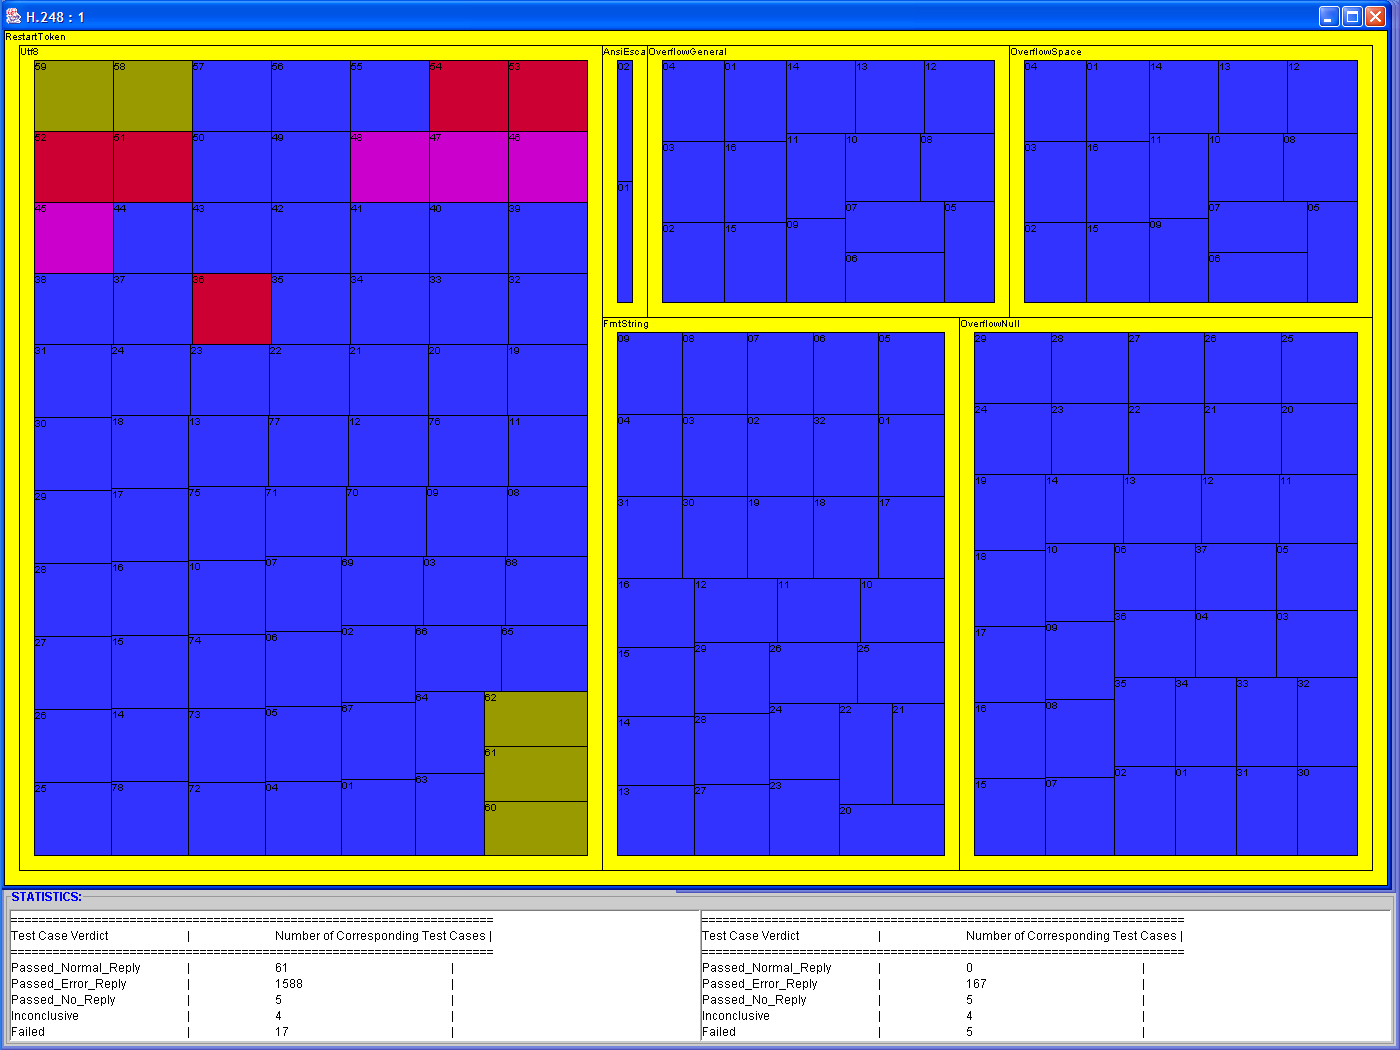
| iii | Question
(iii) can be answered with several zooming and/or focus+context
operations (shown in row above). The names of the various groups can be
observed from the borders of each group (the option of drawing the
titles is turned on by default, but can be turned off). Similarly, any
other color can be changed to any of the colors provided by the
standard Java color-chooser. Regardless of the zooming or focus+context choice, the Partial Stats window will provided the sought after partial result. Bob will only have to compute the ratio. |
 |
 |
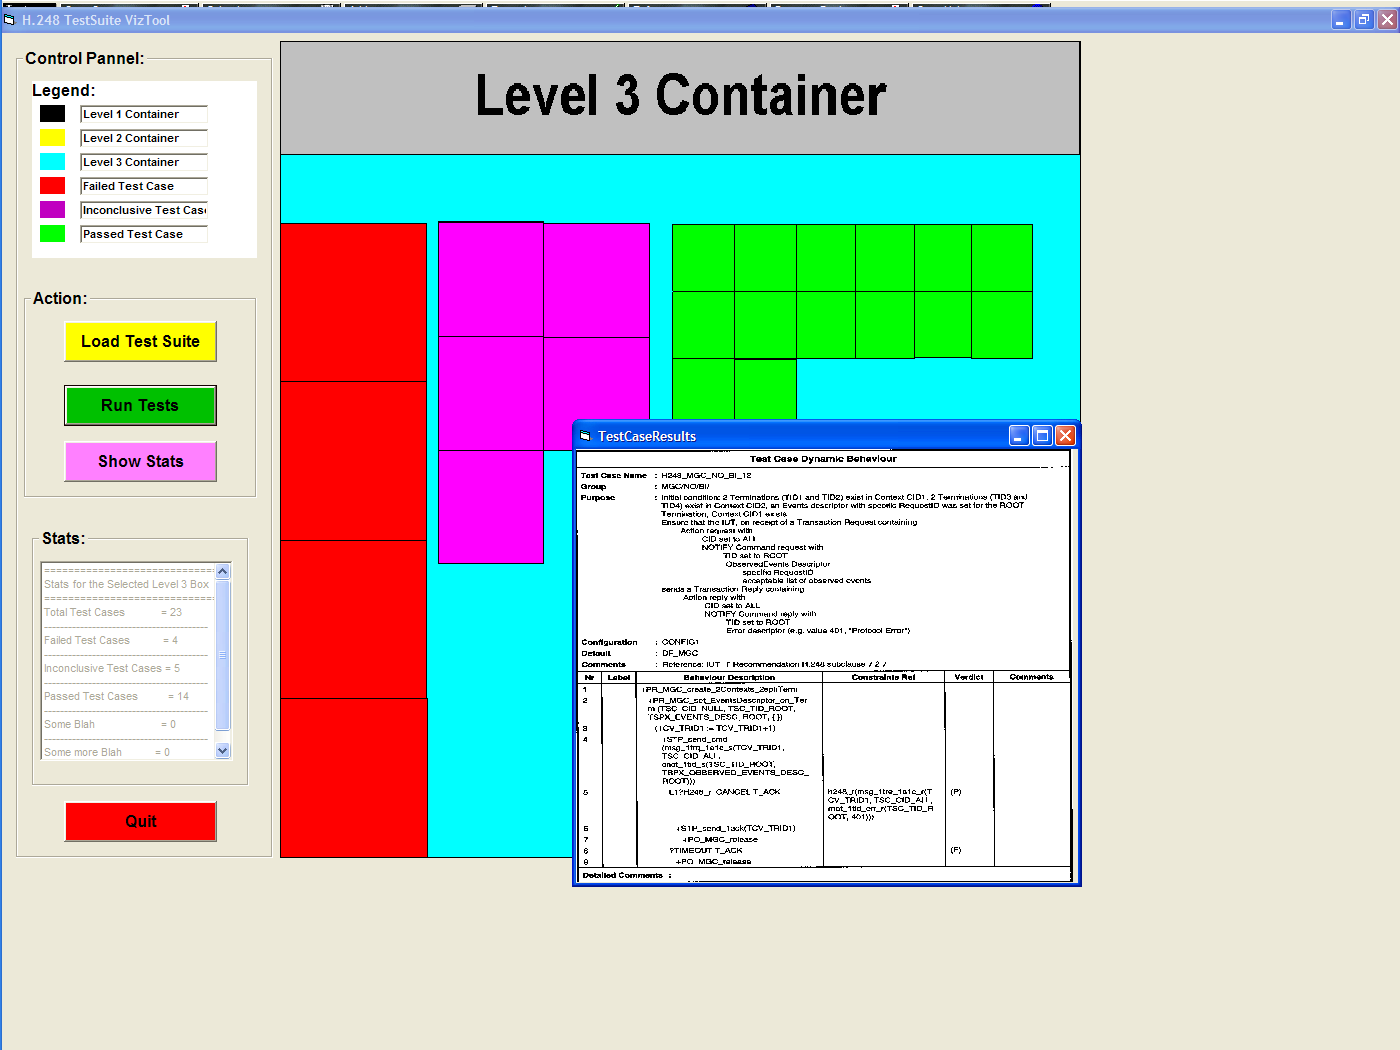
iv |
Question
(iv) can be answered by right-clicking on all Inconclusive test cases
of interest, and examining the corresponding TTCN table (LHS
figure). To provided an idea of what the full TTCN table would look like, we refer the reader to the RHS figure, representing a screenshot of our Visual Basic prototype (presented in Section 6). Reasons as to why we could not provide the full information of the TTCN table were provided in Section 2.c. We remind here that the detailed TTCN table shown in the RHS figure originates in the H.248 Conformance test suite, whereas our implementation uses the Vulnerability version. A proxy of this particular (question iv) action can be performed by the current tools as well; our implementation stands out by affording full maintenance of the hierarchy context while performing it. That is, the user never looses track of what groups the examined test cases belong to, and who are the neighboring groups. This context is not as easy to maintain and remember with current tools, which are using a scroll-through-a-list interaction metaphor. |
 |
 |
6. High Level Implementation:
- Approach:
- When we started our project, our knowledge of the treemaps
approach was limited. Regardless, we needed to understand how this
particular approach will help us solve our starting-point problem:
visualizing the results of a vulnerability test suite. We have
proceeded thus to implement a Visual Basic Wizard of Oz prototype
(which can be downloaded here).
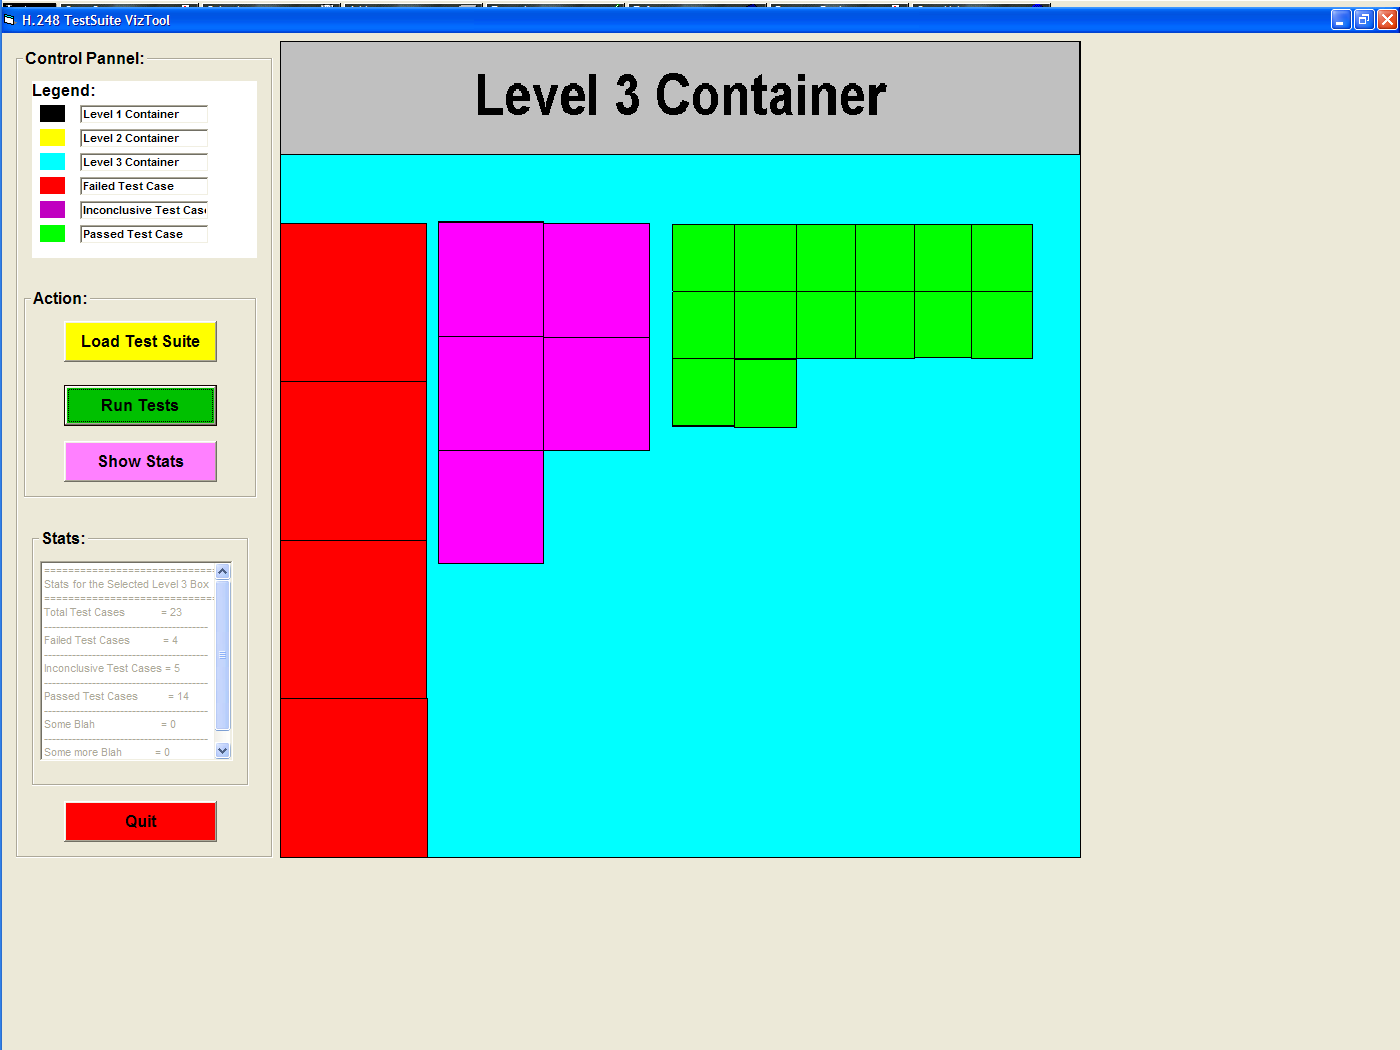
Screenshots of our prototype in action are provided below:
Open Structure File:
Open Verdicts File:
View of the Structure:


Run View of Results:
Zoom-in View:
TTCN-table pop-up
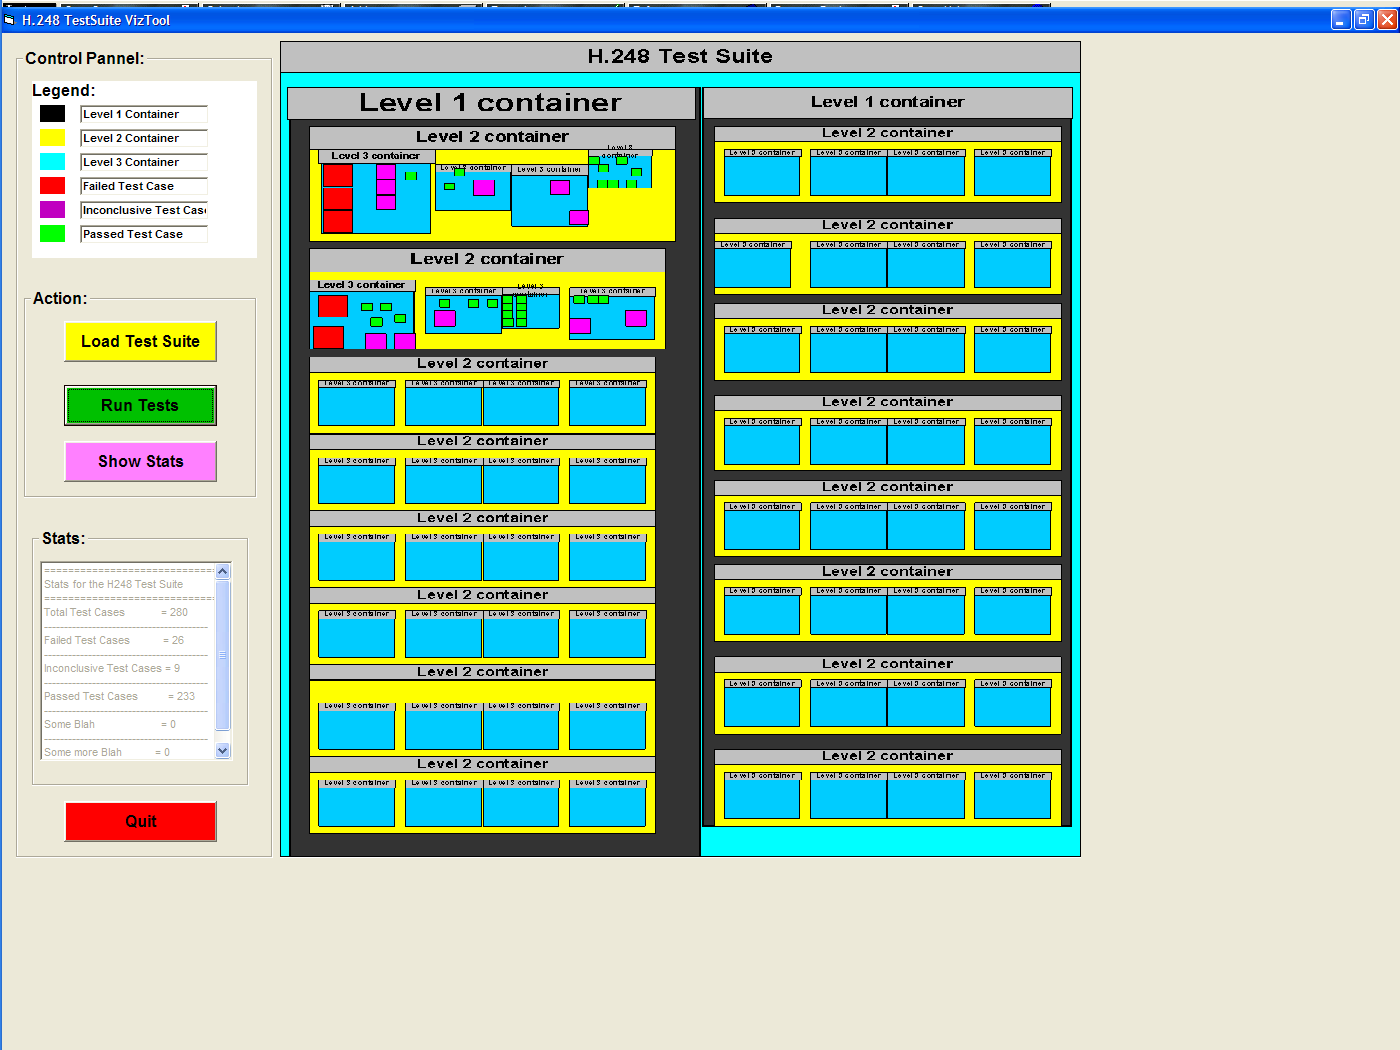
At that time, we were envisioning a self-contained windowing system, with a parent application "giving birth" to children windows featuring the various views of our graphically-rendered input data. This has been proved to be too hard to realize though, in the following sense: we were able to implement the windowing system, and instantiate children windows with the views of data and the control panel, but we couldn't enable mouse events to be percolated through. Thus, we abandoned this avenue in favor of a more common, independent windowing system.
- Once we became confident that we have a clear idea as to what
would be the graphic approach towards solving our infoviz problem, and
how the succession of views will flow on the screen, we began by
studying the treemaps approach in detail. We downloaded various
demo implementations, and used them to visualize the files on our
personal machines' hard-drives.
- Then, we downloaded the source code of a particular treemaps
library [9], and decided to use it as the core for
our implementation. Thus, the High Level diagram of our implementation
could be represented as below: the "CoreTreeMap Library" represents
the downloaded code; the yellow packages represent our contribution.
About that; we do not claim any specific software engineering
dependency -- we use the UML language in a liberal manner, as a mean of
conveying a message.
- When we started our project, our knowledge of the treemaps
approach was limited. Regardless, we needed to understand how this
particular approach will help us solve our starting-point problem:
visualizing the results of a vulnerability test suite. We have
proceeded thus to implement a Visual Basic Wizard of Oz prototype
(which can be downloaded here).
Screenshots of our prototype in action are provided below:
- High Level Implementation and provided functionality:
High Level Implemented Functionality:

Modules (screenshots detailing the implementation of each of the modules explained below are provided in Section 7):
- Parsing_Engine: this represents the entry point into our
system. That is, our implementation requires two input files:
- an input structure file, which will allow us to construct a
treemap reflecting the nesting structure of the particular test suite
to be visualized. This file must be in ttcn2 format (Section 2.c
develops the input file topic). This is however a client imposed
constraint, as most files of this genre are likely to be in ttcn2
format. Should this format change, we will only need to modify our
parser module.
- a verdicts input file, containing the ID of each test case
and
the associated verdict (a numeric value). In the first phase of our
project, this file used to be part of the same file mentioned in step
(i), and included, in addition, the corresponding ttcnTable. However,
once we
received the Vulnerability
version of our data, this assumption no longer held (mainly due to the
switch to ttcn3 language). Our client has consequently provided a
transformed version of the verdicts file, written in ttcn2 format,
which our parser module understands.
We would like to make clear the fact that the ttcn2 - ttcn3 issue cannot be solved by simply writing another parser. This is so because ttcn2 follows an XML-like syntax, with tags that can be followed. Ttcn3 by contrapart, is a fully featured programming language, as explained in Section 2.c. The consequence is that results, structure, and detailed test case runs are dissociated concepts.
Both files must be accessible from the machine running the implementation, either directly (from one of the machine's own hard-drives), or indirectly (via a network drive).
- Last, we will mention that the source code came with no
built-in parsing capability; it was only able to view the files on a
given
hard-drive.
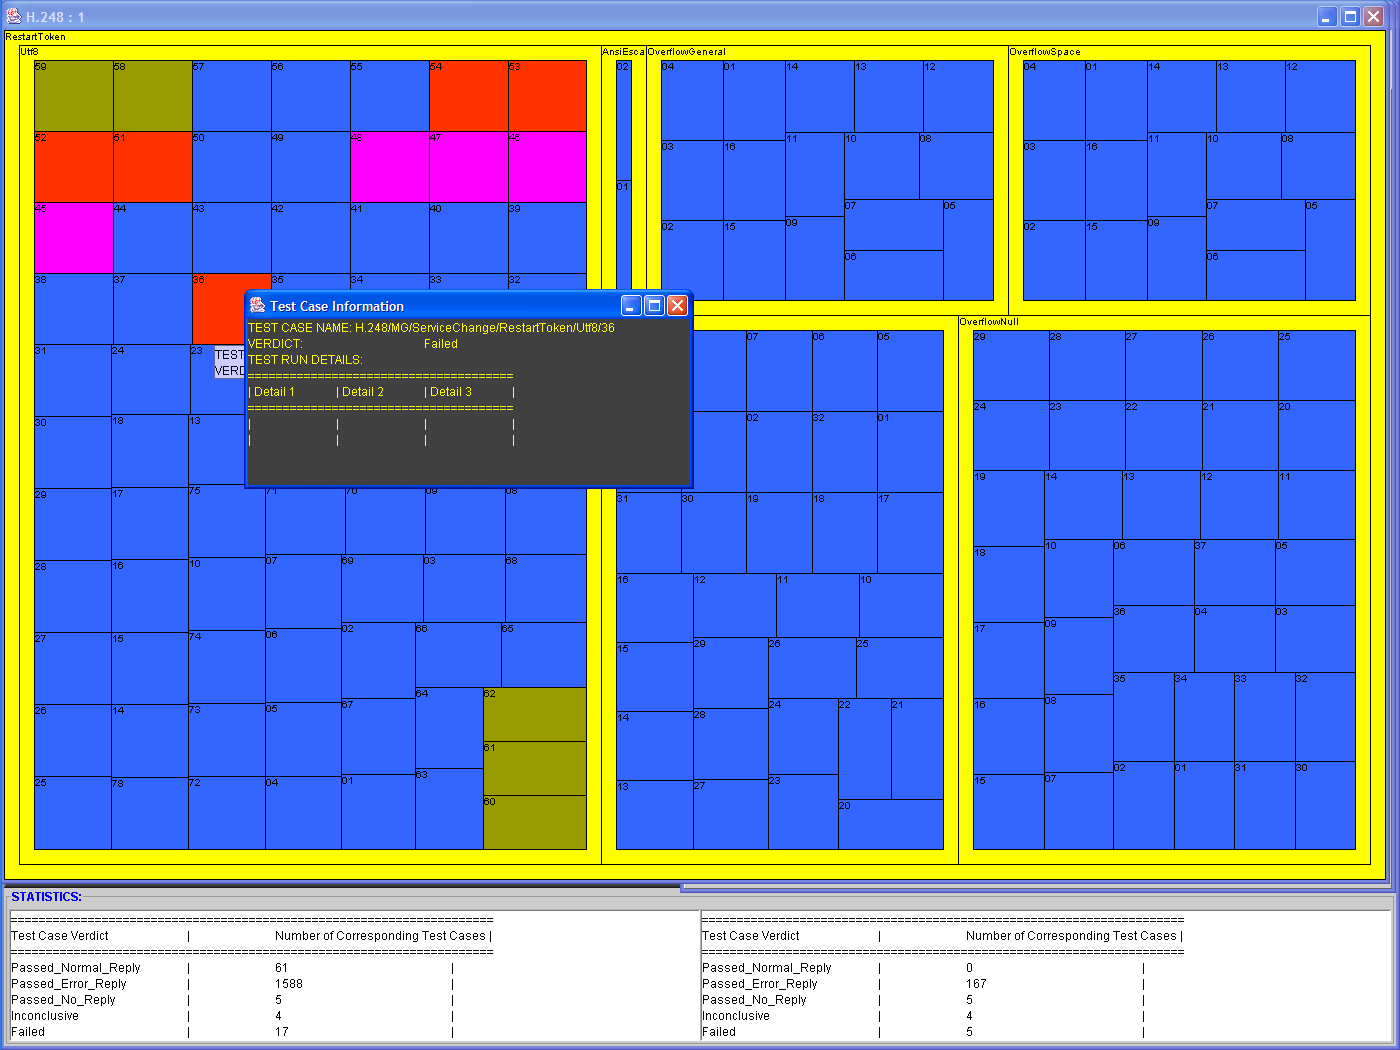
- TestCaseRunDetails:
- This is a partially implemented feature, in the sense
that (for reasons already specified) we do not have the required
information to display (i.e. the ttcn table). We have however
implemented the required functionality as follows. The user can
right-click on any test case, in any view mode, and a window will
pop-up containing the following information:
- test case name
- test case verdict
- layout for the test case run details (actual
information is missing)
- A stripped-down variant of this particular functionality
was also implemented in the form of a mouse tool-tip. The tool-tip
provides, for each test case, its name and its verdict.
- This is a partially implemented feature, in the sense
that (for reasons already specified) we do not have the required
information to display (i.e. the ttcn table). We have however
implemented the required functionality as follows. The user can
right-click on any test case, in any view mode, and a window will
pop-up containing the following information:
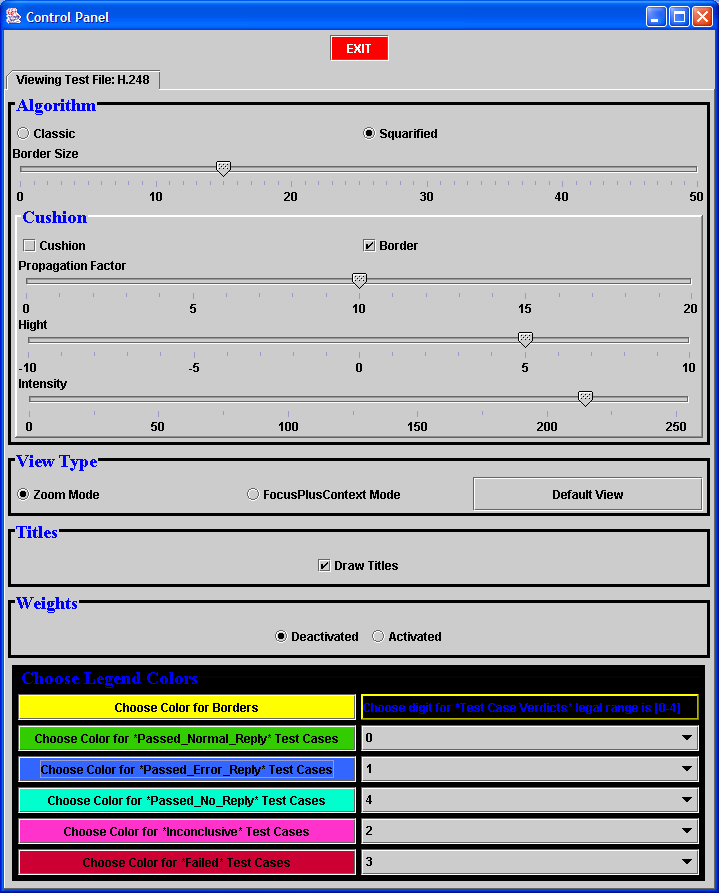
- GUI_Engine:
Some of the functionality provided by the GUI_Engine was provided in the original treemap library. It is as follows:
- choice of classic versus squarified view
- choice of borders' width
- cushion graphic enhancement, and pertinent parameters variation
- zoom-in level by level
We take credit for the following added functionality:
- exit button
- choice zoom -- focus + context -- default view mode
- weights assignment according to verdict
- choice of colors for borders, and for all possible types of verdicts
- choice of dynamically assigning any digit (within a valid
range) to any of the possible verdicts
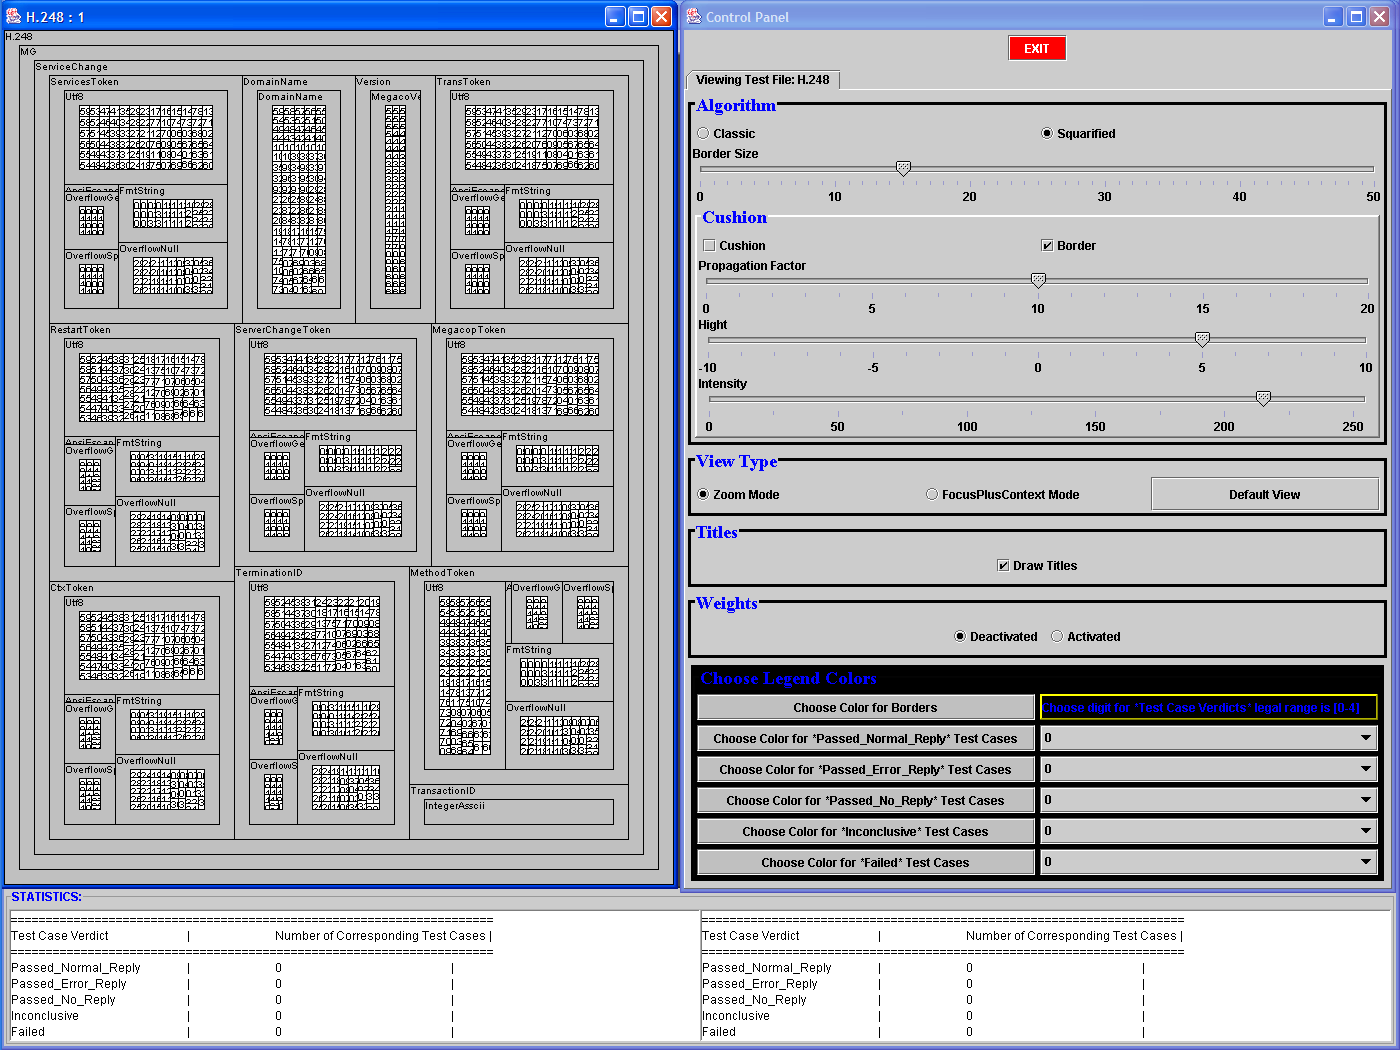
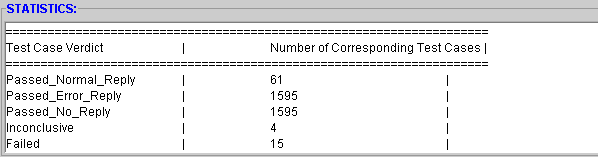
- Stats_Engine: has two main components: Global and Partial
- The Global stats panel provides stats with respect to the entire test suite. That is, it provides:
- total number of test cases
- how many cases of each possible verdict are there
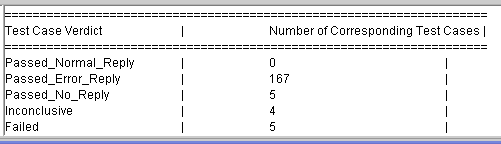
- The Partial stats panel provides the same information but
only for the group(s) that were either in full view after zooming, or
have been enlarged via the Focus+Context feature.
- Focus+Context_Engine:
Once the user chooses this option, any left-click on the border of a group (or inside that group) results in the following:
- the method paintImmediately(int
x, int y, int w, int z) is invoked, so as to bypass the queue
for the processor cycles. This is required so as the Swing component
keeps in real time with its internal state (this approach is similar to
the one utilized during a scroll operation) [10].
- the refresh rate (number of calls to paintImmediately()
per
second) was set at 10 calls per second, but we are not claiming that
this is optimal, nor that it applies to every end-user computing
environment. As a future work subject, we would like to make this a
user defined parameter, so as to make provisions for implementations
running on particular high-end or low-end machines.
- for every call to paintImmediately, the weight of each
child is increased by 5%, and this was appropriate for a refresh rate
of 10. Again, once the refresh rate becomes dynamically assigned, this
percentage would have to be adjusted as well.
- the original algorithm was implementing a sorting
operation before each graphic rendering, and this had the disconcerting
effect of shifting increased groups towards the upper LHS corner of the
treemap. This was mainly due to the fact that larger groups were always
drawn first, so as to maximize the squarified layout of the treemap. To
address the shifting of the increased groups problem, we have disabled
the sorting step of the algorithm after the initial treemap drawing has
been completed. This results in groups increasing their size without
leaving their original place in the treemap.
- the method paintImmediately(int
x, int y, int w, int z) is invoked, so as to bypass the queue
for the processor cycles. This is required so as the Swing component
keeps in real time with its internal state (this approach is similar to
the one utilized during a scroll operation) [10].
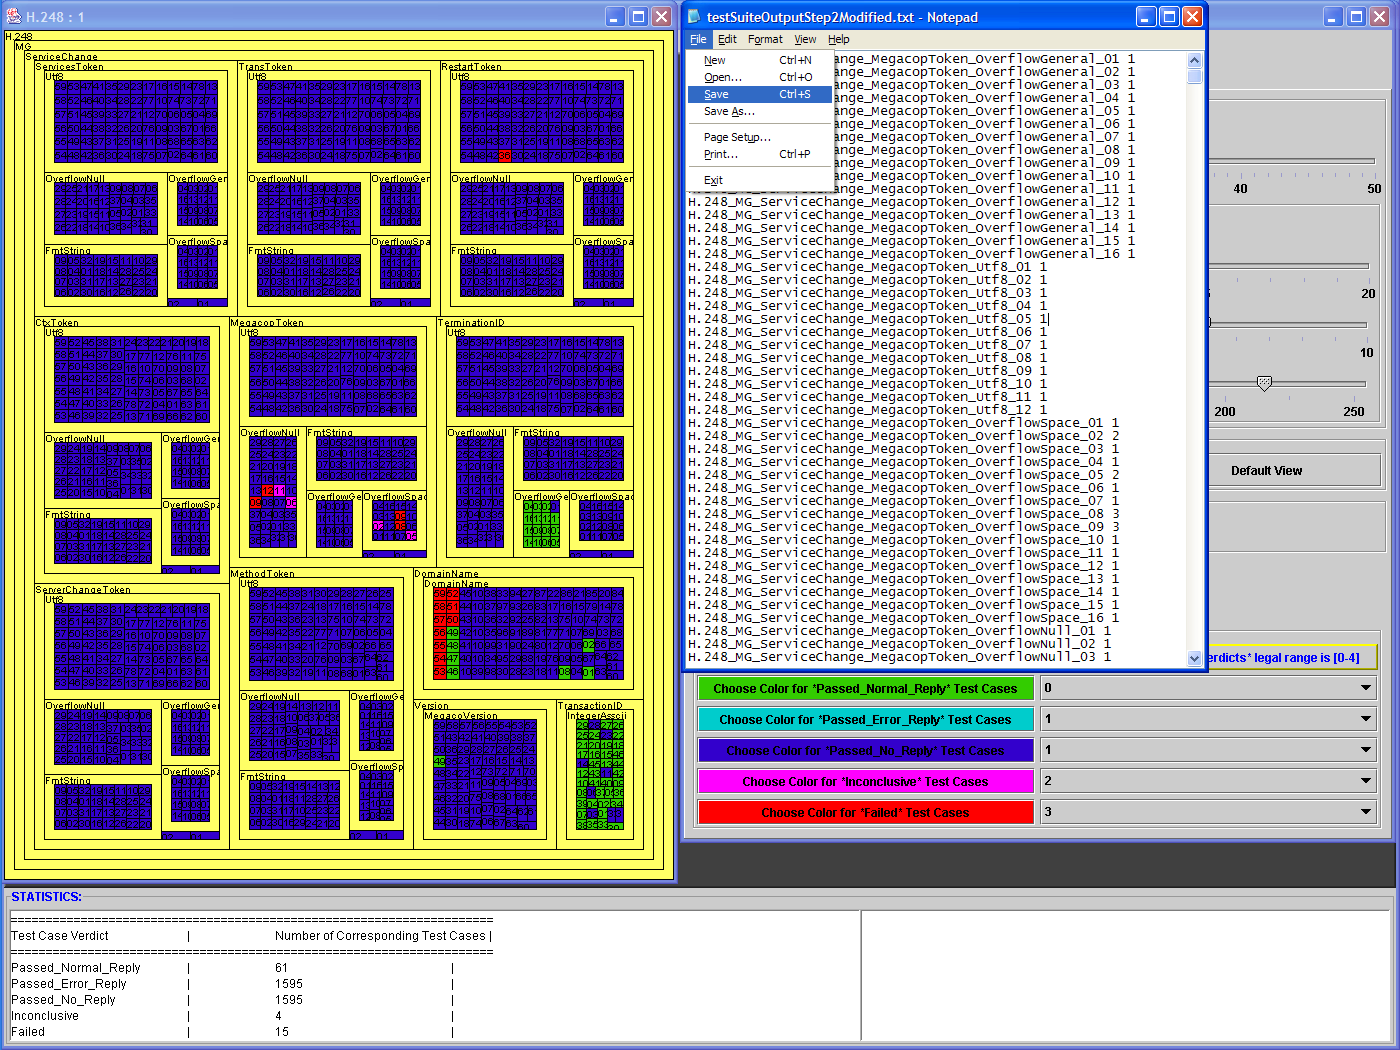
- Dynamic_Update_Engine:
- The idea behind this was to enable our tool to update the
treemap view at test suite run time. We have implemented this by
placing a thread on the verdicts file, and detecting any changes
compared to the initial state. We have not been able however to enable
the test running program to write to our verdicts file one verdict at a
time, as this was not within the scope of the work exercised by the
team implementing the vulnerability test suite.
We can mimic this behavior by manually altering the verdicts file (with a text editor), and observing the changes once we save the file.
- The weights assignment feature enables users to enter a
mode where different weights are assigned to all test cases having a
specific verdict. This translates into test cases with different
verdicts having different sizes. The weight allocation schema is as
follows:
- verdict of -1 (i.e. not run) ........................................ weight of 1
- verdict of 0 (i.e. passed with normal reply)............... weight of 2
- verdict of 1 (i.e. passed with error reply).................. weight of 3
- verdict of 1 (i.e. passed with no
reply)...................... weight of 3
- verdict of 2 (i.e.
Inconclusive).................................. weight of 4
- verdict of 3 (i.e. Failed) ........................................... weight of 5
- verdict of 4 (i.e.
Unassigned).................................... weight of 6
- The idea behind this was to enable our tool to update the
treemap view at test suite run time. We have implemented this by
placing a thread on the verdicts file, and detecting any changes
compared to the initial state. We have not been able however to enable
the test running program to write to our verdicts file one verdict at a
time, as this was not within the scope of the work exercised by the
team implementing the vulnerability test suite.
This constitutes the main reason behind us dropping the use of an external tool for implementing the focus plus context functionality. - Parsing_Engine: this represents the entry point into our
system. That is, our implementation requires two input files:
7. Screenshots of software in action:
| Opening
an input-structure file |
Opening
an input-verdicts file |
Default
view -- no customization |
||
|
 |
 |
||
| Customizing
the interface by choosing colors: |
Exploring
the structure and the test suite results once customization is done: |
The
Control Panel after customization (corresponds to view at left) |
||
 |
|
 |
||
| Zooming-in |
Test
Case run details table |
Focus
plus Context |
||
|
|
|
||
| Weights
assignment |
Global
and Partial Stats windows (Partial corresponds to Zoomed-In image above row, LHS) |
Dynamic
Update |
||
 |
|
 |
||
| Cushions
Graphic enhancement |
Classic
view with cushions |
Mouse
Tool-Tip |
||
 |
 |
 |
8. Results:
The results of our project are mainly outlined via the screenshots of our software in action. We would only briefly mention the following highlights:
- successfully visualized 1,771 test cases of the H.248 Vulnerability test suite in one screen -- no scrolling or panning is required
- successfully implemented a customization that allows people who are color-blind to choose colors that they can see
- the settings of any given user are saved so that there is no need to redo them the next time the implementation is started
- the control panel is un-obtrusive
- successfully implemented test case run details table
- successfully implemented mouse tool tip
- successfully implemented global and partial stats window
- successfully implemented focus plus context functionality
- successfully implemented the assignment of weights according to
the verdict of a given test case. This results in larger/smaller
dimensions for a particular test case according to its verdict
9. Lessons Learned:
- Java 2D is a powerful tool. It enables features that we would have thought only possible with third party plug-ins
- working with real-life clients is not easy -- they do not always know how the "thing" should look; only how it should behave and what it should do. We think this is normal, but wish clients will take advanced computer graphics courses before contracting/ordering :-)
- understanding somebody else's code is not a trivial endeavor
- defining the perfect GUI is an even harder endeavor
10. Evaluation:
We have not conducted a formal evaluation of our project for logistic reasons. We will outline however the following:
- the client for our project provided us with informal feedback expressing his full satisfaction with the results of our project
- an earlier prototype's screenshots were presented via a teleconference with Industry Canada, and obtained positive comments
- the client intends to organize a field trip to one of Vancouver's
networking companies, and present them our project for potential
real-life testing
11. Future Work:
We would like to further develop the following aspects of our implementation:
- implement the visualization of several (up to four) test suites. These could be different products, or separate input files of the same test suite.
- find a resolution to the ttcn2/ttcn3 problem, and populate the test case run details table with pertinent data
- use this table for input, not only for output. For example, the user might want to modify some parameters related to a given test case after the initial results are viewed
- make the number of calls per second to paintImmediately() a user defined
parameter to maximize performance on any end-user computing environment
12. References:
[1] http://www.cis.ohio-state.edu/~jain/cis788-99/ftp/voip_products/index.html
[2] http://www.ietf.org/internet-drafts/draft-ietf-idr-bgp-vuln-00.txt
[3] http://www.packetizer.com/iptel/h248/
[4] http://www.voiptimes.com/research/products/network_test/
[5] Multitrees: Enriching and reusing hierarchical structures. George W. Furnas and Jeff Zacks, SIGCHI 1994 , pp 330-336
[6] Cone Trees: Animated 3D Visualizations of Hierarchical Information George G. Robertson, Jock D. Mackinlay, Stuart K. Card, SIGCHI 1991
[7] http://www.cs.umd.edu/hcil/
[8] Cushion Treemaps Jack J. van Wijk and Huub van de Wetering, Proc InfoVis 1999, pp 73-78
[9]
[10] http://java.sun.com/products/jfc/tsc/articles/painting/