Most papers are polished many times before they are submitted to publication. Frequently, a paper was written collaboratively by multiple authors. In the final editing phrase, each author revises the document sequentially, so the document evolves from one version to another. However, sometimes it is very hard to tell how one version differs from another. For example, it is not very obvious what the new changes are in the more recent version, what the locations of these changes are, whether there are any conflicting changes and etc. Especially, when the size of a document is fairly large, a lot of effort and time is required to spot each change.
We believe a visualization system can alleviate the problem associated with document revision. Our goal is to build a visualization tool that can effectively assists people visualizing the differences between two or more versions of a document on a high level, and at the same time, help people spot changes between two versions quickly and accurately.
Over the past decades, little attention was paid on the document visualization. Many visualization tools have been developed to help programmers understand and develop programs. As the Object-Oriented Programming (OOP) techniques develop, more and more modules of codes can be executed independently. Therefore, these codes can be places in flexible locations. As a result, most of these visualization systems focus on providing independent local information of the source code, such as using color coding for authorship, color brightness for temporal information and so on. However, it is not the case when writing articles, where paragraph arrangements directly affect the flow of documents.
Another important difference between software development and document revision is that code editing are often large chunks of local changes while document revisions usually contains many small global changes (changes that scatter over the entire document). Current visualization tools do not perform very well under large amount of small global changes. SeeSoft[ESS92]employs color bars to represent the authorship information and temporal information of a bunch of different files in a project. xxdiff[Mar00]uses SeeSoft-like color bar to give the user a global view of the two documents being compared and use different foreground and background colors of the text to encode the difference of the two documents. However, when the documents are long or when there are lots of differences between the two documents, the SeeSoft-like bar fails to give a clear view of the document. HistoryFlow[MaF03]provides a clear view of continual evolution of a ducoment. However, it does not provide detail comparison between different versions. In addition, the above systems are not straightforward to use. Often times, users spend considerably amount of time understanding these tools.
We call our system ClearEye: An Effective Visualization System for Document Revision. The dataset used in the system can be downloaded from the wikipediam. However, any different versions of a certain document can be the dateset. The documents are text format most likely.
The system will support the following tasks:
- User explorations on various versions of a document
- User explorations within a single version of a document
- Locate changes in one version from another version
- Accept or reject changes
- Re-structure a certain version
We do not have much expertise in this area except some knowledge on the available software tools discussed in class. However, we have done a fair amount of literature research on versioning control, and we will continue to do that throughout our project.
First of all, the system will provide the user with a global view of the evolution of the document, giving the user a clear understanding of the relationship between different versions of the document. An improved parallel coordinate will be employed for this purpose. A zoomable interface will lead the user to an intermediate view where a side by side comparison is made between any two versions in which the user is interested. This immediate view will give a relatively detail information of the two versions, which gives the user a clear view of the information within a document and maintain a context of the information at the same time. After that, the system will display the text at the request of the user, which gives the user the opportunity to make decisions about the changes.
There are some possibilities for implementation:
- Java and Jazz
- Java and ZVTM/ZGR Viewer
- C++ and OpenGL
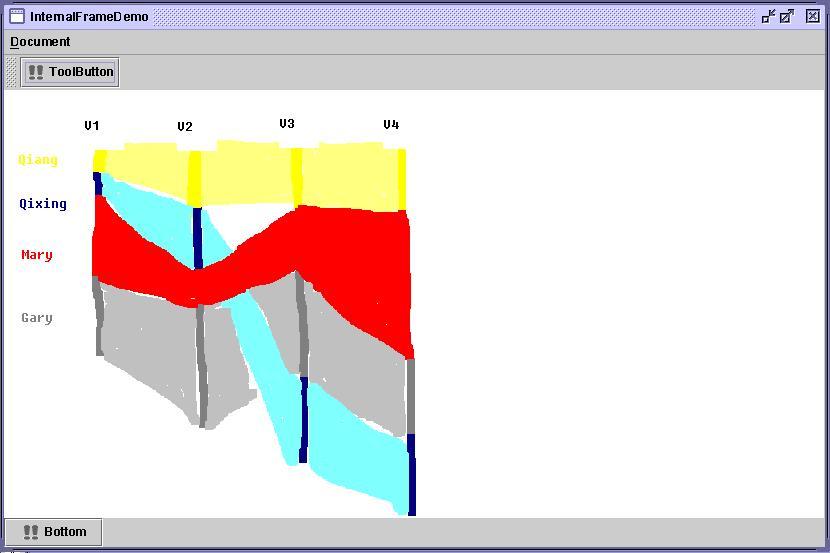
A group of four people are revising a final report for a class project. All members of the group take turns to make some changes to the document. Now, it is Mary's turn. She wants to see which section of the document has the most dramatic changes over the past revisions and what changes have been made in the latest version. She inputs the first three revisions into the visualization system and finds out section 2 of the report has been edited the most atfer seeing figure 1.
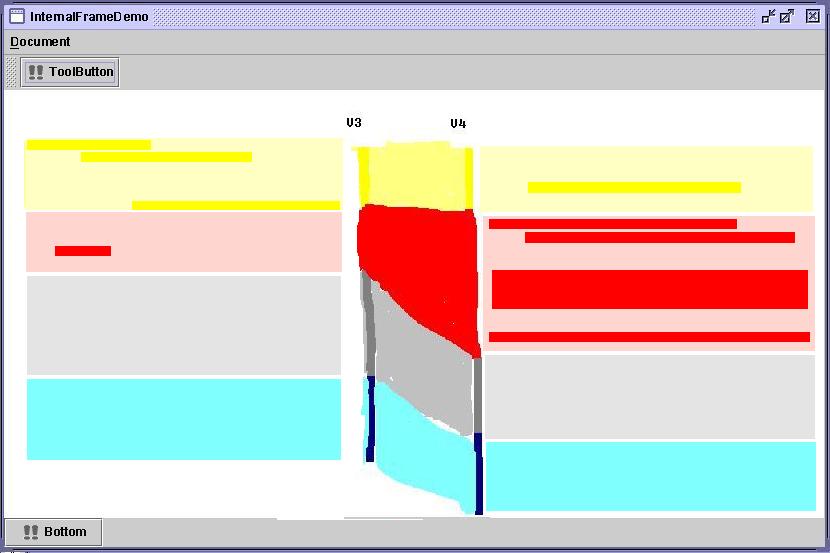
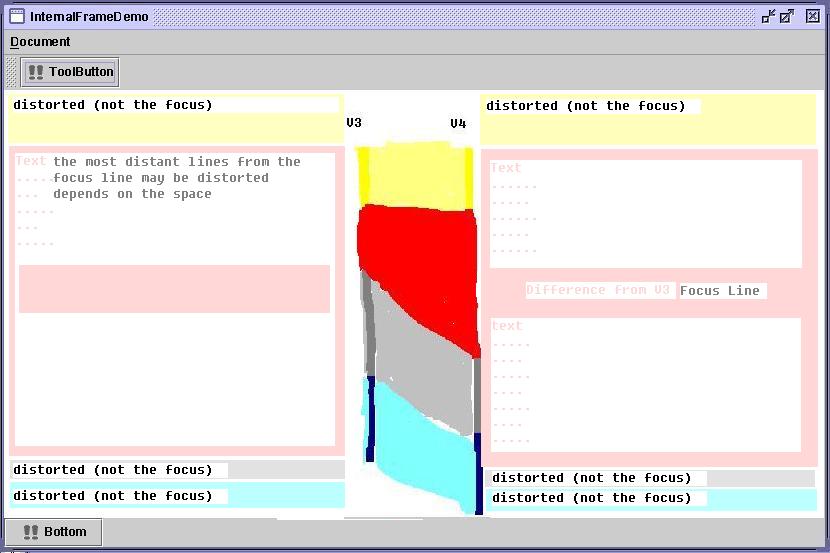
She is curious to see what section 2 looks like now. Mary then selects the two latest versions and zooms into the intermediate level(figure 2). She easily find that lots of changes have been made in the middle part of the paragraph. To see the detailed difference between the two versions, she then zooms in to get a detailed view of the document(figure 3). She reads section 2 first and compares the differences between the newer version and the older version to see if she agrees the changes in the new version. She can also add some changes of her own in the latest version, which later will be saved as version 4. She does the same procedure for all other sections.
Phrase I: Design More Low-Fi Prototypes
- Come up with other alternative visualization designs. Make paper markups for all these designs and test them with potential users to decide with design to implement in phrase II.
Phrase II: Implementation
- Algorithm search (mainly the diff algorithm between two documents) and implementation
- Interface design and implementation
- Visualization implementation
Phrase III: Testing
- Generate simulated use of the visualization system. If we have time, we will do some real user testing.