CS533C Course Project Proposal
Mingyue Tan (mtan@cs.ubc.ca)
One of the key techniques in multivariate visualization is dimensionality reduction, which aims at visualizing multivariate data in a low-dimensional space while preserving the structure of the data. There are two approaches to dimensionality reduction: coordinates-based linear approach and pairwise-weights-based nonlinear approach. Neither of them is superior to the other from all aspects. Y. Koren and L. Carmel [1] recently presented a novel family of linear transformations, which integrate the characteristics of both approaches by enriching linear methods with tunable pairwise weights. They claim their technique is the only one that has the ability to simultaneously account for many properties of the data such as coordinates, pairwise similarities, pairwise dissimilarities, and their clustering decomposition.
However, the software that implements this novel technique is not available. This motives me to build a visualization system that uses this new technique and allows a user to specify which properties the resulting embedding should reflect.
As the authors of [1] mentioned, the resulting embedding should be very instructive in validating the results of a clustering algorithm or in revealing interesting structures like:
l Which clusters are well separated and which are similar?
l Which clusters are dense and which are heterogeneous?
l What is the shape of the clusters (elongated or spherical)?
l Which data coordinates account for the decomposition to clusters?
Additionally, I want my system to perform the following task:
l Which data point(s) are outliers?
This task is important because outliers might be mislabeled. By detecting outliers, the system can help a user find labeling mistake.
I am thinking to use the same datasets that the paper used. Specifically, the datasets include:
The 13-D Colas dataset [Schiffman, Reynolds, & Young, 1981]
l The Mammals dataset [Allison & Cicchetti, 1976]
l A multi-class labeled dataset
The hand-written digits dataset [Alpaydin & Kaynak, 1998]
My knowledge on clustering, classification, and outlier detection is from last fall’s two courses-CS504 (data mining) and CS540 (machine learning). However, I am new to visualization, new to PCA, and new to linear discrimination.
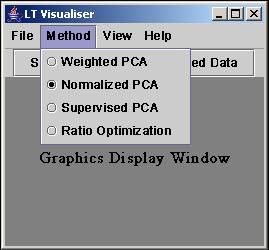
The solution is primarily based on the technique presented in the paper [1]. Their framework includes several methods, and each of them solve a particular problem. To be specific,
|
Method |
Dataset |
Result Embedding |
|
Weighted PCA |
Colas |
Reflects both coordinates & dissimilarities |
|
Normalized PCA |
Mammal |
Robust towards outliers |
|
Supervised PCA |
Labeled multi-class |
Separates clusters clearly |
|
Ratio optimization |
Hand-written digits |
Accounts for both inter-class repulsion & intra-class attraction |
The system will allow a user to choose which properties they want the result embedding to reflect according to their task, though the default result presents an optimal embedding that accounts for all of the properties.
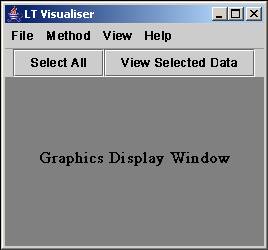
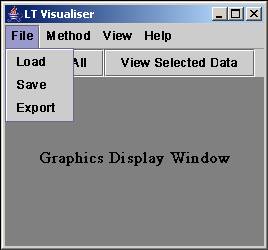
A user will first see an optimal embedding that reflects all properties of the data. This will give the user an overview of the data. This embedding should help the user solve most of his tasks. The user can further investigate the data by choosing either which methods they want to use or which properties they want to see from a pull down menu. Further more, they can see the index of an original data entry by putting their mouse over that particular data point. They may need to do this after they see an outlier and want to know which tuple this data point represents.
1. Java/Windows if based on FSMvis MDS code (*)
* If the existing system above turns out useless, I will implement my own visualization tool using Java under Windows.
|
|
|
|
|
|
l Implement and test weighted PCA method
l Implement and test normalized PCA method
l Implement and test supervised PCA method
l Implement and test ratio optimization method
l Modify the UI and add user’s control over property and ratio. (*If time permits*)
[1] Y. Koren and L. Carmel, “Visualization of Labeled Data Using Linear Transformations”, Proc. IEEE Information Visualization (InfoVis’03), IEEE, pp.121-128, 2003.