Project Proposal : LabVis
CPSC 533 - Information Visualization
Adam Bodnar and Dmitry Nekrasovski
bodnar@cs.ubc.ca
dmitry@cs.ubc.ca
March 1, 2004
Overview
The goal of this project is to develop an effective visualization
for displaying and interacting with medical laboratory results.
Motivation
Current methods of reporting and interacting with medical laboratory
results consist of text and numbers, which can be printed out or displayed monochromatically.
While such a technique is sufficient, it does not take advantage of advances
in both computer and visualization technology, which could lead to increases
in efficiency, and help in the process of teaching medical interns the process
of diagnosis [3].
Domain, Task, and Target Data Set
This project lies in the domain of laboratory medicine, the medical
specialty that deals with all aspects of performing and interpreting laboratory
tests. Current techniques for displaying and interpreting laboratory results
are sufficient for senior clinicians who practice in a variety of specialties,
but for medical students and interns, the challenge of interpreting appropriate laboratory
tests can be enormous [3].
The task is to display a series of interactive, effective visualizations
that illustrate the results of laboratory tests. For the purposes of this
project, the visualization will involve the results of a thyroid function
test, which is commonly used to diagnose disorders of the thyroid gland and also to monitor the effects of treatment of known thyroid disease
[2]. The
common analytes measured by a thyroid function test are free thyroxine (FT4)
and thyroid stimulating hormone (TSH). In addition, optional supplementary
analytes that may also be measured when FT4 and TSH levels are outside the
normal bounds include thyroxine (T4), free triiodothyronine (FT3), and
anti-thyroid peroxidase antibodies (anti-TPO) [1].
The target data set is a time-series of approximately 1500
thyroid function tests, all of which include FT4 and TSH results. Some of the
tests also contain measurements of T4, FT3, and anti-TPO. Most patients whose
tests are included in the dataset have been tested multiple (up to 15) times.
Personal Expertise
Aside from watching multiple episodes of NBC's hit medical drama
E. R., we are not familiar with the area at all, but feel that this will be
an interesting and practical problem to solve using visualization techniques.
Proposed InfoVis Solution
We propose LabVis, an interactive system for displaying medical
laboratory results. The LabVis system is made up of three different, but linked,
visualizations aimed at providing the user with both an overview of patient
test results through time and specific information for one or more
tests. These are illustrated in the diagram below. The first visualization offers a time-series based overview of FT4
and TSH laboratory test results for a specific patient. The normal ranges of
each analyte will be highlighted. A secondary visualization displays a scatterplot
of FT4
vs. TSH, and is used to interpret selected test results chosen by the user based
on the primary time-series overview. Again, highlighting is used to indicate
those areas which lie outside the normal range. A third visualization displays
the numerical test results, as well as supplementary laboratory test data. As
with the primary time-series visualization, highlighting is used ito indicate
those areas which are abnormal and require immediate attention. A different
type of highlighting is used to link the visualizations by denoting the test
results currently selected by the user. Together, these
linked visualizations provide decision support for the physician by displaying
an overview of patient laboratory results, along with supporting details-on-demand
interaction to aid the physician in making a diagnosis and monitoring patients
for possible abnormal medical conditions.
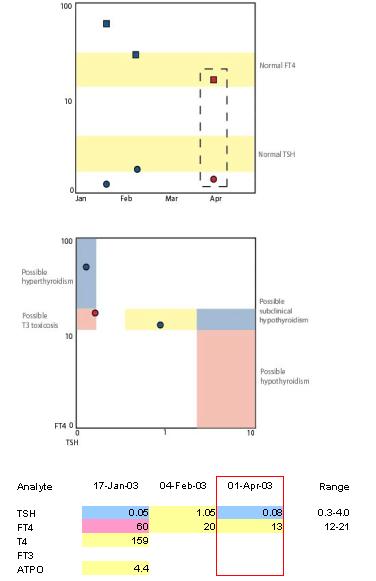
Scenario of Use
-
A clinician enters the patient number of a patient in the
dataset, and is presented with the three visualizations shown on the right.
-
The clinician inspects the first (time-series) visualization and
notices that, while the patient's thyroid test from February falls into the
normal ranges of both FT4 and TSH, his/her most recent TSH sample doesn't fall
into the normal range.
-
The clinician selects the most recent set of tests, which is
then highlighted in red in all the visualizations.
-
The clinician inspects the second (scatterplot) visualization
and observes that the highlighted test results fall into the range of possible
T3 toxicosis. To confirm this diagnosis, the clinician requires a measurement of
the FT3 analyte.
-
The clinician refers to the third (numerical) visualization,
observes that the highlighted test results do not include a FT3 measurement, and
orders an FT3 test to be performed on the patient.
|
 |
Proposed Implementation
LabVis will be implemented using Java.
The InfoVis
Toolkit will be used to provide time series and scatterplot drawing
functionality required for the appropriate visualizations.
Project Milestones
- Send Dr. Wes Schreiber a copy of this proposal and get his feedback
- Experiment with the InfoVis Toolkit
- Create a prototype of each visualization view separately
- Integrate prototype together and enable interaction
- Demonstrate LabVis to Dr. Wes Schreiber and get his feedback
- Perform final user evaluation
References
- Great Smokies Diagnostic Laboratory,
GSDL Comprehensive Thyroid
Assessment, Asheville, NC, USA, 2002.
- Jones, G. Thyroid
Function Tests. The Pathology Service of St. Vincent's Hospital,
Sydney, Australia, 2000.
- Schreiber, W. Interpretation of Laboratory Tests in Real Time with Real
Patients. Hand-Out, Department of Pathology and Laboratory Medicine,
Vancouver General Hospital, Vancouver, Canada, 2004.
Adam Bodnar
Last modified:
2004-02-29 5:32 PM