1. Project Authors:
| Author Name: |
Email: |
| 1. Alam, Mohamed |
malam@cs.ubc.ca |
| 2. Chita, Christian |
cchita@cs.ubc.ca |
| 3. Yu, Anthony |
pqyu@cs.ubc.ca |
2. Description of domain, task, dataset:
- Domain Description:
Over the last decade, the computing experience has changed for both business and private users, mainly due to the advent of powerful, yet affordable machines. In addition, a significant amount of data has migrated from shelved hard copies to the World Wide Web, sparkling a frenzy of Internet activity all over the world. Moreover, interpersonal communication equally migrated in a significant proportion over the web. As a consequence, always on, high speed internet connections have become common in the western world households, and a pletora of service providers has flourished to answers the new, Internet-related needs of the population.
One such need is Internet Telephony. Unfortunately, it is an emerging technology and has a number of technological and evolutionary issues. The technological issues are mainly because the Internet was not designed for real time traffic such as voice and video. However, the benefits of using IP as a generic platform for both data and real time applications are compelling enough to encourage resolution of these issues [1].
One of the main reasons behind the security problems affecting today's online services resides in the fact that interdomain routing protocol BGP was designed at a time when the Internet was nowhere near its present complexity. In addition, since BGP is a TCP/IP protocol, it is subject to all vulnerabilities characteristic to TCP/IP [2]. Testing for the various vulnerabilities affecting a given networking protocol has gained thus outmost importance in recent days, and given the complexity of today's systems, the number of test cases to be run by any given test suite easily reaches an 10^3 order of magnitude.
- Task Description:
Professionals working in the computer networks field need to test the various protocols for both conformance (to accepted industry standards) and vulnerability (to the most common/obvious threats, and beyond). Using an automated tool, the developer will submit a given networking protocol to a series of test operations, and observe the outcome. For those cases where one or more test cases fail, the developer needs to be able to extract conclusions of the following nature:
- are all, or a majority of the failed test cases concentrated in one particular phase of the protocol?
- are all, or a majority of the failed test cases trivial, or do they belong to a high priority equivalence class?
- are all, or a majority of the failed test cases in one branch of the testing tree in any way related to those in some other branch of the tree?
- how far along each branch was the test suite allowed to
progress, before the occurrence of the first major failed case?
- the usual how-many-of-each stats
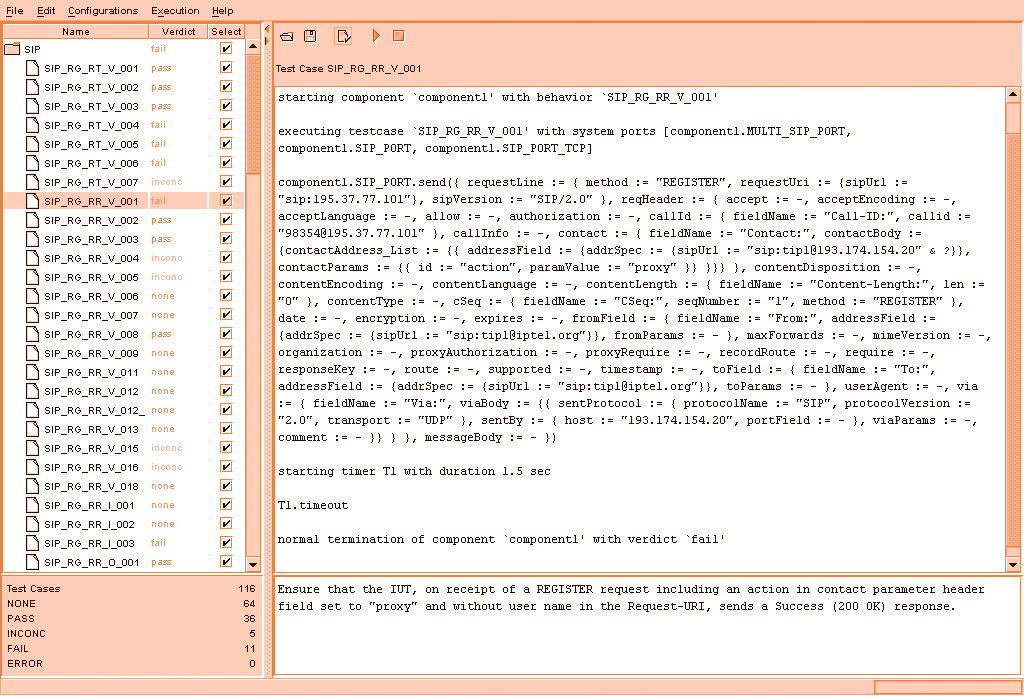
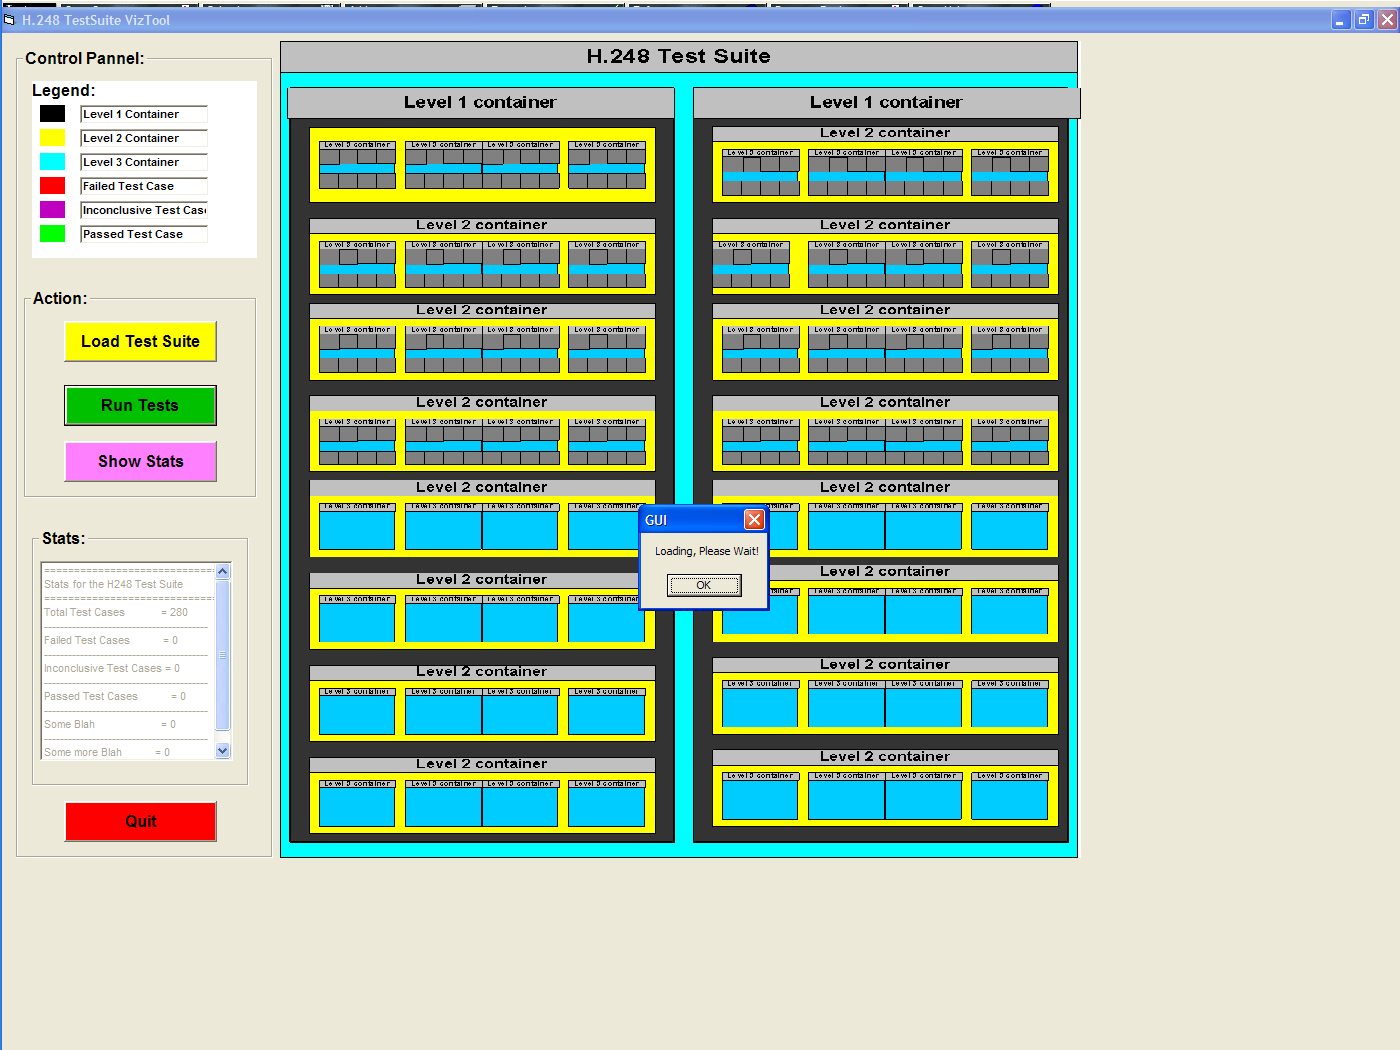
The problem with the current human interface of the available test suites is that they easily afford only the latter type of inference, as the screen shot bellow shows. The tester needs to perform significant additional steps to answer (i)-(iv) type questions.
- Dataset Description:
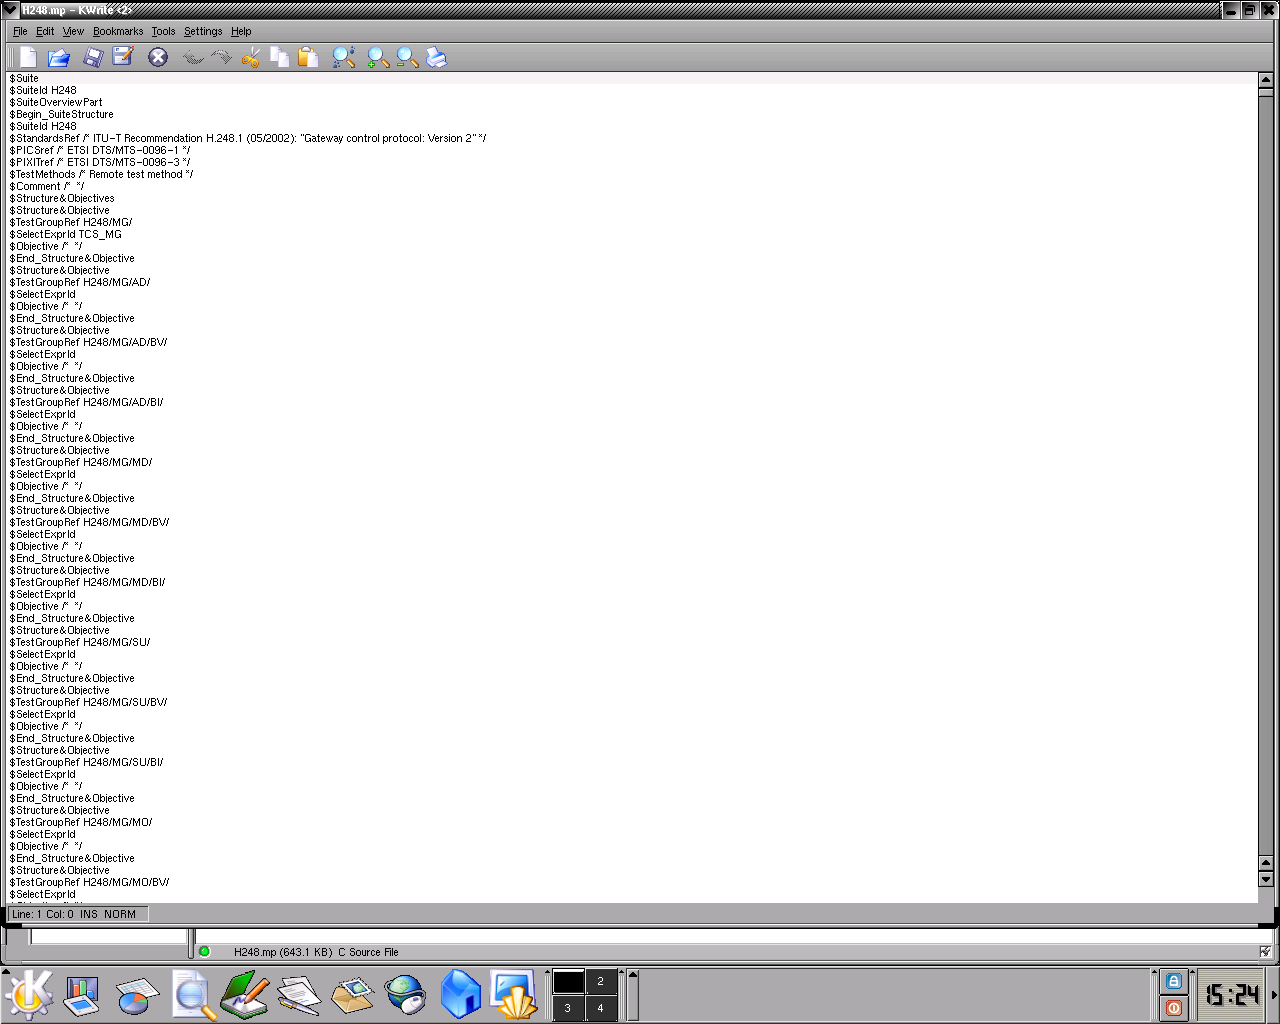
Significant inroads have been made in automating the networking protocols' testing task, and the H.248 [3] test suite is an industry wide accepted tool. It is based on the Tree and Tabular Combined Notation (TTCN), defined by the International Standard Organization and International Electrotechnical Commission, and it is composed of a collection of various test cases together with the declarations and components it needs. H.248 is a Conformance test suite for the Voice over IP (VoIP) protocol. The main component of the test file can be examined here, or glimpsed at by clicking on the thumbnail bellow. In addition, for a human readable version of the file, please follow this link.
Given that the creation of a comprehensive vulnerability test suite is a work in progress for the CPSC 527 project work, we will be using the H.248 test suite (current industry standard) as input for the CPSC533 course project. We expect the transition to the newly created test suite to be uneventful, as both test suites will be following the TTCN language specifications. In addition, the clients for our tool would welcome the visualization of the conformance test suite as well.
3. Personal Expertise:
All three authors of the project have an interest in networks and networking protocols, and have taken courses in this area at the undergraduate level, but are not familiar with the (vulnerability) test suites and their use. Furthermore, the authors have no background in computer graphics or information visualization. They have done intensive research (paper reading/analysis) on the topics outlined above only after registration in the {CPSC533/CPSC527} classes.
In addition, one group member has taken HCI courses at both undergraduate and graduate levels, and has worked on a few projects involving computer/human interfaces and usability testing.
As well, a third member of our group has working experience (8 months) with building a GUI in the Java programming language.
4. Proposed InfoViz solution:
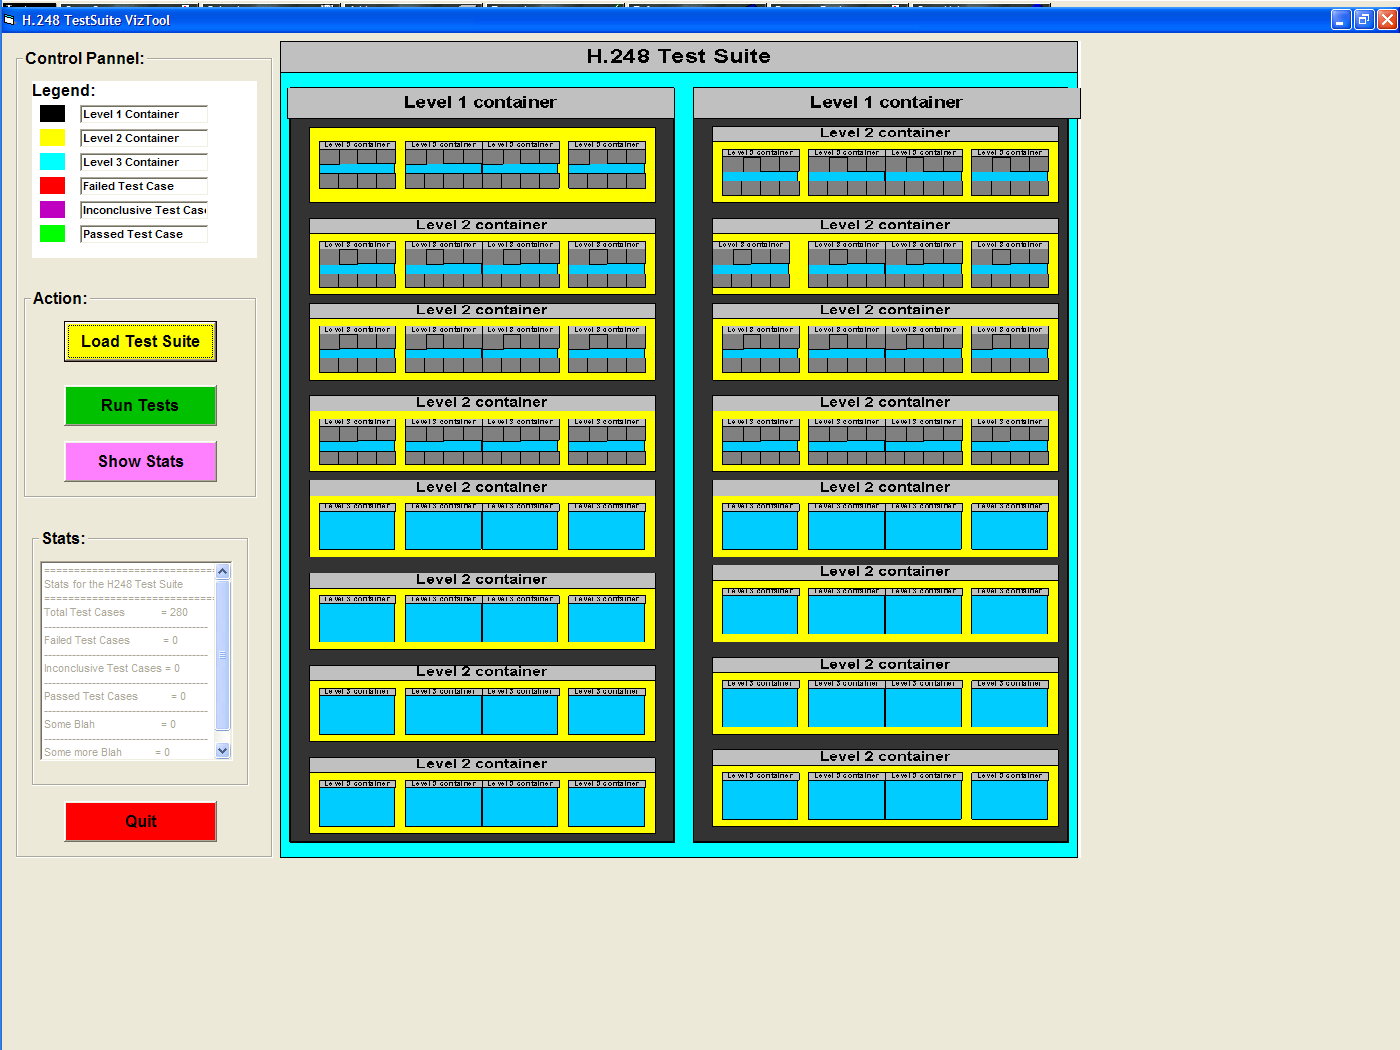
Our suggested visualization of the test suite's structure and results is based on the Matryoshka dolls principle (more about the dolls here). In particular, we propose using a series of recursively defined virtual shoe boxes, each holding one level of depth in the test suite. The boxes will have their cover removed, thus exposing their contents to the user. Furthermore, the boxes will see their physical size change, according to the following schema:
- before the test suite is ran, the tool will only show the suite's
structure, and as such, all groups and test cases are equal citizens,
and will benefit from the same amount of screen space.
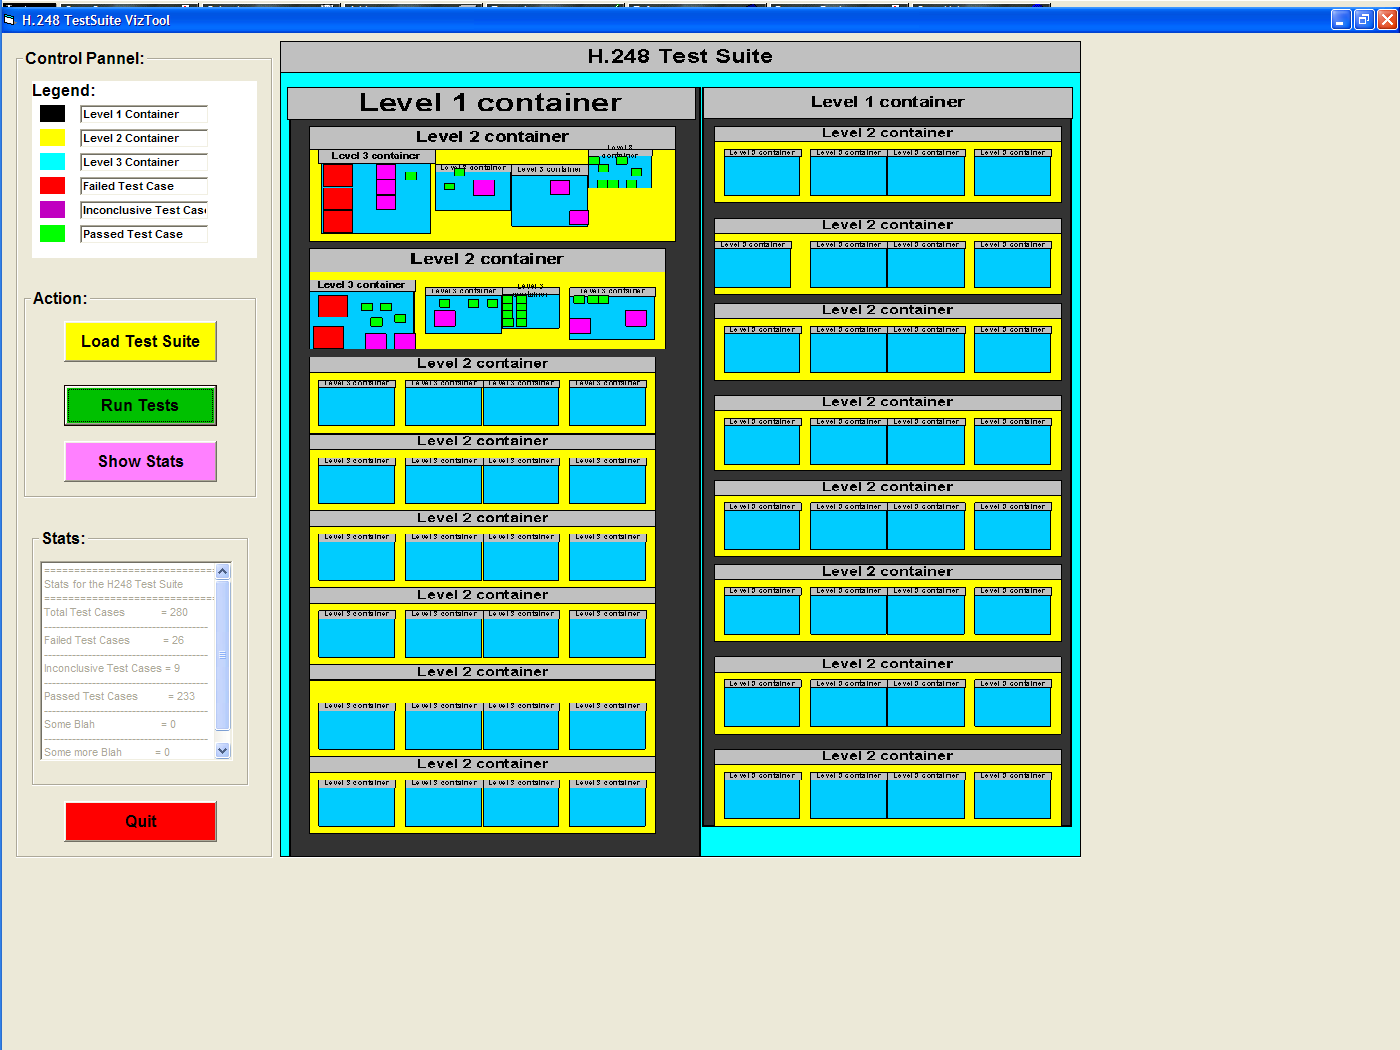
- once the test suite has finished running, the results will
determine the
size of each container box. For example, a group with numerous failed
test cases will be drawn significantly larger than a group with only a
couple of failed test cases, even if both groups are otherwise located
at the same depth in the test suite's inner structure. Furthermore,
this increase in size will be percolated through the groups' hierarchy
until the highest level is reached.
- the extra pixels required for this magnified representation will be substracted from the ones dedicated to other groups with few and/or unimportant failed cases -- which will consequently be drawn smaller than in the a priori view.
5. Scenario of Use:
Bob is a new UBC graduate just hired by the prestigious CRESCO Networks & Co networking equipment company. The company is heavily involved in producing the hardware required by the various North-American high-speed networks, and also produces the software required to run the resulting systems. Furthermore, the company is currently heavily involved in developing a new protocol for the next big thing in American digital communication: Voice over IP (VoIP).
In his entry level job, Bob is required to test prototype network-segments implementing the new VoIP protocol for the various vulnerabilities inferred by the senior (vulnerability testing) developing team. In particular, while the senior team is busy developing a novel, all encompassing VoIP vulnerability Test Suite, Bob must run an existing test suite (H.248), so that the team developing the actual networking protocol can progress as well.
In particular, today, Bob's manager (Martin, a guy known to be stiff on deadlines) asked Bob to test the latest VoIP protocol version (with the H.248 Test Suite) and to produce the following results by 4:00 PM:
- What is the group with the larger, and what is the group with the smaller number of test cases.
- What is the group with the larger, and what is the group with the smaller number of failed/inconclusive/passed test cases.
- Given that the H.248 Test Suite has two main branches, how balanced is the resulting tree? (i.e. in percentage points, what is the ratio of the failed/passed test cases for the two branches?)
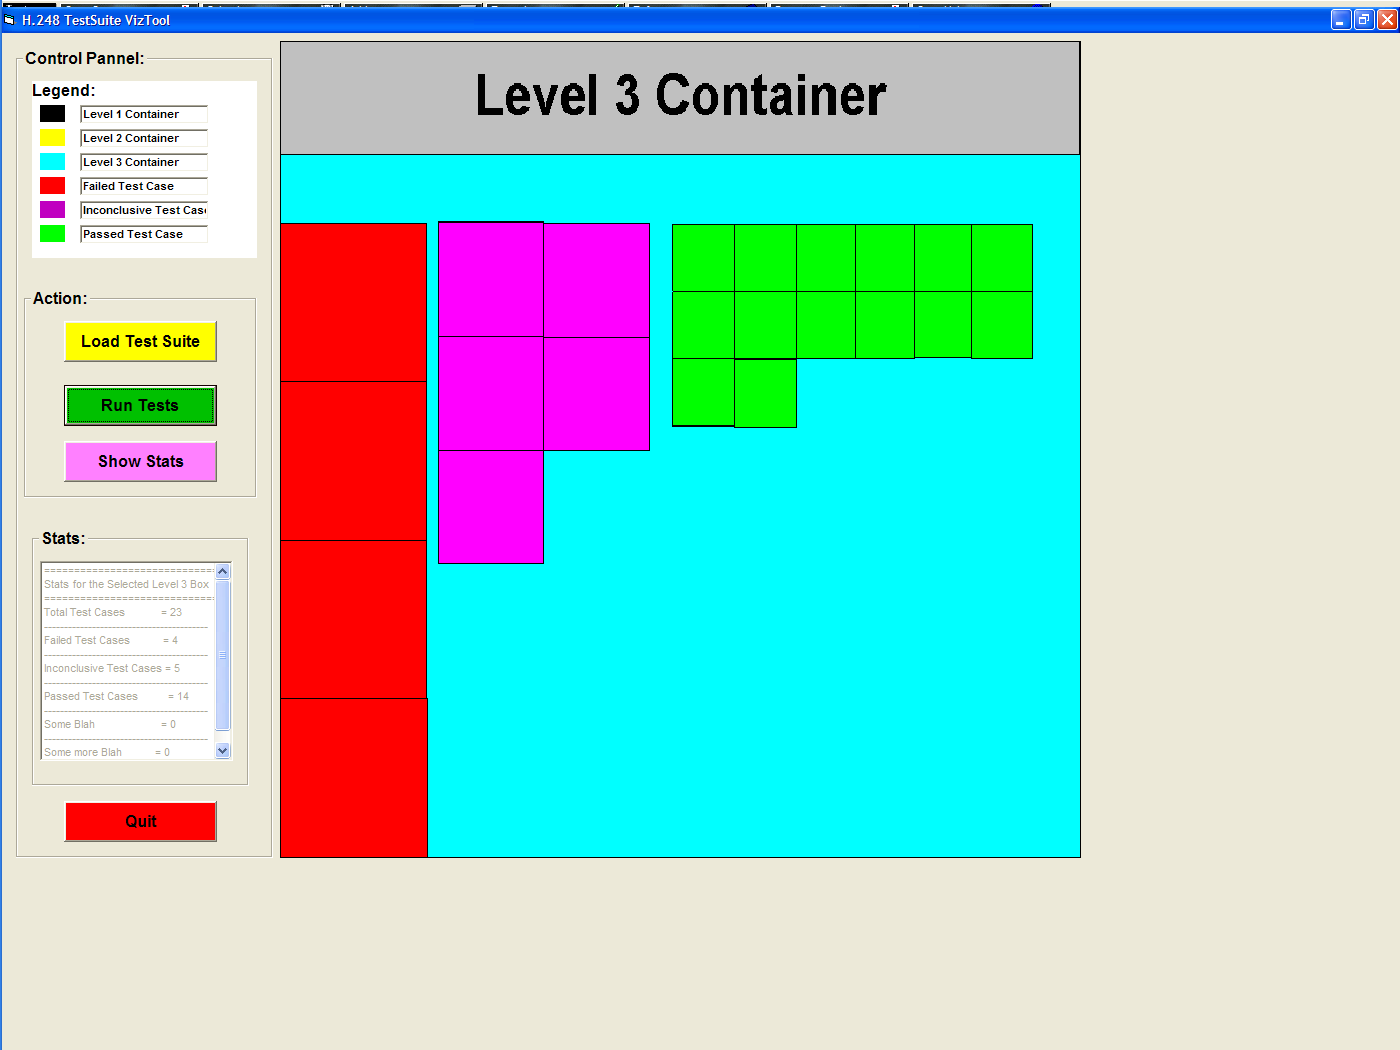
- For all inconclusive test cases in the MG group, find out the
ratio of Failed VS
Passed test events (a test event is the atomic component of a test
case; several test events compose a test case. A test case is
inconclusive when some test events pass, and some fail).
- What is the trouble area of the VoIP protocol, if any? (i.e. is
there
a specific concentration of failed cases in some specific group, or
adjacent groups of a branch?)
Note: to conform with reality, we remind the reader that H.248 is a conformance test suite (not a vulnerability one). It will be used as input for our project, until a vulnerability suite becomes available. Moreover, though the above is a hypothetical example, our tool is supposed to handle both types of test suites, and afford the same operations.
6. Proposed Implementation Approach:
We intend to use Java 2D for the backbone of our project, and Jazz as the zooming tool kit for our implementation. Should this fail, our other options are piccolo and the zvtm/zgr viewer.
7. Milestones:
| Implement Viz of Test Suite Structure |
| Implement
Viz of ran Test Suite, with appropriate color coding (Pass/Fail/Incomplete) |
| Modify
Previous, by implementing varying box sizes according to {important/numerous} failed test cases criteria |
| Implement
all of the above but with run time functionality (i.e. modify view as test progresses) |
| Implement
VizTool variant where up to 4 different products are tested with the
same Test Suite, and combined output is presented to user |
[March 01, 2004] [April 15, 2004]
-----------------------------------------------------------------------------------------------------------------------------------> (time)
8. References:
[1] http://www.cis.ohio-state.edu/~jain/cis788-99/ftp/voip_products/index.html
[2] http://www.ietf.org/internet-drafts/draft-ietf-idr-bgp-vuln-00.txt
[3] http://www.packetizer.com/iptel/h248/