Fengdong Du, fdu@cs.ubc.ca, Department of Computer Science, UBC
In this project, I plan to implement a visualization tool for classification rule mining tasks on multi-dimensional data. Here I am going to use the traditional decision tree algorithm, which is a simple algorithm and also yields good precision on predications. And in addition, it also gives us good reasoning in terms of a set of classification rules.
However, one problem for the decision tree algorithm is that before we run the algorithm, we don't know the goodness of the attributes in terms of their contribution to the final classification rules. Some of the attributes may be completely irrelevant to classifying our data. In practice, many classification rule mining products let the domain experts to decide whether an attribute is relevant or not. But obviously, it will be very useful if we could help those domain experts to judge the relevance rather than simply relying on their decision.
This is the main motivation of my proposal. I plan to implement an interactive interface that allows users choosing a subset of attributes to construct the classification rules. And the output of this subset of attributes will be compared with the actual class labels so that users can immediately know if this subset of attributes is good enough to generate classification rules.
In
addition, I plan to add some additional functionalities to help users to
view the data better, e.g. group by, sort by a particular attribute,
aggregation, abstraction. The interface will
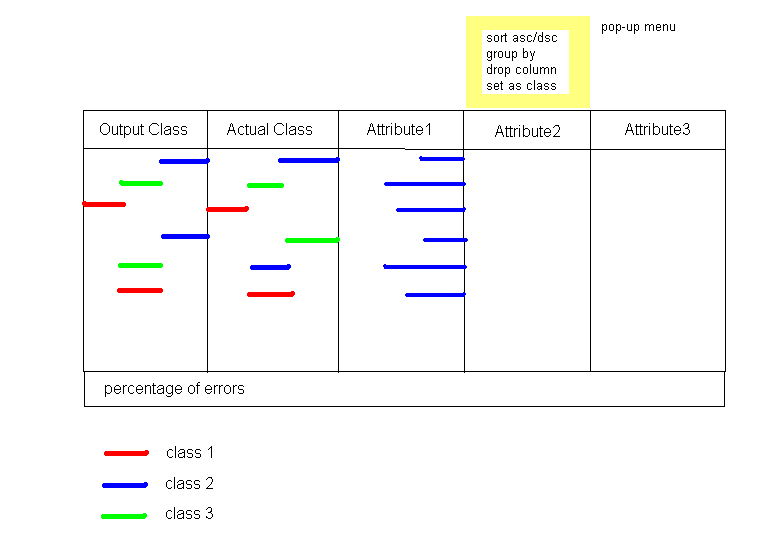
somehow looks like the table lens [1] interface.
But the leftmost two columns of my interface will be the output classes and the actual classes.

The main graphical view of my project could be something like above. The left most column is the output class labels generated by the classification mining algorithm. The next column is the actual class labels of the training data set. The rest columns are the attributes. Users can right-click an attribute to sort data tuples by this attribute, group by, drop this attribute or set this attribute as the class attribute. When an attribute is dropped, it does not participate generating the classification rules. When an attribute is set as class attribute, then the mining algorithm will generate class labels regarding this attribute.
In addition, there may be a tool bar above this view which allows users to do abstraction or aggregation, given some conditions. But this will be the nice-to-have features of my project.
Methodology and Implementation Plan:
To make it easy to demo, I am currently considering implement this project as Java Applet. I will use java Swing package to implement those graphical components. The final result will be posted in a web page.
|
[1] |
Table Lens, http://www.tablelens.com/ |