Metadata is standardized descriptive information. Things described may be electronic media or not, and metadata formats can vary widely across media and among different standards-setting organizations. Metadata is commonly stored in XML format, with the schema defined as a DTD file.
XML (eXtensible Markup Language) used as a format for data storage
has some advantages over traditional database formats. Probably the
features that have the most immediate application to metadata are (a)
that “field” lengths are not fixed, as they would be in a
traditional database; and (b) that “fields” may occur with
arbitrary multiplicity, and may even contain other fields. As a
concrete example, descriptive metadata for a book with multiple
authors might have several author
elements, and the title element might
have several instances if the book were translated into different
languages. This kind of flexibility is difficult to achieve with
fixed-schema, fixed-field database formats such as Machine-Readable
Cataloguing (MARC).
The author became exposed to XML-expressed metadata through association with a project at UBC to develop an online repository of metadata for “Learning Objects.” Learning Objects can be thought of as general teaching resources such as lesson plans, or multimedia presentations, or references to Web sites that might be used in an educational context. The descriptive standard used is CanCore, which has 56 elements, 41 of which contain data. The requirements specification of the repository included searching and browsing of learning objects. An advanced user might want to search the repository on any of the 41 data-containing elements, which presents a problem for a Web-based interface: a search form with 41 fields and associated buttons and modification fields (to handle date ranges, etc.) would be challenging to design in such a way that a user would not be daunted. This is the motivation for the course project described here.
As no sizeable source of learning object metadata was available for use to develop and test a browser with, a decision was made to substitute other sources of data. Initially, plain-text documents were parsed into sentences and descriptive data was generated based on sentence length, patterns of punctuation, vowel density, etc. to form a multidimensional data set. This was not, however, a very realistic use case, so the application was changed to accept an XML description of a filesystem supplied as test data for the InfoVis 2003 Contest, presented by the IEEE Symposium on Information Visualization. This filesystem produced approximately 3,000 descriptions with ten descriptive dimensions. The project described here is an attempt at a novel method to browse the data contained in this set.
The current project draws on concepts from three fields of infovis: document collections, multidimensional visualization, and dynamic queries.
The simplest analogy for the multidimensional search is Internet search engines. Searching for records that satisfy some (possibly complex) query is not a novel problem. It is in the presentation of search results, especially with some degree of ranking based on relevance to the original search, that different interfaces have differing degrees of success. Google presents a limited (single field) interface, but despite this is widely respected as giving generally highly relevant search results. Google's Advanced Search presents nine data-related fields and several other search-modifying (inclusion, exclusion, filtering) fields. Other more adventurous efforts have been made by Kartoo, which presents the results of a meta-search in graphical form, connecting various results with paths which may be interacted with in order to change the search query.
Other work such as Galaxies and ThemeView create visualizations based on similarities among many documents. Themes are identified and used to aggregate documents together in a graphical representation. In relation to this project, however, the actual content of a learning object is not available: only its metadata description. Nevertheless, the Galaxies approach provided most of the inspiration for this project.
Visualizing multidimensional data sets has been addressed by VisDB (Keim 1994) and Hierarchical Parallel Coordinates (Fua 1999). These approaches attempt to retain the multidimensionality of the data while presenting an understandable display, with debatable success.
The notion of “browsing” to locate relevant data is somewhat counterintuitive, since people who intend to locate specific information typically know the keywords describing what they are looking for. Perhaps this is why Internet search engines are not so proficient at “related sites” search results (often these “related sites” are paid links, or are simply the result of a search restricted to the domain of the initial site). However, it is interesting to note that humans browse constantly: even when using a specific search on a given search engine, any more than a page of results will put a person into “browse” mode, scanning through the results to find relevant sites (and their interest may actually be diverted by a perhaps irrelevant result – serendipity plays an important role in discovering information). At the same time, also consider that while browsing through a page of search results for relevant results, a user scans for specific visual triggers – the keywords, again – of which a person can retain only a few in mind while performing the scan. These two notions: browsing through specific results, and limited “triggers” for finding relevant results in a result set, led to the solution presented here.
The solution “collapses” all available descriptive dimensions into one numeric “similarity” measure. The method of the “collapsing” is where the strength of this visualization comes from: the user is able to specify what method of similarity calculation is done on each dimension (for example, “strictly less than”, “near”, “begins with”) and is also able to assign a weight (“importance”) to each dimension. This specification affects the calculation of the similarity measure. A marker for each object in the collection is then generated on the screen at a distance from the centre corresponding to its similarity measure.
The display is dynamic: weights may be adjusted and the display will change in response. Interacting with the markers on the display will change the focused (central) object, or display detailed information about a given object. The user may create a “prototype” object by filling in fields for one or all dimensions and then searching for objects similar to the prototype.
The application is written in Java, using the JDOM XML tools and the Swing graphics library. The choice to use Java was made so as to ease the application's integration into a Web page for the previously mentioned Learning Object repository project.
Once specified, the filesystem statistics data set is parsed and inserted into a data structure. The controller is initialized (arbitrarily) with the first object in the data set, and the browser is brought up in a separate window. Changes to the weight sliders produces change in the browser, and changing the focused object in the browser will update the fields shown in the controller window. This is achieved with basic inter-process communication.
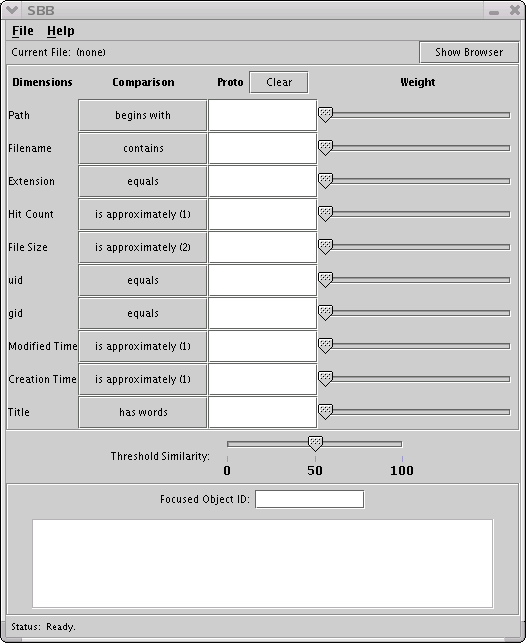
On starting the application, the user is presented with the “SBB” frame:
The dimensions are initialized from the internal data representation. This is an important feature to note, as it means that the schema can be changed easily. The Comparison buttons in the second column rotate through the available comparison options, which will vary according to the dimension's data type. There are two versions of “approximately” for numeric types: the first is based on Gaussian distribution curve, while the second is based on the absolute difference between the two numbers, divided by their sum. The third column, “Proto,” will show the data fields of the current object, and the column of sliders on the right are used to give the dimensions' relative weights. The sliders are initially set to zero. Any dimension with a blank “Proto” field or zeroed weight slider does not affect the similarity calculation.
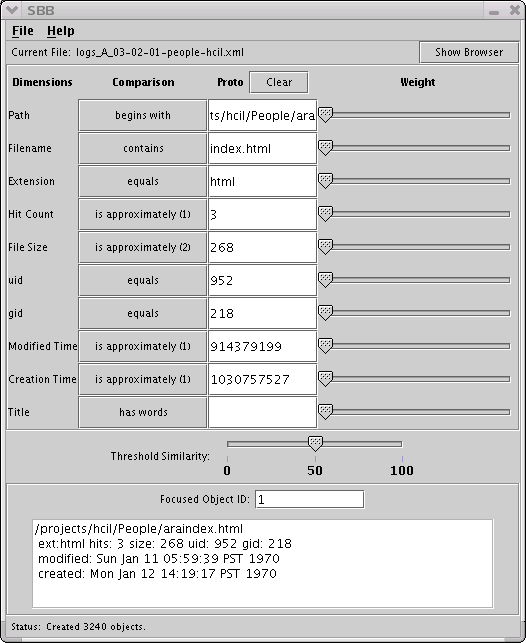
Use File -> Open to select the input data file. The supplied file, “logs_A_03-02-01-people-hcil.xml” is a subset of the data set available from the InfoVis 2003 contest page mentioned in the Problem Description (the data used here is a subset of the original because the SAXBuilder contained in the JDOM utility ran out of memory with the original file).
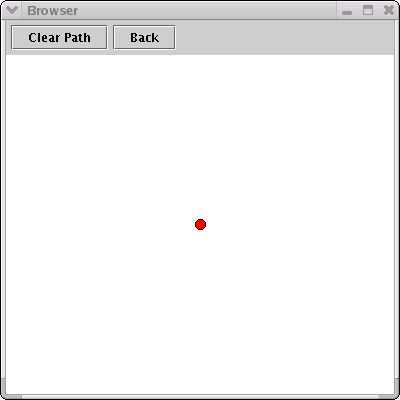
On moving a couple of sliders, the Browser window becomes more interesting:
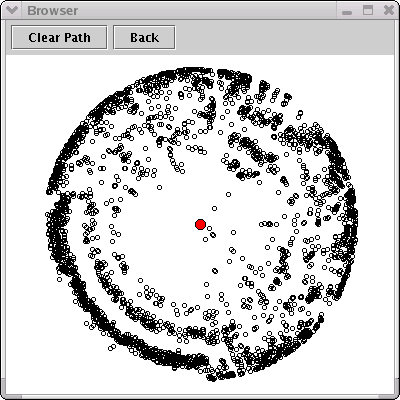
A static display does not really convey the value of the Browser window. Each movement of a slider results in movement of the markers: radial movement for changes in the similarity value, and concentric motion according to whether markers are being included or excluded from the image. The drawing algorithm does not show markers for objects with a similarity measure less than the 'percentage' indicated by the Threshold Similarity slider. For the remaining markers, the angle counterclockwise from East is determined proportionally by its position in the list of markers to be drawn.
“Hovering” the mouse over a marker in the Browser will cause a tool tip to appear with the signified object's detailed information.
Double-clicking on a marker in the Browser will change the focused object, and the displays will update accordingly. Alternatively, a specific object index number may be typed into the Focused Object ID field to change the focus.
A Prototype object can be specified by typing “0” in the Focused Object ID and changing the fields directly. Moving the sliders will then show the relations between the whole collection of objects and the prototype. This is a way that a search can be performed with the same interface. The focused object indicator in the Browser will turn yellow to remind the user that a Prototype browse is in effect.
The application is available as sbb.tar.gz or sbb.zip.
This project has been very fruitful for the author, who until this project was undertaken had not done any significant graphics or GUI programming in Java, nor used an XML parser. The amount of time invested in developing and debugging here will doubtless be deducted from projects undertaken in the future.
As an achievement in the field of information visualization, the result is debatable. It remains to be seen whether this sort of visualization will be useful when used with “real” data of the sort intended to be used by this application. Certainly the compression of ten dimensions of data onto one radial dimension results in a loss of information, but the dynamic aspect – changing a slider's position and seeing the immediate motion of a marker that is sensitive to that slider's dimension – might counter that loss.
Even if this visualization is not particularly useful for its intended purpose, it may find application elsewhere. It would be interesting to see how this method of finding objects would compare to other methods of browsing. Certainly people who have experimented with the application while it was under development enjoyed the interactive aspect, but use of the interface to solve particular search problems has not been investigated.
Canadian Core Learning Resource Metadata Application Profile (2003) CanCore.
http://www.cancore.org/
Kartoo. (2003)
http://www.kartoo.com/
Kriegel, H.-P., Keim, D.A., Ankerst, A., and Porada, J. (1996) VisDB: A Visual Data Mining and Database Exploration System. Database Systems Research Group, Institute of Computer Science, University of Munich.
http://www.dbs.informatik.uni-muenchen.de/dbs/projekt/visdb/visdb.html
Library of Congress (2002) MARC Standards.
http://www.loc.gov/marc/
IEEE Symposium on Information Visualization. (2003) InfoVis 2003 Contest: Visualization and Pair Wise Comparison of Trees.
http://www.cs.umd.edu/hcil/iv03contest/
Google. (2003)
http://www.google.com/
Pacific Northwest National Laboratory. PNNL Infoviz.
http://www.pnl.gov/infoviz/technologies.html
Fua, Y.-H., Ward, M.O., and Rundensteiner, E.A. (1999). Hierarchical Parallel Coordinates for Exploration of Large Datasets.
http://davis.wpi.edu/~xmdv/docs/vis99_HPC.pdf
Turner, J. (2003) MetaMap.
http://mapageweb.umontreal.ca/turner/meta/english/index.html