prettyPlot
By Mark
Schmidt
(2012)
Last updated 18 Nov 2013.
Summary
The prettyPlot function is a simple wrapper to Matlab's plot function for quickly making nicer-looking plots. The first version of the function was based on some tips given in this article, but my version of the function has evolved a lot since 2007 and I thought that others might find the current version useful.
Here are the features:
- Made the default line styles bigger, and the default fonts nicer.
- Options are passed as a structure, instead of through plot's large number of different functions.
- You can pass in cell arrays to have lines of different lengths.
- You can pass an n*3 matrix of colors, and cell arrays of line-styles and/or markers. It will cycle through the given choices.
- All markers are placed on top of (all) lines, you do not have to put a marker on every data point, and you can use different spacing between markers for different lines.
- You can change only the upper or lower x-limit (y-limit), rather than having to specify both.
- There is a heuristic to place labels directly on the line instead of in a legend.
- There is some support for making nicer-looking error lines/areas.
Download and Examples
To use the code, download and
unzip prettyPlot.zip.
Once this is done, type the following in Matlab:
>> cd prettyPlot % Change to the unzipped directory
>> prettyPlot % Shows the defaults options
>> example_prettyPlot % Shows basic functionality, including placing markers at uneven points.
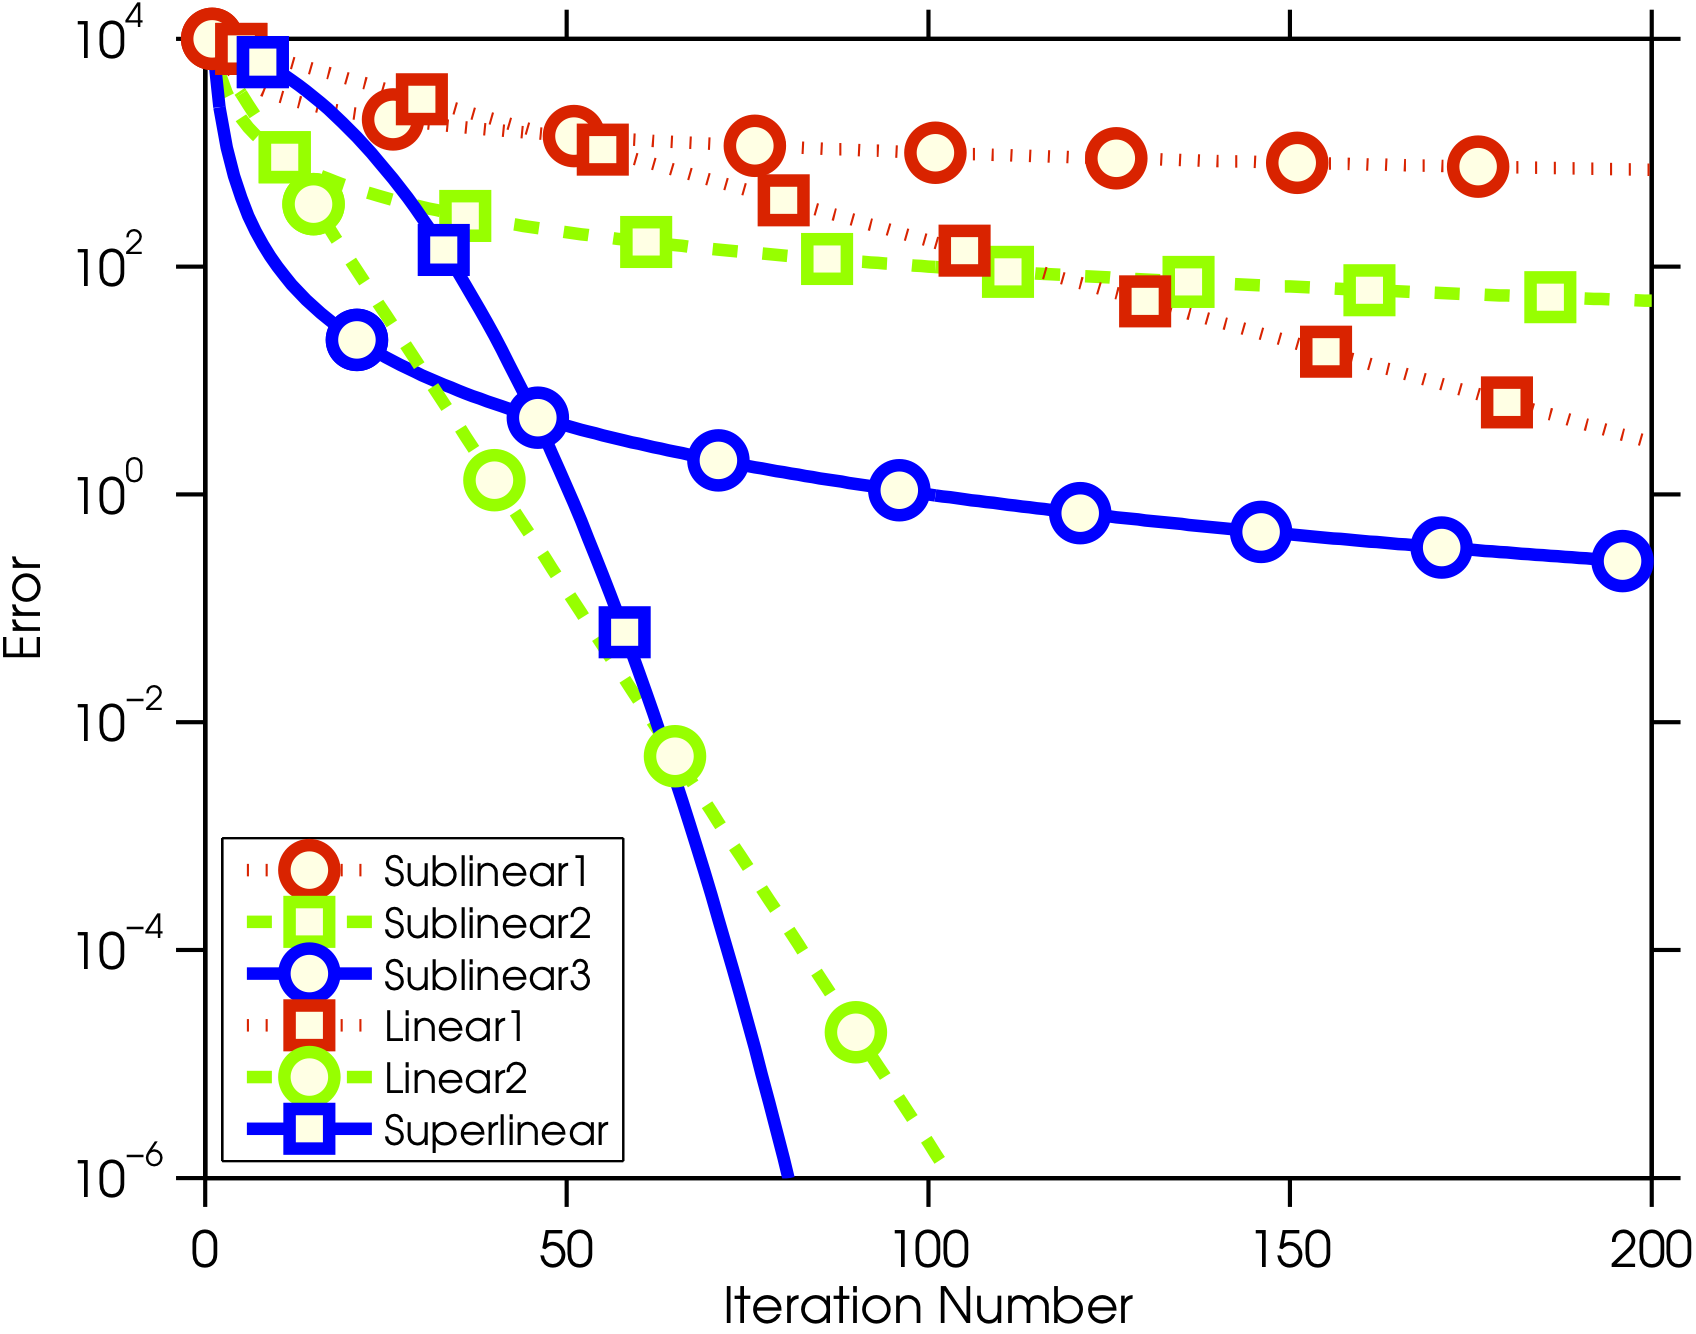
>> example_prettyPlot2 % Shows using lines of different lenghts, repeating sequences of lineStyles/markers/colors, and having unspecified upper/lower limts.
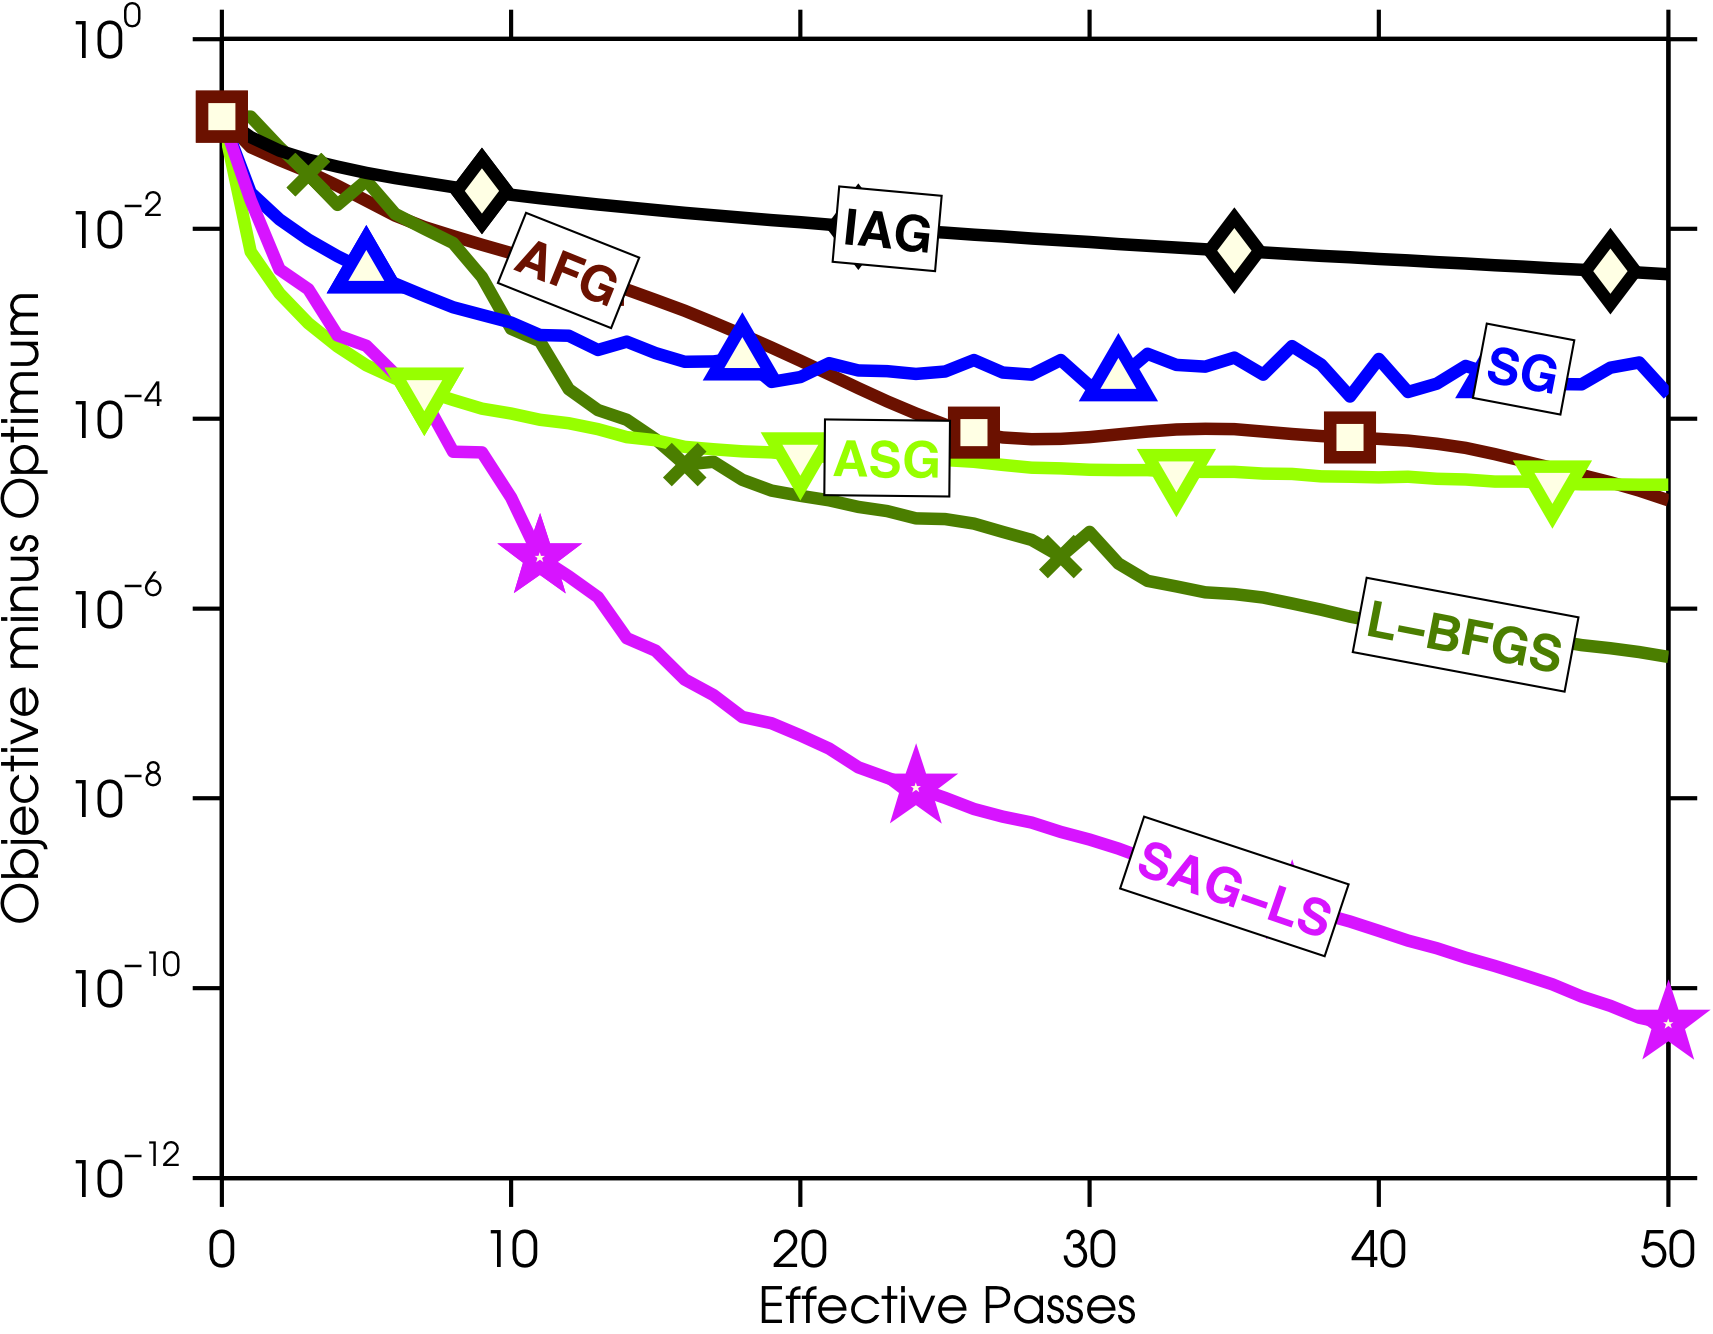
>> example_prettyPlot3 % Shows how to label lines.
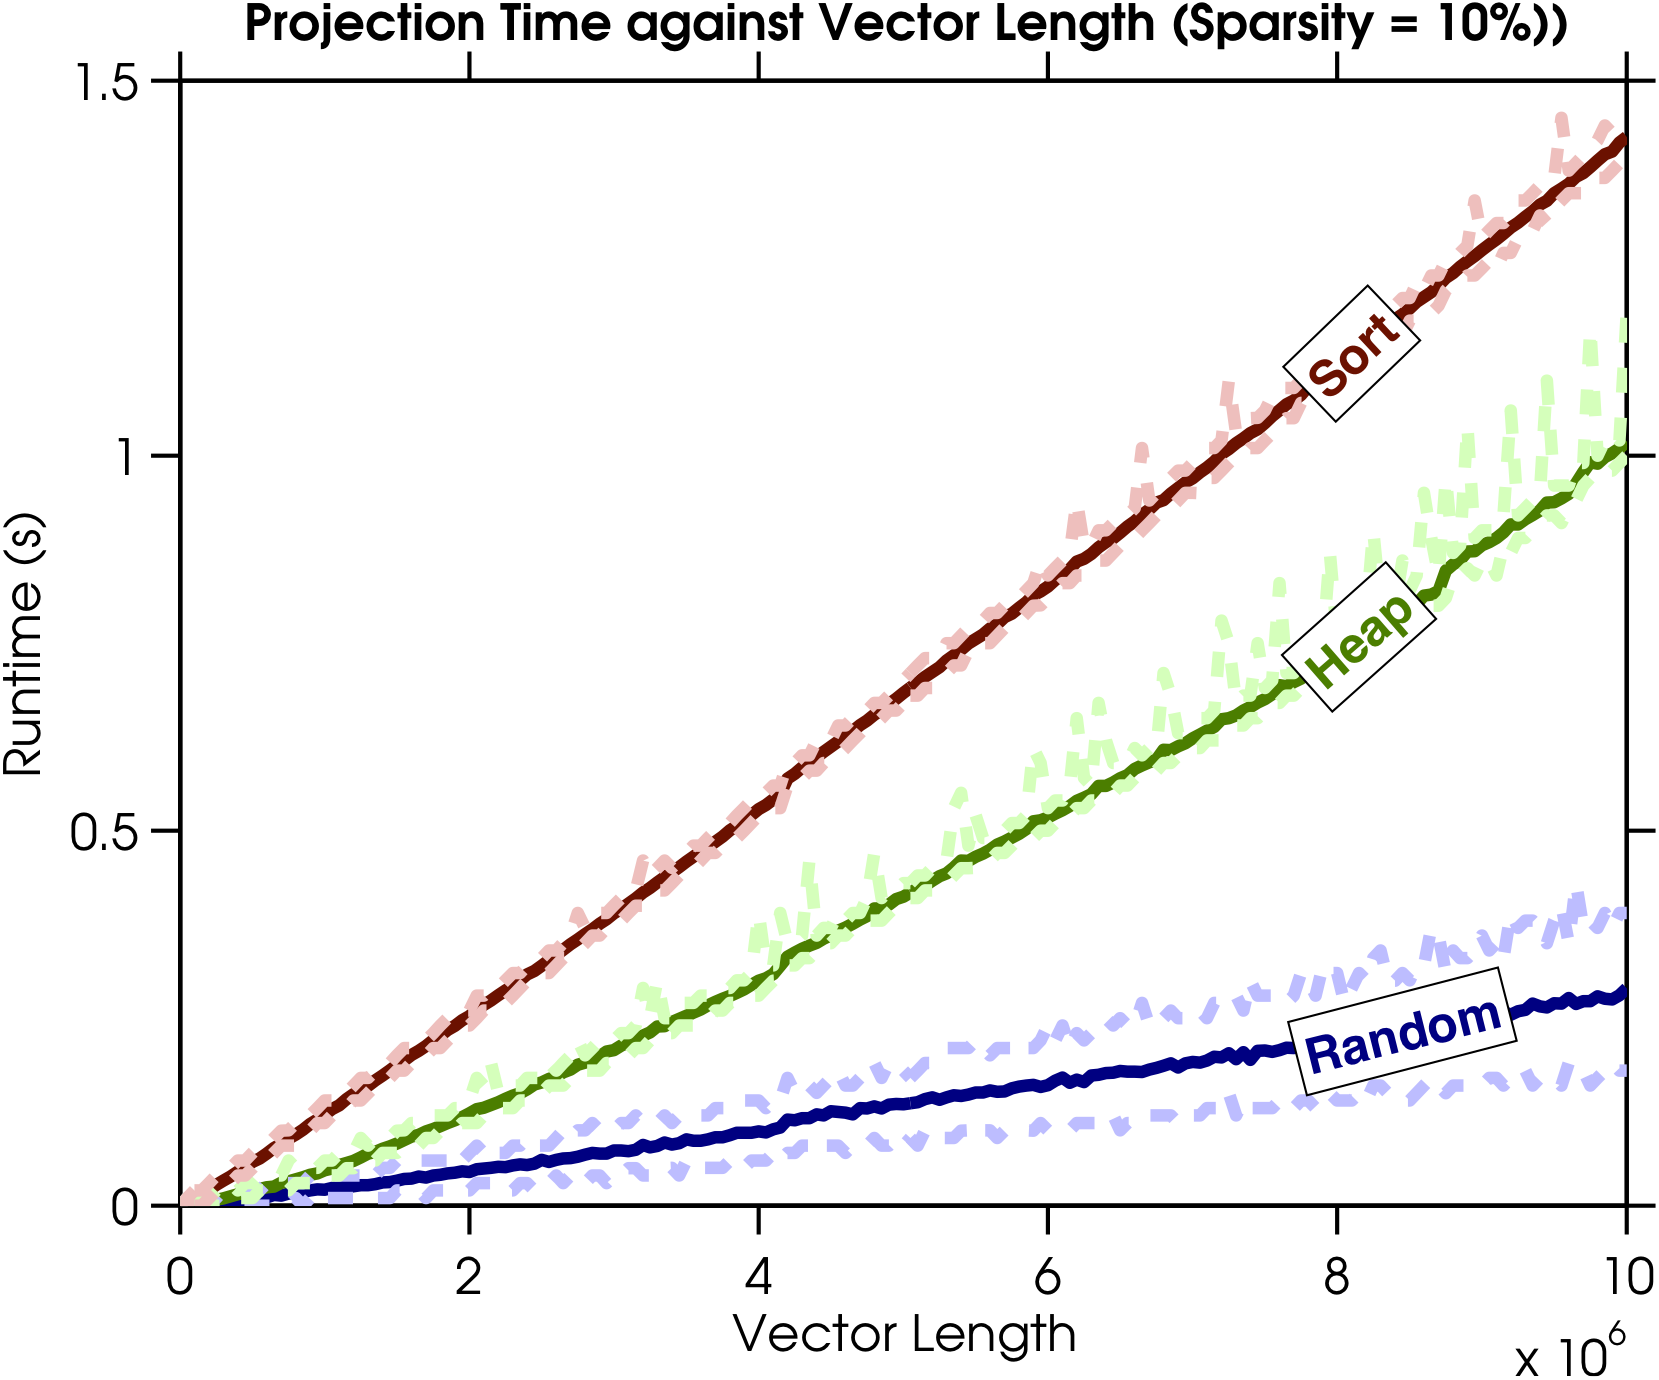
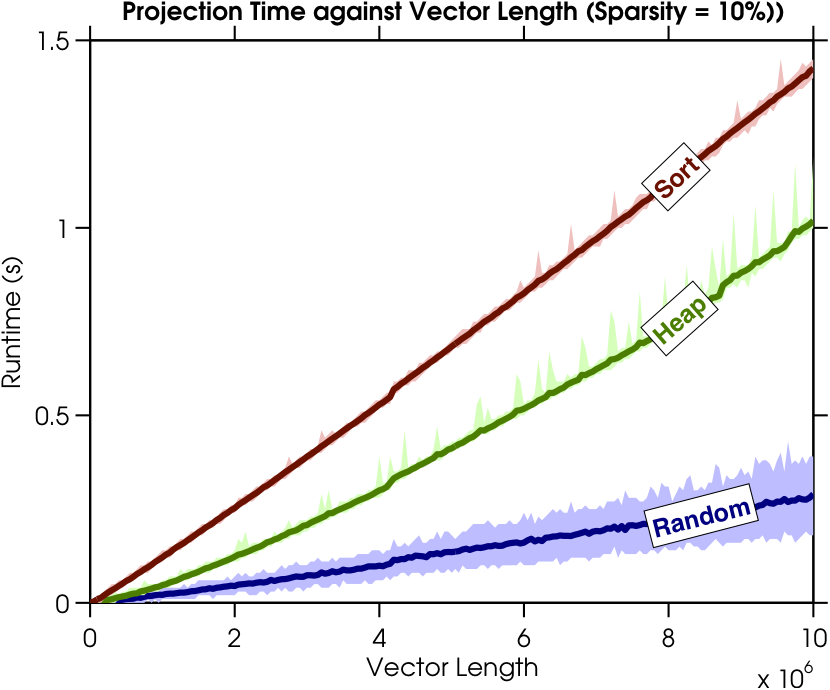
>> example_prettyPlot4 % Shows how to plot upper/lower error lines/surfaces.
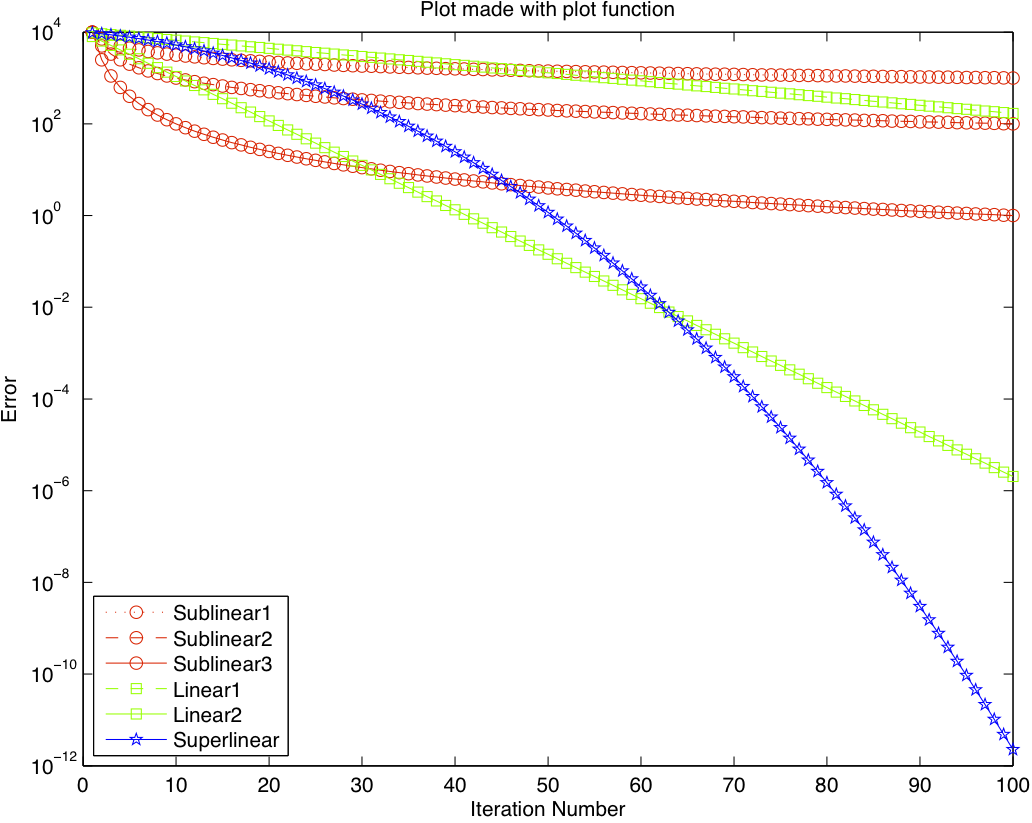
Typing the above commands will run demos showing how to access the various features available, and makes the plots below:
example_prettyPlot

example_prettyPlot2
example_prettyPlot3
example_prettyPlot4
Mark Schmidt > Software > prettyPlot