Description of demo_unsupervised_PCA_FactorAnalysis.m
Demonstrates usage of PCA on synthetic data and shows Factor Analysis and PCA on a real dataset
Contents
Principle Component Analysis on Synthetic Data
clear all
close all
f=1;
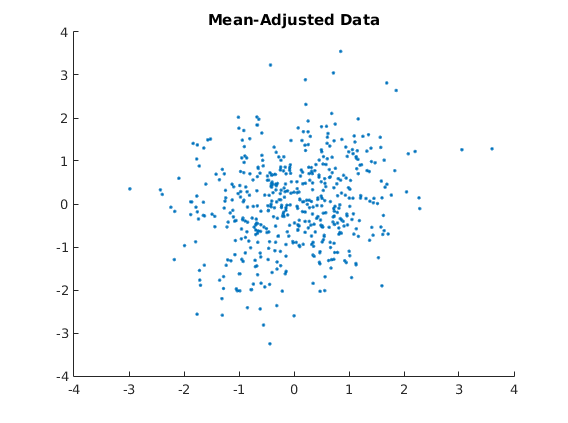
Generate synthetic data
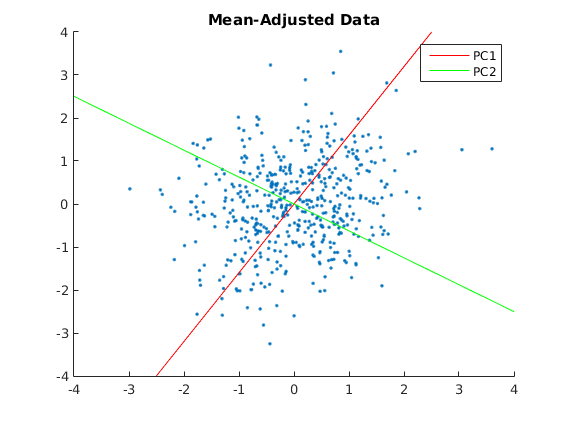
x1 = randn(500,1);
x1 = x1-mean(x1);
x2 = randn*x1 + randn(500,1);
x2 = x2-mean(x2);

figure(f);clf;hold on;f=f+1;
plot(x1,x2,'.');
title('Mean-Adjusted Data');
xl = xlim;
yl = ylim;
xl(1) = min(xl(1),yl(1));
xl(2) = max(xl(2),yl(2));
xlim(xl);
ylim(yl);

X = [x1 x2];
[n,p] = size(X);

C = (1/n)*X'*X;
[U,S,V] = svd(C);
Plot Principal Components
m1 = V(2,1)/V(1,1);
m2 = V(2,2)/V(1,2);
h1 = plot([xl(1) xl(2)],[xl(1)*m1 xl(2)*m1],'r');
h2 = plot([xl(1) xl(2)],[xl(1)*m2 xl(2)*m2],'g');
legend([h1 h2],'PC1','PC2');
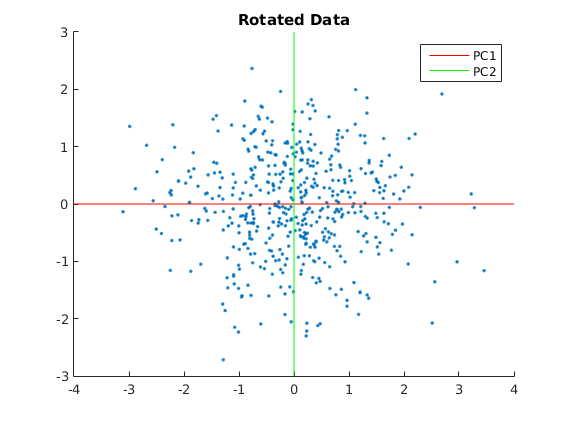
Plot Projected Data
Xp = X*V;
figure(f);clf;hold on; f=f+1;
plot(Xp(:,1),Xp(:,2),'.');
title('Rotated Data');
h3 = hline(0,'r');
h4 = vline(0,'g');
legend([h3 h4],'PC1','PC2');
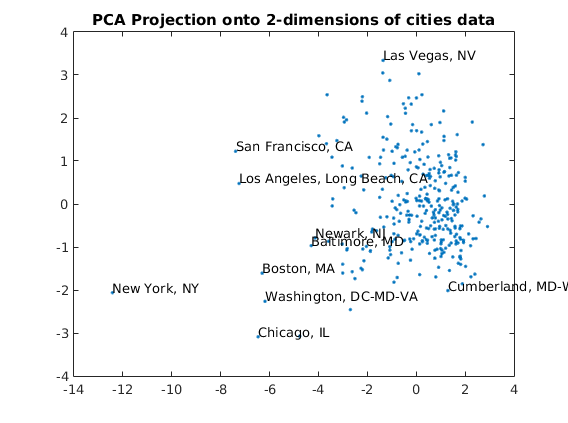
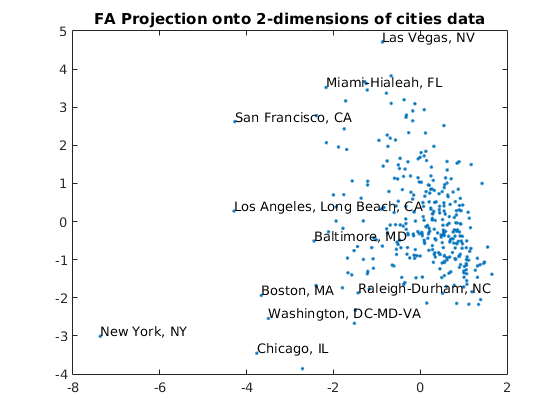
PCA & Factor Analysis on 9-D quality of life ratings for U.S. Cities
 load cities.mat
 X = ratings;

% Reduce to 2-dimensions with PCA
options = struct('maxComponents',2);
model = ml_unsupervised_dimRedPCA(X,options);
Xreduced = model.reduceFunc(model,X);
figure(f);f=f+1;
plot(Xreduced(:,1),Xreduced(:,2),'.');
title('PCA Projection onto 2-dimensions of cities data');
gname(names)

% Reduce to 2-dimensions with FA
options = struct('nComponents',2);
model = ml_unsupervised_dimRedFA(X,options);
Xreduced = model.reduceFunc(model,X);
figure(f);f=f+1;
plot(Xreduced(:,1),Xreduced(:,2),'.');
title('FA Projection onto 2-dimensions of cities data');
gname(names)
Number of Components selected: 2
Variance explained by basis: 0.51