Contents
Description of demo_regression_outliers.m
Demonstrates varying robustness of different distributions and loss functions to outliers
clear all
close all
load outliersData.mat
usage of L2 regression
options_l2 = [];
options_l2.addBias = 1;
model_l2 = ml_regression_L2(Xtrain, ytrain, options_l2);
yhat_l2 = model_l2.predict(model_l2, Xtest);
testError_l2 = mean(abs(yhat_l2 - ytest));
fprintf('Averaged absolute test error with %s is: %.3f\n', model_l2.name, testError_l2);
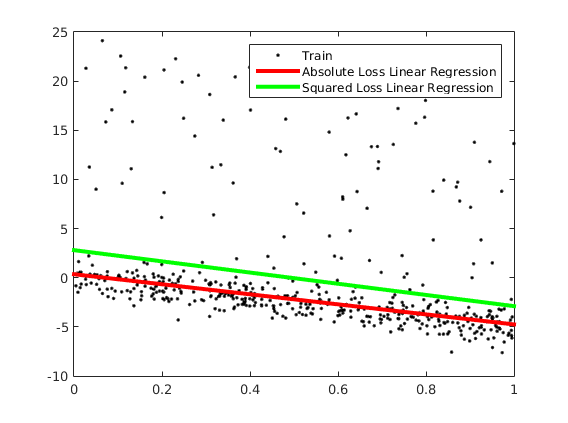
Averaged absolute test error with Squared Loss Linear Regression is: 2.499
usage of L1 regression
options_l1 = [];
options_l1.addBias = 1;
model_l1 = ml_regression_L1(Xtrain, ytrain, options_l1);
yhat_l1 = model_l1.predict(model_l1, Xtest);
testError_l1 = mean(abs(yhat_l1 - ytest));
fprintf('Averaged absolute test error with %s is: %.3f\n', model_l1.name, testError_l1);
Averaged absolute test error with Absolute Loss Linear Regression is: 0.875
plotRegression1D(Xtrain, ytrain, model_l1, model_l2)
usage of Huber regression with 0.9 epsilon
options_hb2 = [];
options_hb2.addBias = 1;
options_hb2.epsilon = 0.9;
model_hb2 = ml_regression_Huber(Xtrain, ytrain, options_hb2);
yhat_hb2 = model_hb2.predict(model_hb2, Xtest);
testError_hb2 = mean(abs(yhat_hb2 - ytest));
fprintf('Averaged absolute test error with %s is: %.3f\n', model_hb2.name, testError_hb2);
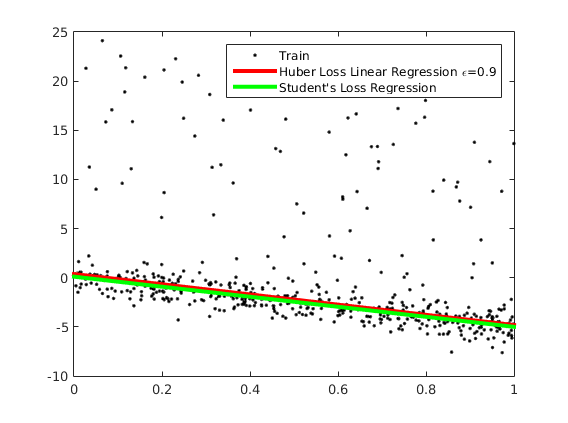
Averaged absolute test error with Huber Loss Linear Regression \epsilon=0.9 is: 0.869
usage of Student's t-distribution regression
options_stu = [];
options_stu.addBias = 1;
model_stu = ml_regression_student(Xtrain, ytrain, options_stu);
yhat_stu = model_stu.predict(model_stu, Xtest);
testError_stu = mean(abs(yhat_stu - ytest));
fprintf('Averaged absolute test error with %s is: %.3f\n', model_stu.name, testError_stu);
Averaged absolute test error with Student's Loss Regression is: 0.825
plotRegression1D(Xtrain, ytrain, model_hb2, model_stu);