DCG: Modeling Discrete Interventional Data using Directed Cyclic Graphical Models
By Mark
Schmidt and
Kevin Murphy (2009)
Last updated 10 October 2010.
Summary
DCG implements a method for modeling interventional (experimentally-controlled) data using cyclic graphical models. Similar to undirected models, it represents the probability distribution of the data as a product of unnormalized potentials. But similar to directed acyclic models, we define a new distribution when variable(s) are being controlled by intervention by removing the appropriate factors from the model.
The DCG method is described in the following paper:
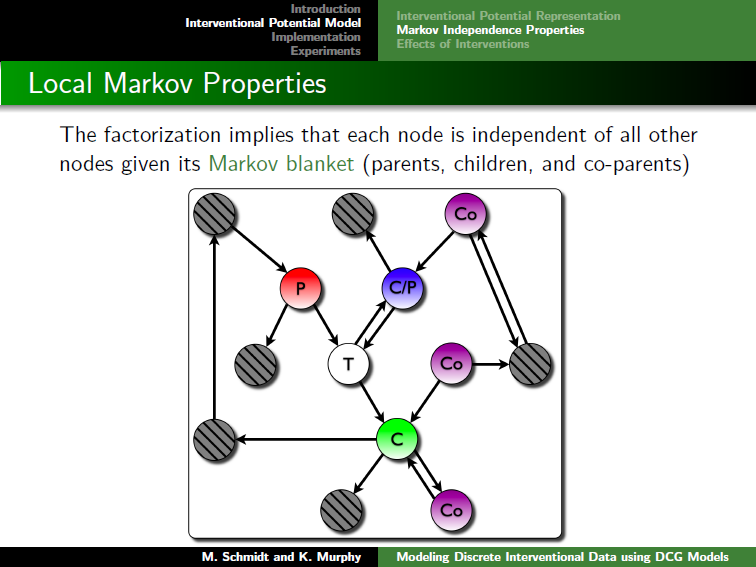
Clicking on the image below opens the slides of a talk giving motivation for the model, a description of the model and its properties, and experimental results:
The code uses brute-force enumeration for tasks such as computing marginals and sampling, so these operations will only be tractable when the number of variables (and discrete states for each variable) is relatively small. The code also restricts attention to pairwise dependencies.
Download and Examples
To use the code, download and unzip DCG.zip. Then, in Matlab, type:
>> cd DCG                % Change to the relevant directory
>> addpath(genpath(pwd)) % Add all sub-directories to the Matlab path
>> mexAll                % Compile mex files (not necessary on all systems)
>> example_DCG           % Run a simple demo
Typing the above commands will run a simple demo, showing how to use the code for the following tasks:
- Initializing the edgeEnds structure that describes the graph.
- Initializing the parameter vector.
- Evaluating the potential of a configuration.
- Computing the normalizing constant.
- Evaluating the probability of a configuration.
- Compute node and edge marginals.
- Generating samples from the model.
- Computing the negative log-likelihood of an observational data set.
- Maximum likelihood estimation given observational data.
- Computing the negative log-likelihood of an interventional data set.
- Maximum likelihood estimation given interventional data (and the targets of intervention).
This demo serves as the documentation for the code package. If the functionality of the code is not clear you may want to the look at the UGM package, that has a similar structure but more extensive documentation. Otherwise, feel free to e-mail me about any questions.
Reproducing the Paper Results
The function 'DCGexp' lets you replicate the results from the paper.
To reproduce the results on one instance of the synthetic data for the UG-observe, UG-condition, and DCG models you can run:
>> DCGexp('DCG',1000,10,2,0)
Due to the use of brute-force inference, it may take a few minutes for this to finish.
To obtain the results with the nine other synethetic data sets, you can change the last argument (the random seed) to the values 1 through 9.
To reproduce the other results in the paper, you will also need to download Daniel Eaton's BDAGL package and add this to the path. To reproduce the synthetic results with the DAG model included, run:
>> DCGexp('DCG',1000,10,2,0,1)
Note that this takes substantially longer because of the need to search over orderings.
Given the BDAGL package, you can reproduce the flow cytometry experiments with the three undirected models using (with the seed varying from 0:9):
>> DCGexp('Sachs',5400,11,3,0)
To include the DAG model, use:
>> DCGexp('Sachs',5400,11,3,0,1)
Extensions
In theory, it is possible to adapt any of the functionality present in the UGM package for use in DCG models. This includes things like using approximate inference to allow a larger number of variables, or including covariates and doing conditional parameter estimation to train a discriminative model. We can also consider non-pairwise versions of the DCG model, or other ways of defining interventions in undirected graphical models. I wrote up some thoughts on these topics in an informal note available here.
Mark Schmidt > Software > DCG