INTERESTING GRAPHIC DESIGNS - RELATIONAL SPACES - 23
Source: WWW site - carenini@cs.pitt.edu
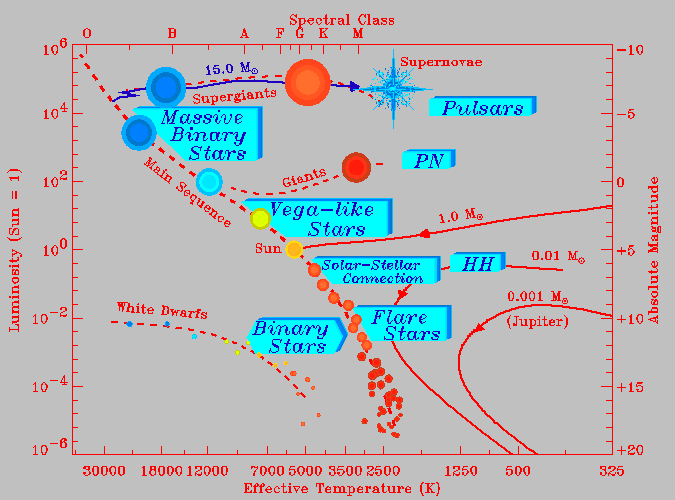
Astronomy: the HR-diagram is a common relational chart for studying stellar evolution. As time goes by, stars "move" from one region to another by following know paths depending on their initial mass.
Hertzsprung-Russell (HR) Diagram
The diagram below shows an example of an Hertzsprung-Russell (H-R) diagram. The first such diagram was plotted by Ejnar Hertzspung in 1911, and (independently) by Henry Norris Russell in 1913. It is a "two-dimensional" plot for the observed stars, and represents one of the greatest observational syntheses in astronomy and astrophysics!
