The Mylyn Usage History Editor.
This site provides a set of add-on plug-ins to the Mylyn Monitor, adding infrastructure for gathering and analyzing usage data from Eclipse-based experiments. The Mylyn Usage History Editor provides an Eclipse-based editor for reviewing the usage logs. The Workbench Parts Monitors provides a simple framework for monitoring user interactions with workbench parts that are oblivious to introspection (to varying degrees). Some example part monitors are provided. We've also included a simple example of an automated analysis.
To obtain these plug-ins, add the following URL to your Update Manager:
http://www.cs.ubc.ca/~bsd/research/expt-infra/
and fetch the Eclipse-Based Experiment Infrastructure feature. The plug-ins include their source code and are made available under the Eclipse Public License; to edit the source, import the plug-ins as projects with source folders. Please send any suggestions or changes to Brian de Alwis.
2008/06/12: The plugins have been updated to Eclipse SDK R3.3.2 and Mylyn R2.3. The older versions, against Eclipse R3.2 and Mylyn R2.0 are still available.
This document assumes you have some familiarity with the Mylyn Monitor. Some material can be found on the Mylyn Wiki.
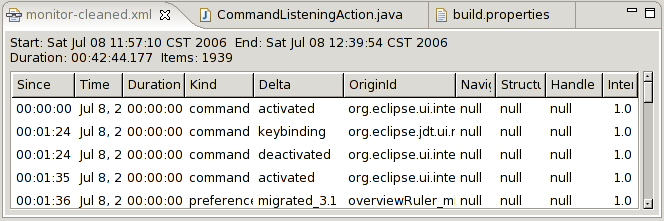
The Mylyn Usage History Editor (found in plug-in ca.ubc.cs.mylyn.monitor.usage.editor) provides an editor for monitor-history.xml files, and a property source for InteractionEvents (for use with the Properties View). The editor is intended for cleaning up usage files, such as trimming spurious events from the beginning and end of a session.
The Usage Editor assumes the monitor files are in your workspace and are named *.xml. This is easily done by creating a project and setting its location to the external directory.
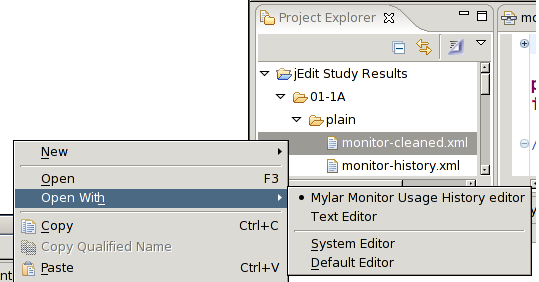
To open the editor, right-click on a monitor usage file (e.g., monitor-history.xml) select the editor from the Open With menu:
Known Issues: none, currently.
The Workbench Part Monitors Framework (found in plug-ins ca.ubc.cs.mylyn.monitors.parts and ca.ubc.cs.mylyn.monitors.parts.examples) provides a simple for monitoring user interactions with workbench parts (i.e., Eclipse editors and views) that are oblivious to introspection (to varying degrees). The framework manages the book-keeping for tracking the lifecycle of parts, such as when they are created or destroyed; the part monitor inserts hooks so as to describe the user interactions or changes as InteractionEvents for the Mylyn Monitor.
The ca.ubc.cs.mylyn.monitors.parts.examples plug-in provides the folllowing part monitors as examples:
The AbstractWorkbenchPartMonitor is the base class for workbench part monitors, providing infrastructure for listening for changes, obfuscating handles, and injecting the resulting InteractionEvents.
The framework itself spans two levels. At the lowest level of the framework is PartDispatcher, responsible for notifying of changes to particular workbench parts. Higher levels of the framework provide support for monitoring certain types of parts, such as text editors or parts using JFace's TreeViewer.
The PartDispatcher is a utility class for notifying of updates to particular types of workbench parts. Two types of updates are provided:
At a higher level in the framework are AbstractTextEditorMonitor and AbstractTreeViewerMonitor. AbstractTextEditorMonitor provide hooks for monitoring text editors. AbstractTreeViewerMonitor provide hooks for monitoring parts whose main widget is a tree viewer (TreeViewer).
AbstractTextEditorMonitor provides infrastructure for determining changes to the viewport (the visible content) of text editors, such as determiningly the lines added and removed. The line differences are described using instances of IntervalDifferences, such as LineRangeDifferences (which use JFace ILineRanges). The DefaultTextEditorViewportMonitor uses this setup to describe changes to the standard text editor.
AbstractTreeViewerMonitor provides infrastructure for determining changes to tree-viewer based parts. Instances are notified of branch expansions and contractions. The ConsoleScrollingMonitor is uses this setup to describe user-initiated scrolling of the console view.
AbstractModelBasedTextEditorMonitor enhances AbstractTextEditorMonitor by providing support for mapping lines to model elements. The JavaEditorViewportMonitor uses this setup to describe user-initiated changes to the viewport in the Java editors, including folding and unfolding.
A part monitor must be explicitly enabled to begin monitoring for changes. This is most easily accomplished using the Mylyn Monitor lifecycle notification (IMylynMonitorLifecycleListener) through code such as:
    MylynUsageMonitorPlugin.getDefault()
	.addMonitoringLifecycleListener(new DefaultTextEditorMonitor());
To install your part monitors on start-up, ensure your plug-in implements the Eclipse Startup protocol.
The ca.ubc.cs.mylyn.monitors.parts.examples's bundle activator will register the example monitors on start-up if the ca.ubc.cs.mylyn.monitors.parts.examples/startPartMonitors option is set to true.
Known Issues:
The example part monitors describe changes in their respective workbench parts as selection events, with the change details encoded as XML fragments in the event's delta field. The editor part monitors use a similar format, and the the explorer view part monitors use a similar format.
Although there is no requirement that your part monitors use this format, it is somewhat useful, and there is some support available for later parsing the format used by the text editors.
Eclipse describes an editor as providing a viewport on its contents. The two example editor monitors included use a similar format for describing editor changes.
The DefaultTextEditorViewportMonitor describes changes to the editor's viewable region. An example might be:
<interactionEvent>
<kind>selection</kind>
<!-- other tags elided -->
<originId>org.eclipse.ui.DefaultTextEditor</originId>
<structureKind>file</structureKind>
<structureHandle>/home/bsd/research/eclipse/workspace-monolith/Tools--WBSpies/build.properties</structureHandle>
<navigation>scrolling</navigation>
<delta><scrolling position="56,85x500,656" added="1 " removed="12 " visible="1:11 "/></delta>
<interestContribution>0.0</interestContribution>
</interactionEvent>
The additional description has been XML-encoded in the delta field; in the example above, the decoded value is:
<scrolling position="56,85x500,656" added="1 " removed="12 " visible="1:11 "/>
The scrolling is the type of delta: there are four types, which correspond to the navigation type:
All delta types have four attributes. The position records the region of the part's control in the form "X1,Y1xX2,Y2". The added and removed attributes report the change since the previously reported delta. The visible attribute summarizes what is currently visible. Each attribute reports a set of space-delimited numbers representing line ranges.
The example above describes that the editor was scrolled upwards by one line.
The XML deltas for changes to Java editors are similar to those from text editors, but adding more detail about the editor's underlying model, the JDT Java model:
<interactionEvent>
<kind>selection</kind>
<!-- other tags elided -->
<navigation>scrolling</navigation>
<delta><scrolling position="56,85x500,656" removed="23 " added="64 " visible="24:26 31:64 ">
<newlyVisibleElements>
<handle kind="java" lines="41:150">
=jEdit-4.1pre6/&lt;org.gjt.sp.jedit.options{LoadSaveOptionPane.java[LoadSaveOptionPane~_init
</handle>
</newlyVisibleElements>
</scrolling></delta>
</interactionEvent>
The delta, once decoded, is:
<scrolling position="56,85x500,656" removed="23 " added="64 " visible="24:26 31:64 ">
<newlyVisibleElements>
<handle kind="java" lines="41:150">
=jEdit-4.1pre6/<org.gjt.sp.jedit.options{LoadSaveOptionPane.java[LoadSaveOptionPane~_init
</handle>
</newlyVisibleElements>
</scrolling>
The delta is similar to that for text editors, but also reports the handles of the Java elements that became newly visible as a result of the scrolling (obtained from IJavaElement.getHandierIdentifier()). These handles are listed in the <newlyVisibleElements>...</newlyVisibleElements> tags. Each handle represents some domain-level element (the domain is contained in the kind attribute); the handle's lines attribute provides the line range containing the elements definition. This report is a true delta from the previously reported changes, as the elements which are currently visible should be obtained from the previous reports.
The example above reports that a part was scrolled down by one line, with line 23 disappearing, line 64 newly appearing, and the net result being lines 24 through 26 and 31 through 64 are currently visible. The scrolling revealed more of an element (from its lines attribute, we can determine that part of the definition was previously visible).
As it may be useful to process the editor changes at a later time, we have included a class ca.ubc.cs.mylyn.monitors.parts.analysis.ViewportPayload that is capable of interpreting the contents of the XML deltas described above. An example of its use is:
void process(InteractionEvent event) {
   if(!event.getDelta().startsWith("<") ||
	 !(event.getOriginId().equals(JavaUI.ID_CF_EDITOR) ||
	 event.getOriginId().equals(JavaUI.ID_CU_EDITOR))) {
      return;
   }
   String delta = event.getDelta();
   ViewportPayload vp = ViewportPayload.load(delta);
   for(String handle[] : vp.getHandles().keySet()) {
      visibleElements.add(handle[0] + ":" + handle[1]);
   }
}
The XML deltas for the Project and Package Explorers describe branch expansions and collapses in their trees. For example:
<interactionEvent>
<kind>selection</kind>
<!-- other tags elided -->
<originId>org.eclipse.ui.navigator.ProjectExplorer</originId>
<structureKind>file</structureKind>
<structureHandle>/Workbench Spies/icons</structureHandle>
<navigation>treeCollapsed</navigation>
<delta><treeExpanded position="56,85x500,656">
<handle kind="file">/Workbench Spies/icons/sample.gif</handle>
</treeExpanded>
</delta>
<interestContribution>0.0</interestContribution>
</interactionEvent>
The delta, once decoded, is:
<treeExpanded position="56,85x500,656">
    <handle kind="file">/Workbench Spies/icons/sample.gif</handle>
</treeExpanded>
This delta indicates that the element corresponding to the directory /Workbench Spies/icons (from the structureKind/structureHandle pair) in the workspace was collapsed, and the directory's child was no longer visible. The position indicates the on-screen location of the corresponding view.
The ca.ubc.cs.mylyn.monitor.analysis plugin includes an example of an automated analysis of a log file with viewport information. To run, create a run profile with ca.ubc.cs.mylyn.monitor.analysis.ViewedElements as the main class. This analyzer takes a set of monitor files and extracts the JDT elements that were viewed.