|
Sensing and Machine Recognition of Interactive Affective Touch |
 |
|
Supporting Haptic Communities of Practice |
 |
|
Personalized Emotion Modelling from Affective Touch with Multimodal Support |
 |
|
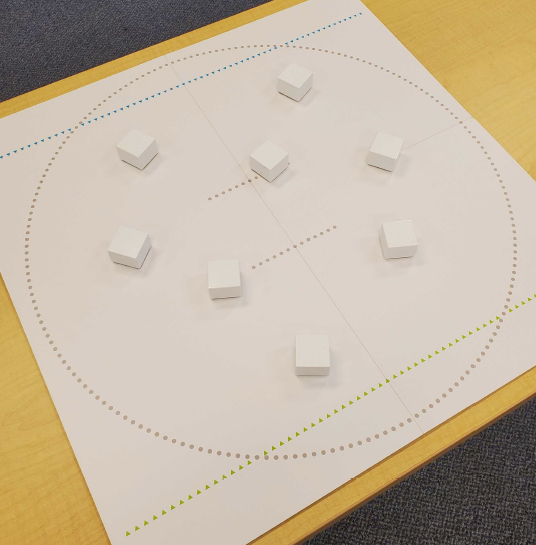
Embodied Group Connections: ESSbots (Emotionally Supportive Swarms) |
 |
|
Creating Haptic Design Tools |
 |
|
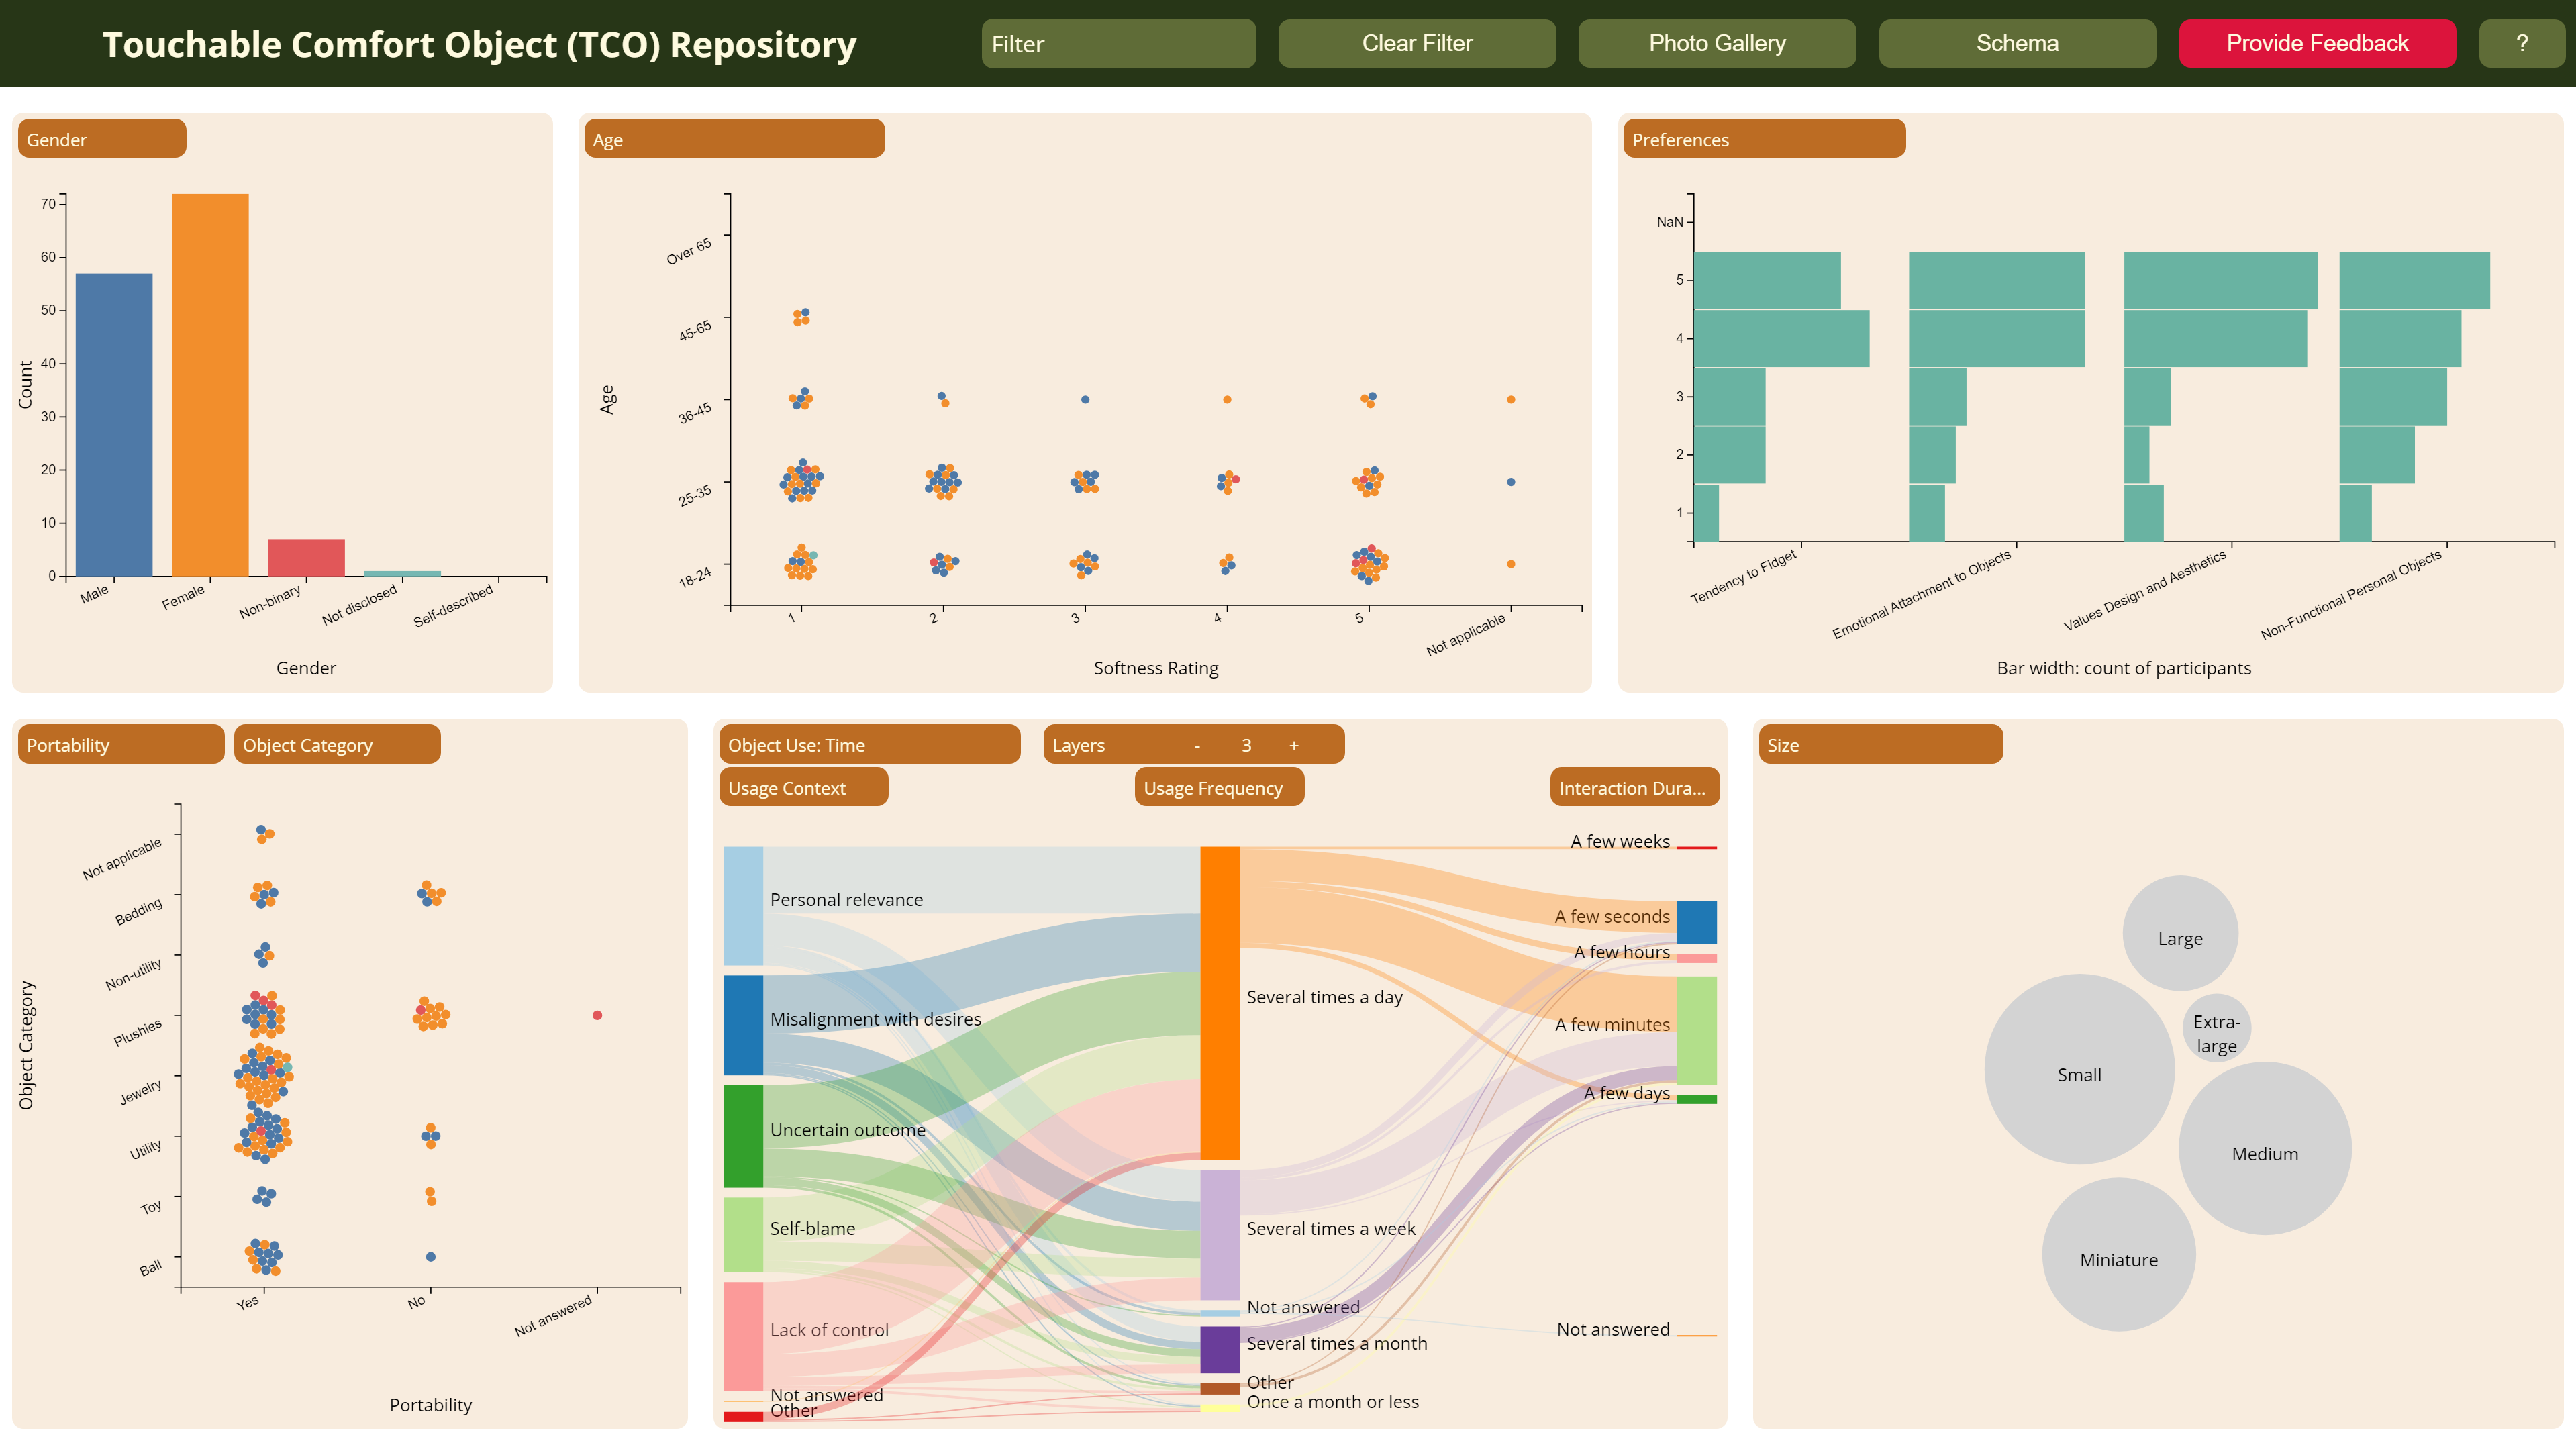
Touchable Comfort Objects |
 |