LiveRAC - Interactive Visual Exploration of System Management Time-Series Data
Peter McLachlan, Tamara
Munzner, Eleftherios
Koutsofios, Stephen North. LiveRAC - Interactive Visual Exploration of System Management Time-Series Data. Proc. SIGCHI Conference on Human Factors in Computing Systems (CHI'08), p 1483-1492, 2008.
Paper
Video
Slides
Abstract
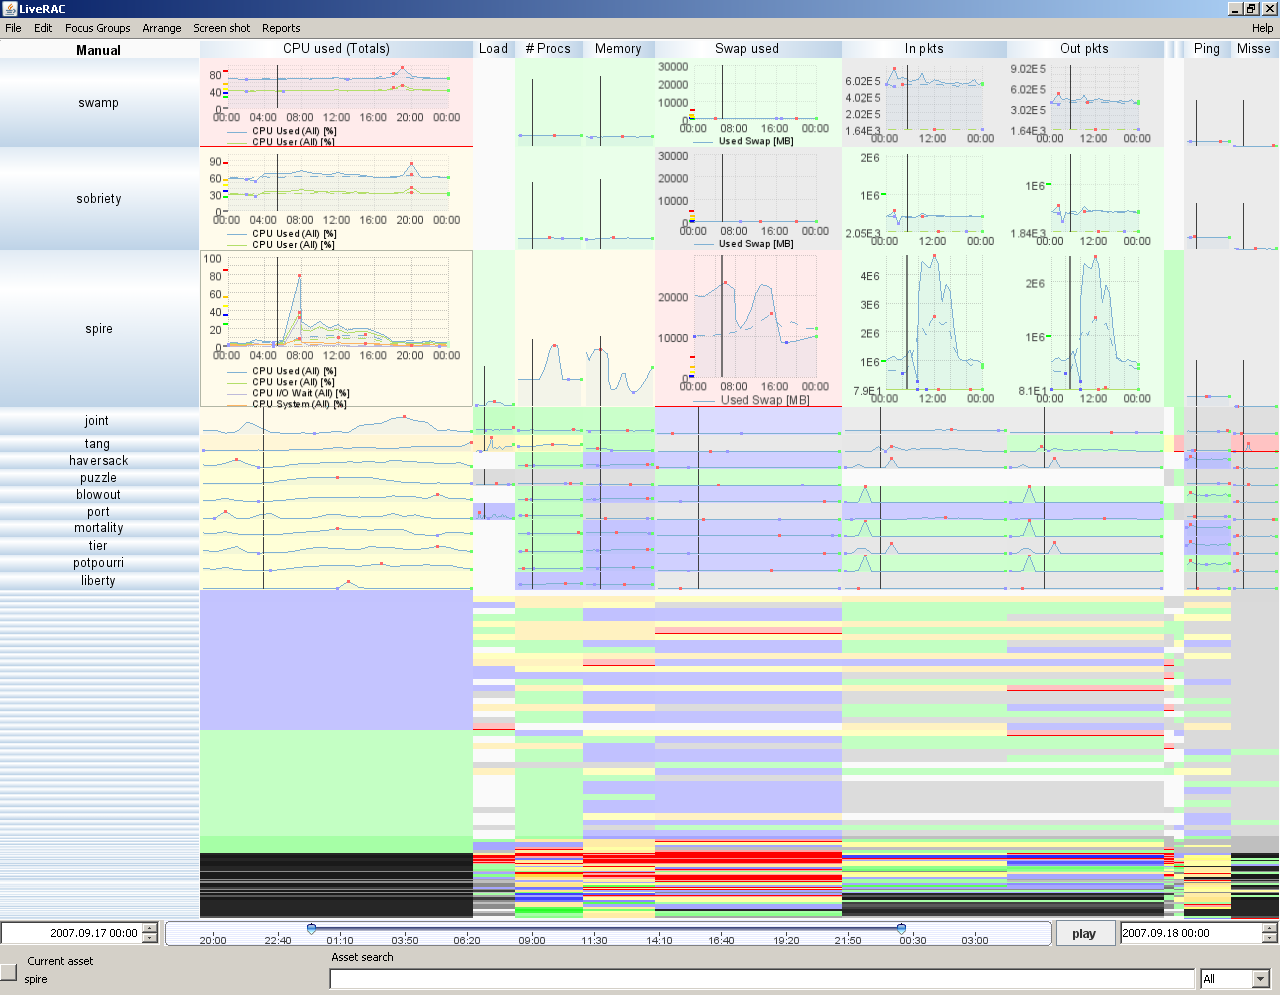
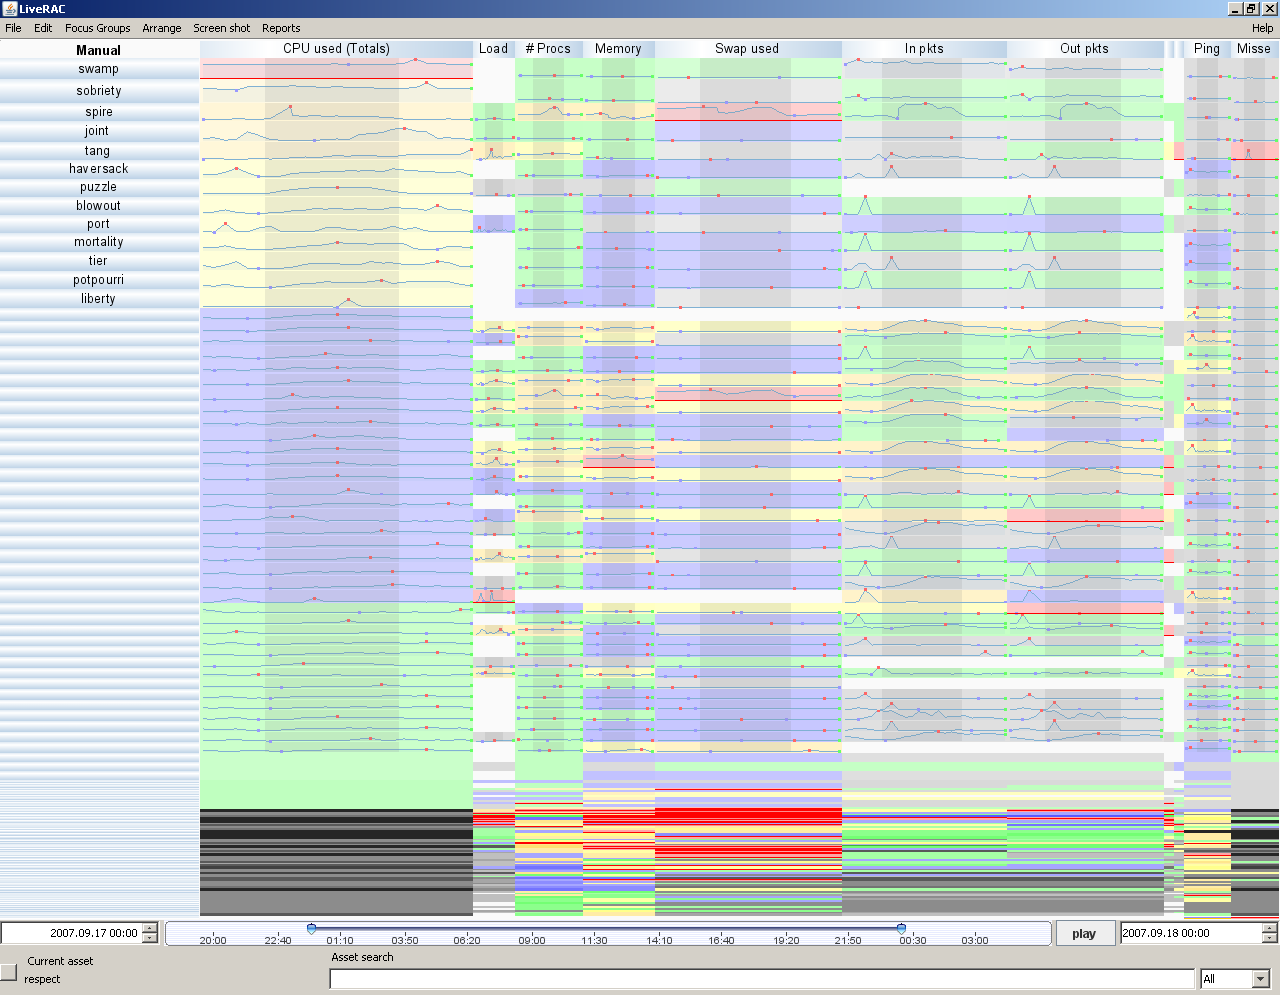
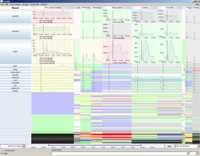
We present LiveRAC, a visualization system that supports
the analysis of large collections of system management timeseries
data consisting of hundreds of parameters across thousands
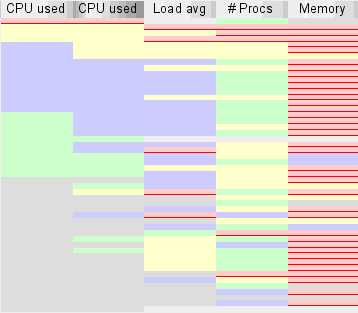
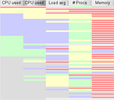
of network devices. LiveRAC provides high information
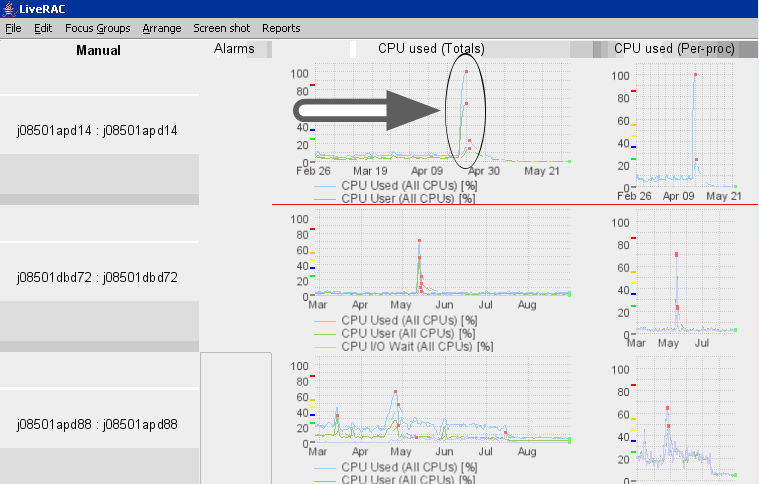
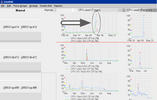
density using a reorderable matrix of charts, with semantic
zooming adapting each chart's visual representation
to the available space. LiveRAC allows side-by-side visual
comparison of arbitrary groupings of devices and parameters
at multiple levels of detail. A staged design and development
process culminated in the deployment of LiveRAC in
a production environment. We conducted an informal longitudinal
evaluation of LiveRAC to better understand which
proposed visualization techniques were most useful in the
target environment.
Figures

Back to Imager pubs
Last modified: Mon Aug 4 15:19:49 PDT 2008